|
|
市場調査レポート
商品コード
1581862
流量計の世界市場、2024~2028年Global Flow Meter Market 2024-2028 |
||||||

|
|||||||
カスタマイズ可能
|
|||||||

| 流量計の世界市場、2024~2028年 |
|
出版日: 2024年08月19日
発行: TechNavio
ページ情報: 英文 185 Pages
納期: 即納可能
|

全表示
- 概要
- 図表
- 目次
流量計市場、2024~2028年
流量計市場は2023~2028年に30億2,560万米ドル、予測期間中のCAGRは5.98%で成長すると予測されます。当レポートでは、流量計市場の全体的な分析、市場規模・予測、動向、成長促進要因、課題、約25のベンダーを網羅したベンダー分析などを掲載しています。
現在の市場シナリオ、最新動向と促進要因、市場環境全体に関する最新分析を提供しています。市場は、流量計に関連する利点に関する意識の高まり、省エネルギーに関連する政府の規制や取り組み、シェールガスの生産量の増加によって牽引されています。
| 市場範囲 | |
|---|---|
| 基準年 | 2024年 |
| 終了年 | 2028年 |
| 予測期間 | 2024~2028年 |
| 成長モメンタム | 加速 |
| 前年比[2024年] | 5.55% |
| CAGR | 5.98% |
| 増分額 | 30億2,560万米ドル |
本調査では、今後数年間の流量計市場成長を牽引する主要要因の一つとして、上流活動の緩やかな回復を挙げています。また、統合DP流量計ソリューションの登場とワイヤレススマートメーターへの需要の高まりは、市場の大きな需要につながります。
目次
第1章 エグゼクティブサマリー
- 市場概要
第2章 市場情勢
- 市場エコシステム
- 市場の特徴
- バリューチェーン分析
第3章 市場規模の評価
- 市場の定義
- 市場セグメント分析
- 市場規模 2023年
- 市場の展望 2023~2028年
第4章 市場規模実績
- 流量計の世界市場 2018~2022年
- エンドユーザー別セグメント分析 2018~2022年
- タイプ別セグメント分析 2018~2022年
- 地域別セグメント分析 2018~2022年
- 国別セグメント分析 2018~2022年
第5章 ファイブフォース分析
- ファイブフォースの要約
- 買い手の交渉力
- 供給企業の交渉力
- 新規参入業者の脅威
- 代替品の脅威
- 競争の脅威
- 市況
第6章 市場セグメンテーション:エンドユーザー別
- 市場セグメンテーション
- 比較:エンドユーザー別
- 産業用:市場規模と予測 2023~2028年
- 商業用:市場規模と予測 2023~2028年
- 住宅用:市場規模と予測 2023~2028年
- エンドユーザー別の市場機会
第7章 市場セグメンテーション:タイプ別
- 市場セグメンテーション
- 比較:タイプ別
- 超音波:市場規模と予測 2023~2028年
- 磁気:市場規模と予測 2023~2028年
- 差圧:市場規模と予測 2023~2028年
- その他:市場規模と予測 2023~2028年
- タイプ別の市場機会
第8章 顧客情勢
- 顧客情勢概要
第9章 地域別情勢
- 地域別セグメンテーション
- 比較:地域別
- 欧州:市場規模と予測 2023~2028年
- 北米:市場規模と予測 2023~2028年
- アジア太平洋:市場規模と予測 2023~2028年
- 南米:市場規模と予測 2023~2028年
- 中東・アフリカ:市場規模と予測 2023~2028年
- ドイツ:市場規模と予測 2023~2028年
- 米国:市場規模と予測 2023~2028年
- 英国:市場規模と予測 2023~2028年
- 中国:市場規模と予測 2023~2028年
- インド:市場規模と予測 2023~2028年
- 地域情勢別の市場機会
第10章 促進要因・課題・機会・抑制要因
- 市場促進要因
- 市場課題
- 促進要因と課題の影響
- 市場機会・抑制要因
第11章 競合情勢
- 概要
- 競合情勢
- 混乱の状況
- 業界のリスク
第12章 競合分析
- 企業プロファイル
- 企業の市場ポジショニング
- ABB Ltd.
- Apator SA
- Electronet Equipments Pvt. Ltd.
- Emerson Electric Co.
- General Electric Co.
- Honeywell International Inc.
- KROHNE Messtechnik GmbH
- Landis Gyr AG
- Max Machinery Inc.
- Omega Engineering Inc.
- Osaki Electric Co. Ltd.
- Schneider Electric SE
- SICK AG
- Siemens AG
- Yokogawa Electric Corp.
第13章 付録
Exhibits:
- Exhibits1: Executive Summary - Chart on Market Overview
- Exhibits2: Executive Summary - Data Table on Market Overview
- Exhibits3: Executive Summary - Chart on Global Market Characteristics
- Exhibits4: Executive Summary - Chart on Market By Geographical Landscape
- Exhibits5: Executive Summary - Chart on Market Segmentation by End-user
- Exhibits6: Executive Summary - Chart on Market Segmentation by Type
- Exhibits7: Executive Summary - Chart on Incremental Growth
- Exhibits8: Executive Summary - Data Table on Incremental Growth
- Exhibits9: Executive Summary - Chart on Company Market Positioning
- Exhibits10: Parent Market
- Exhibits11: Data Table on - Parent Market
- Exhibits12: Market characteristics analysis
- Exhibits13: Value Chain Analysis
- Exhibits14: Offerings of companies included in the market definition
- Exhibits15: Market segments
- Exhibits16: Chart on Global - Market size and forecast 2023-2028 ($ million)
- Exhibits17: Data Table on Global - Market size and forecast 2023-2028 ($ million)
- Exhibits18: Chart on Global Market: Year-over-year growth 2023-2028 (%)
- Exhibits19: Data Table on Global Market: Year-over-year growth 2023-2028 (%)
- Exhibits20: Historic Market Size - Data Table on Global Flow Meter Market 2018 - 2022 ($ million)
- Exhibits21: Historic Market Size - End-user Segment 2018 - 2022 ($ million)
- Exhibits22: Historic Market Size - Type Segment 2018 - 2022 ($ million)
- Exhibits23: Historic Market Size - Geography Segment 2018 - 2022 ($ million)
- Exhibits24: Historic Market Size - Country Segment 2018 - 2022 ($ million)
- Exhibits25: Five forces analysis - Comparison between 2023 and 2028
- Exhibits26: Bargaining power of buyers - Impact of key factors 2023 and 2028
- Exhibits27: Bargaining power of suppliers - Impact of key factors in 2023 and 2028
- Exhibits28: Threat of new entrants - Impact of key factors in 2023 and 2028
- Exhibits29: Threat of substitutes - Impact of key factors in 2023 and 2028
- Exhibits30: Threat of rivalry - Impact of key factors in 2023 and 2028
- Exhibits31: Chart on Market condition - Five forces 2023 and 2028
- Exhibits32: Chart on End-user - Market share 2023-2028 (%)
- Exhibits33: Data Table on End-user - Market share 2023-2028 (%)
- Exhibits34: Chart on Comparison by End-user
- Exhibits35: Data Table on Comparison by End-user
- Exhibits36: Chart on Industrial - Market size and forecast 2023-2028 ($ million)
- Exhibits37: Data Table on Industrial - Market size and forecast 2023-2028 ($ million)
- Exhibits38: Chart on Industrial - Year-over-year growth 2023-2028 (%)
- Exhibits39: Data Table on Industrial - Year-over-year growth 2023-2028 (%)
- Exhibits40: Chart on Commercial - Market size and forecast 2023-2028 ($ million)
- Exhibits41: Data Table on Commercial - Market size and forecast 2023-2028 ($ million)
- Exhibits42: Chart on Commercial - Year-over-year growth 2023-2028 (%)
- Exhibits43: Data Table on Commercial - Year-over-year growth 2023-2028 (%)
- Exhibits44: Chart on Residential - Market size and forecast 2023-2028 ($ million)
- Exhibits45: Data Table on Residential - Market size and forecast 2023-2028 ($ million)
- Exhibits46: Chart on Residential - Year-over-year growth 2023-2028 (%)
- Exhibits47: Data Table on Residential - Year-over-year growth 2023-2028 (%)
- Exhibits48: Market opportunity by End-user ($ million)
- Exhibits49: Data Table on Market opportunity by End-user ($ million)
- Exhibits50: Chart on Type - Market share 2023-2028 (%)
- Exhibits51: Data Table on Type - Market share 2023-2028 (%)
- Exhibits52: Chart on Comparison by Type
- Exhibits53: Data Table on Comparison by Type
- Exhibits54: Chart on Ultrasonic - Market size and forecast 2023-2028 ($ million)
- Exhibits55: Data Table on Ultrasonic - Market size and forecast 2023-2028 ($ million)
- Exhibits56: Chart on Ultrasonic - Year-over-year growth 2023-2028 (%)
- Exhibits57: Data Table on Ultrasonic - Year-over-year growth 2023-2028 (%)
- Exhibits58: Chart on Magnetic - Market size and forecast 2023-2028 ($ million)
- Exhibits59: Data Table on Magnetic - Market size and forecast 2023-2028 ($ million)
- Exhibits60: Chart on Magnetic - Year-over-year growth 2023-2028 (%)
- Exhibits61: Data Table on Magnetic - Year-over-year growth 2023-2028 (%)
- Exhibits62: Chart on Differential pressure - Market size and forecast 2023-2028 ($ million)
- Exhibits63: Data Table on Differential pressure - Market size and forecast 2023-2028 ($ million)
- Exhibits64: Chart on Differential pressure - Year-over-year growth 2023-2028 (%)
- Exhibits65: Data Table on Differential pressure - Year-over-year growth 2023-2028 (%)
- Exhibits66: Chart on Others - Market size and forecast 2023-2028 ($ million)
- Exhibits67: Data Table on Others - Market size and forecast 2023-2028 ($ million)
- Exhibits68: Chart on Others - Year-over-year growth 2023-2028 (%)
- Exhibits69: Data Table on Others - Year-over-year growth 2023-2028 (%)
- Exhibits70: Market opportunity by Type ($ million)
- Exhibits71: Data Table on Market opportunity by Type ($ million)
- Exhibits72: Analysis of price sensitivity, lifecycle, customer purchase basket, adoption rates, and purchase criteria
- Exhibits73: Chart on Market share By Geographical Landscape 2023-2028 (%)
- Exhibits74: Data Table on Market share By Geographical Landscape 2023-2028 (%)
- Exhibits75: Chart on Geographic comparison
- Exhibits76: Data Table on Geographic comparison
- Exhibits77: Chart on Europe - Market size and forecast 2023-2028 ($ million)
- Exhibits78: Data Table on Europe - Market size and forecast 2023-2028 ($ million)
- Exhibits79: Chart on Europe - Year-over-year growth 2023-2028 (%)
- Exhibits80: Data Table on Europe - Year-over-year growth 2023-2028 (%)
- Exhibits81: Chart on North America - Market size and forecast 2023-2028 ($ million)
- Exhibits82: Data Table on North America - Market size and forecast 2023-2028 ($ million)
- Exhibits83: Chart on North America - Year-over-year growth 2023-2028 (%)
- Exhibits84: Data Table on North America - Year-over-year growth 2023-2028 (%)
- Exhibits85: Chart on APAC - Market size and forecast 2023-2028 ($ million)
- Exhibits86: Data Table on APAC - Market size and forecast 2023-2028 ($ million)
- Exhibits87: Chart on APAC - Year-over-year growth 2023-2028 (%)
- Exhibits88: Data Table on APAC - Year-over-year growth 2023-2028 (%)
- Exhibits89: Chart on South America - Market size and forecast 2023-2028 ($ million)
- Exhibits90: Data Table on South America - Market size and forecast 2023-2028 ($ million)
- Exhibits91: Chart on South America - Year-over-year growth 2023-2028 (%)
- Exhibits92: Data Table on South America - Year-over-year growth 2023-2028 (%)
- Exhibits93: Chart on Middle East and Africa - Market size and forecast 2023-2028 ($ million)
- Exhibits94: Data Table on Middle East and Africa - Market size and forecast 2023-2028 ($ million)
- Exhibits95: Chart on Middle East and Africa - Year-over-year growth 2023-2028 (%)
- Exhibits96: Data Table on Middle East and Africa - Year-over-year growth 2023-2028 (%)
- Exhibits97: Chart on Germany - Market size and forecast 2023-2028 ($ million)
- Exhibits98: Data Table on Germany - Market size and forecast 2023-2028 ($ million)
- Exhibits99: Chart on Germany - Year-over-year growth 2023-2028 (%)
- Exhibits100: Data Table on Germany - Year-over-year growth 2023-2028 (%)
- Exhibits101: Chart on US - Market size and forecast 2023-2028 ($ million)
- Exhibits102: Data Table on US - Market size and forecast 2023-2028 ($ million)
- Exhibits103: Chart on US - Year-over-year growth 2023-2028 (%)
- Exhibits104: Data Table on US - Year-over-year growth 2023-2028 (%)
- Exhibits105: Chart on UK - Market size and forecast 2023-2028 ($ million)
- Exhibits106: Data Table on UK - Market size and forecast 2023-2028 ($ million)
- Exhibits107: Chart on UK - Year-over-year growth 2023-2028 (%)
- Exhibits108: Data Table on UK - Year-over-year growth 2023-2028 (%)
- Exhibits109: Chart on China - Market size and forecast 2023-2028 ($ million)
- Exhibits110: Data Table on China - Market size and forecast 2023-2028 ($ million)
- Exhibits111: Chart on China - Year-over-year growth 2023-2028 (%)
- Exhibits112: Data Table on China - Year-over-year growth 2023-2028 (%)
- Exhibits113: Chart on India - Market size and forecast 2023-2028 ($ million)
- Exhibits114: Data Table on India - Market size and forecast 2023-2028 ($ million)
- Exhibits115: Chart on India - Year-over-year growth 2023-2028 (%)
- Exhibits116: Data Table on India - Year-over-year growth 2023-2028 (%)
- Exhibits117: Market opportunity By Geographical Landscape ($ million)
- Exhibits118: Data Tables on Market opportunity By Geographical Landscape ($ million)
- Exhibits119: Impact of drivers and challenges in 2023 and 2028
- Exhibits120: Overview on criticality of inputs and factors of differentiation
- Exhibits121: Overview on factors of disruption
- Exhibits122: Impact of key risks on business
- Exhibits123: Companies covered
- Exhibits124: Matrix on companies position and classification
- Exhibits125: ABB Ltd. - Overview
- Exhibits126: ABB Ltd. - Business segments
- Exhibits127: ABB Ltd. - Key news
- Exhibits128: ABB Ltd. - Key offerings
- Exhibits129: ABB Ltd. - Segment focus
- Exhibits130: Apator SA - Overview
- Exhibits131: Apator SA - Product / Service
- Exhibits132: Apator SA - Key offerings
- Exhibits133: Electronet Equipments Pvt. Ltd. - Overview
- Exhibits134: Electronet Equipments Pvt. Ltd. - Product / Service
- Exhibits135: Electronet Equipments Pvt. Ltd. - Key offerings
- Exhibits136: Emerson Electric Co. - Overview
- Exhibits137: Emerson Electric Co. - Business segments
- Exhibits138: Emerson Electric Co. - Key news
- Exhibits139: Emerson Electric Co. - Key offerings
- Exhibits140: Emerson Electric Co. - Segment focus
- Exhibits141: General Electric Co. - Overview
- Exhibits142: General Electric Co. - Business segments
- Exhibits143: General Electric Co. - Key news
- Exhibits144: General Electric Co. - Key offerings
- Exhibits145: General Electric Co. - Segment focus
- Exhibits146: Honeywell International Inc. - Overview
- Exhibits147: Honeywell International Inc. - Business segments
- Exhibits148: Honeywell International Inc. - Key news
- Exhibits149: Honeywell International Inc. - Key offerings
- Exhibits150: Honeywell International Inc. - Segment focus
- Exhibits151: KROHNE Messtechnik GmbH - Overview
- Exhibits152: KROHNE Messtechnik GmbH - Product / Service
- Exhibits153: KROHNE Messtechnik GmbH - Key news
- Exhibits154: KROHNE Messtechnik GmbH - Key offerings
- Exhibits155: Landis Gyr AG - Overview
- Exhibits156: Landis Gyr AG - Business segments
- Exhibits157: Landis Gyr AG - Key offerings
- Exhibits158: Landis Gyr AG - Segment focus
- Exhibits159: Max Machinery Inc. - Overview
- Exhibits160: Max Machinery Inc. - Product / Service
- Exhibits161: Max Machinery Inc. - Key offerings
- Exhibits162: Omega Engineering Inc. - Overview
- Exhibits163: Omega Engineering Inc. - Product / Service
- Exhibits164: Omega Engineering Inc. - Key offerings
- Exhibits165: Osaki Electric Co. Ltd. - Overview
- Exhibits166: Osaki Electric Co. Ltd. - Product / Service
- Exhibits167: Osaki Electric Co. Ltd. - Key offerings
- Exhibits168: Schneider Electric SE - Overview
- Exhibits169: Schneider Electric SE - Business segments
- Exhibits170: Schneider Electric SE - Key news
- Exhibits171: Schneider Electric SE - Key offerings
- Exhibits172: Schneider Electric SE - Segment focus
- Exhibits173: SICK AG - Overview
- Exhibits174: SICK AG - Product / Service
- Exhibits175: SICK AG - Key offerings
- Exhibits176: Siemens AG - Overview
- Exhibits177: Siemens AG - Business segments
- Exhibits178: Siemens AG - Key news
- Exhibits179: Siemens AG - Key offerings
- Exhibits180: Siemens AG - Segment focus
- Exhibits181: Yokogawa Electric Corp. - Overview
- Exhibits182: Yokogawa Electric Corp. - Business segments
- Exhibits183: Yokogawa Electric Corp. - Key news
- Exhibits184: Yokogawa Electric Corp. - Key offerings
- Exhibits185: Yokogawa Electric Corp. - Segment focus
- Exhibits186: Inclusions checklist
- Exhibits187: Exclusions checklist
- Exhibits188: Currency conversion rates for US$
- Exhibits189: Research methodology
- Exhibits190: Information sources
- Exhibits191: Data validation
- Exhibits192: Validation techniques employed for market sizing
- Exhibits193: Data synthesis
- Exhibits194: 360 degree market analysis
- Exhibits195: List of abbreviations
Flow Meter Market 2024-2028
The flow meter market is forecasted to grow by USD 3025.6 mn during 2023-2028, accelerating at a CAGR of 5.98% during the forecast period. The report on the flow meter market provides a holistic analysis, market size and forecast, trends, growth drivers, and challenges, as well as vendor analysis covering around 25 vendors.
The report offers an up-to-date analysis regarding the current market scenario, the latest trends and drivers, and the overall market environment. The market is driven by rising awareness on benefits associated with flow meters, government regulations and initiatives related to energy conservation, and rising production of shale gas.
| Market Scope | |
|---|---|
| Base Year | 2024 |
| End Year | 2028 |
| Series Year | 2024-2028 |
| Growth Momentum | Accelerate |
| YOY 2024 | 5.55% |
| CAGR | 5.98% |
| Incremental Value | $3025.6 mn |
Technavio's flow meter market is segmented as below:
By End-user
- Industrial
- Commercial
- Residential
By Type
- Ultrasonic
- Magnetic
- Differential pressure
- Others
By Geographical Landscape
- Europe
- North America
- APAC
- South America
- Middle East and Africa
This study identifies the gradual recovery of upstream activity as one of the prime reasons driving the flow meter market growth during the next few years. Also, advent of integrated DP flow meter solutions and growing demand for wireless smart meters will lead to sizable demand in the market.
The report on the flow meter market covers the following areas:
- Flow meter market sizing
- Flow meter market forecast
- Flow meter market industry analysis
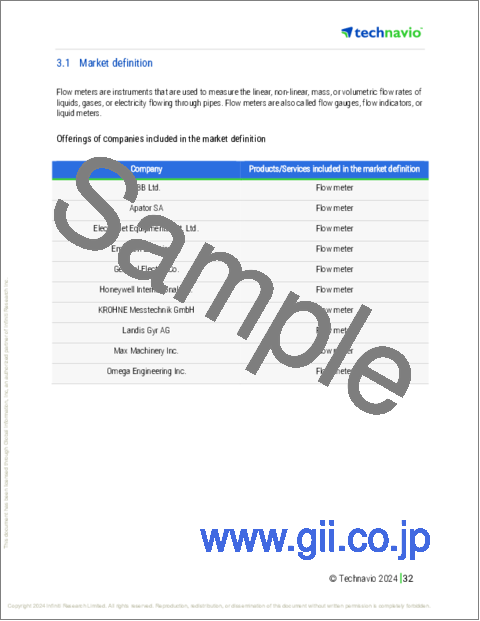
The robust vendor analysis is designed to help clients improve their market position, and in line with this, this report provides a detailed analysis of several leading flow meter market vendors that include ABB Ltd., Apator SA, Azbil Corp., Badger Meter Inc., Electronet Equipments Pvt. Ltd., Emerson Electric Co., Endress Hauser Group Services AG, Forbes Marshall Pvt. Ltd., General Electric Co., Honeywell International Inc., KROHNE Messtechnik GmbH, Landis Gyr AG, Max Machinery Inc., Omega Engineering Inc., Osaki Electric Co. Ltd., Schneider Electric SE, SICK AG, Siemens AG, Toshiba Corp., and Yokogawa Electric Corp.. Also, the flow meter market analysis report includes information on upcoming trends and challenges that will influence market growth. This is to help companies strategize and leverage all forthcoming growth opportunities.
The study was conducted using an objective combination of primary and secondary information including inputs from key participants in the industry. The report contains a comprehensive market and vendor landscape in addition to an analysis of the key vendors.
The publisher presents a detailed picture of the market by the way of study, synthesis, and summation of data from multiple sources by an analysis of key parameters such as profit, pricing, competition, and promotions. It presents various market facets by identifying the key industry influencers. The data presented is comprehensive, reliable, and a result of extensive primary and secondary research. The market research reports provide a complete competitive landscape and an in-depth vendor selection methodology and analysis using qualitative and quantitative research to forecast accurate market growth.
Table of Contents
1 Executive Summary
- 1.1 Market overview
- Executive Summary - Chart on Market Overview
- Executive Summary - Data Table on Market Overview
- Executive Summary - Chart on Global Market Characteristics
- Executive Summary - Chart on Market By Geographical Landscape
- Executive Summary - Chart on Market Segmentation by End-user
- Executive Summary - Chart on Market Segmentation by Type
- Executive Summary - Chart on Incremental Growth
- Executive Summary - Data Table on Incremental Growth
- Executive Summary - Chart on Company Market Positioning
2 Market Landscape
- 2.1 Market ecosystem
- Parent Market
- Data Table on - Parent Market
- 2.2 Market characteristics
- Market characteristics analysis
- 2.3 Value chain analysis
- Value Chain Analysis
3 Market Sizing
- 3.1 Market definition
- Offerings of companies included in the market definition
- 3.2 Market segment analysis
- Market segments
- 3.3 Market size 2023
- 3.4 Market outlook: Forecast for 2023-2028
- Chart on Global - Market size and forecast 2023-2028 ($ million)
- Data Table on Global - Market size and forecast 2023-2028 ($ million)
- Chart on Global Market: Year-over-year growth 2023-2028 (%)
- Data Table on Global Market: Year-over-year growth 2023-2028 (%)
4 Historic Market Size
- 4.1 Global Flow Meter Market 2018 - 2022
- Historic Market Size - Data Table on Global Flow Meter Market 2018 - 2022 ($ million)
- 4.2 End-user segment analysis 2018 - 2022
- Historic Market Size - End-user Segment 2018 - 2022 ($ million)
- 4.3 Type segment analysis 2018 - 2022
- Historic Market Size - Type Segment 2018 - 2022 ($ million)
- 4.4 Geography segment analysis 2018 - 2022
- Historic Market Size - Geography Segment 2018 - 2022 ($ million)
- 4.5 Country segment analysis 2018 - 2022
- Historic Market Size - Country Segment 2018 - 2022 ($ million)
5 Five Forces Analysis
- 5.1 Five forces summary
- Five forces analysis - Comparison between 2023 and 2028
- 5.2 Bargaining power of buyers
- Bargaining power of buyers - Impact of key factors 2023 and 2028
- 5.3 Bargaining power of suppliers
- Bargaining power of suppliers - Impact of key factors in 2023 and 2028
- 5.4 Threat of new entrants
- Threat of new entrants - Impact of key factors in 2023 and 2028
- 5.5 Threat of substitutes
- Threat of substitutes - Impact of key factors in 2023 and 2028
- 5.6 Threat of rivalry
- Threat of rivalry - Impact of key factors in 2023 and 2028
- 5.7 Market condition
- Chart on Market condition - Five forces 2023 and 2028
6 Market Segmentation by End-user
- 6.1 Market segments
- Chart on End-user - Market share 2023-2028 (%)
- Data Table on End-user - Market share 2023-2028 (%)
- 6.2 Comparison by End-user
- Chart on Comparison by End-user
- Data Table on Comparison by End-user
- 6.3 Industrial - Market size and forecast 2023-2028
- Chart on Industrial - Market size and forecast 2023-2028 ($ million)
- Data Table on Industrial - Market size and forecast 2023-2028 ($ million)
- Chart on Industrial - Year-over-year growth 2023-2028 (%)
- Data Table on Industrial - Year-over-year growth 2023-2028 (%)
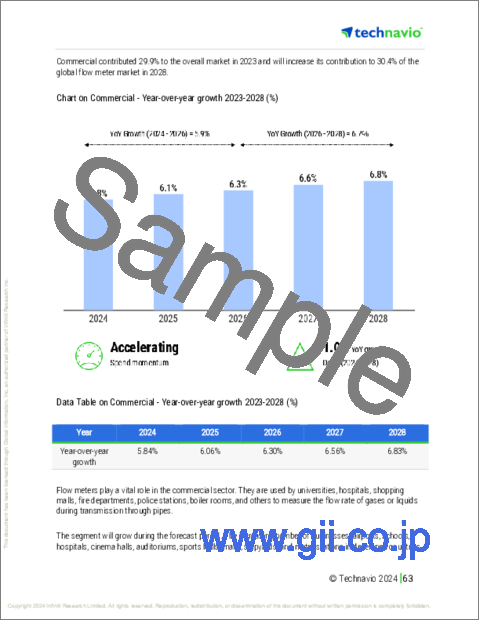
- 6.4 Commercial - Market size and forecast 2023-2028
- Chart on Commercial - Market size and forecast 2023-2028 ($ million)
- Data Table on Commercial - Market size and forecast 2023-2028 ($ million)
- Chart on Commercial - Year-over-year growth 2023-2028 (%)
- Data Table on Commercial - Year-over-year growth 2023-2028 (%)
- 6.5 Residential - Market size and forecast 2023-2028
- Chart on Residential - Market size and forecast 2023-2028 ($ million)
- Data Table on Residential - Market size and forecast 2023-2028 ($ million)
- Chart on Residential - Year-over-year growth 2023-2028 (%)
- Data Table on Residential - Year-over-year growth 2023-2028 (%)
- 6.6 Market opportunity by End-user
- Market opportunity by End-user ($ million)
- Data Table on Market opportunity by End-user ($ million)
7 Market Segmentation by Type
- 7.1 Market segments
- Chart on Type - Market share 2023-2028 (%)
- Data Table on Type - Market share 2023-2028 (%)
- 7.2 Comparison by Type
- Chart on Comparison by Type
- Data Table on Comparison by Type
- 7.3 Ultrasonic - Market size and forecast 2023-2028
- Chart on Ultrasonic - Market size and forecast 2023-2028 ($ million)
- Data Table on Ultrasonic - Market size and forecast 2023-2028 ($ million)
- Chart on Ultrasonic - Year-over-year growth 2023-2028 (%)
- Data Table on Ultrasonic - Year-over-year growth 2023-2028 (%)
- 7.4 Magnetic - Market size and forecast 2023-2028
- Chart on Magnetic - Market size and forecast 2023-2028 ($ million)
- Data Table on Magnetic - Market size and forecast 2023-2028 ($ million)
- Chart on Magnetic - Year-over-year growth 2023-2028 (%)
- Data Table on Magnetic - Year-over-year growth 2023-2028 (%)
- 7.5 Differential pressure - Market size and forecast 2023-2028
- Chart on Differential pressure - Market size and forecast 2023-2028 ($ million)
- Data Table on Differential pressure - Market size and forecast 2023-2028 ($ million)
- Chart on Differential pressure - Year-over-year growth 2023-2028 (%)
- Data Table on Differential pressure - Year-over-year growth 2023-2028 (%)
- 7.6 Others - Market size and forecast 2023-2028
- Chart on Others - Market size and forecast 2023-2028 ($ million)
- Data Table on Others - Market size and forecast 2023-2028 ($ million)
- Chart on Others - Year-over-year growth 2023-2028 (%)
- Data Table on Others - Year-over-year growth 2023-2028 (%)
- 7.7 Market opportunity by Type
- Market opportunity by Type ($ million)
- Data Table on Market opportunity by Type ($ million)
8 Customer Landscape
- 8.1 Customer landscape overview
- Analysis of price sensitivity, lifecycle, customer purchase basket, adoption rates, and purchase criteria
9 Geographic Landscape
- 9.1 Geographic segmentation
- Chart on Market share By Geographical Landscape 2023-2028 (%)
- Data Table on Market share By Geographical Landscape 2023-2028 (%)
- 9.2 Geographic comparison
- Chart on Geographic comparison
- Data Table on Geographic comparison
- 9.3 Europe - Market size and forecast 2023-2028
- Chart on Europe - Market size and forecast 2023-2028 ($ million)
- Data Table on Europe - Market size and forecast 2023-2028 ($ million)
- Chart on Europe - Year-over-year growth 2023-2028 (%)
- Data Table on Europe - Year-over-year growth 2023-2028 (%)
- 9.4 North America - Market size and forecast 2023-2028
- Chart on North America - Market size and forecast 2023-2028 ($ million)
- Data Table on North America - Market size and forecast 2023-2028 ($ million)
- Chart on North America - Year-over-year growth 2023-2028 (%)
- Data Table on North America - Year-over-year growth 2023-2028 (%)
- 9.5 APAC - Market size and forecast 2023-2028
- Chart on APAC - Market size and forecast 2023-2028 ($ million)
- Data Table on APAC - Market size and forecast 2023-2028 ($ million)
- Chart on APAC - Year-over-year growth 2023-2028 (%)
- Data Table on APAC - Year-over-year growth 2023-2028 (%)
- 9.6 South America - Market size and forecast 2023-2028
- Chart on South America - Market size and forecast 2023-2028 ($ million)
- Data Table on South America - Market size and forecast 2023-2028 ($ million)
- Chart on South America - Year-over-year growth 2023-2028 (%)
- Data Table on South America - Year-over-year growth 2023-2028 (%)
- 9.7 Middle East and Africa - Market size and forecast 2023-2028
- Chart on Middle East and Africa - Market size and forecast 2023-2028 ($ million)
- Data Table on Middle East and Africa - Market size and forecast 2023-2028 ($ million)
- Chart on Middle East and Africa - Year-over-year growth 2023-2028 (%)
- Data Table on Middle East and Africa - Year-over-year growth 2023-2028 (%)
- 9.8 Germany - Market size and forecast 2023-2028
- Chart on Germany - Market size and forecast 2023-2028 ($ million)
- Data Table on Germany - Market size and forecast 2023-2028 ($ million)
- Chart on Germany - Year-over-year growth 2023-2028 (%)
- Data Table on Germany - Year-over-year growth 2023-2028 (%)
- 9.9 US - Market size and forecast 2023-2028
- Chart on US - Market size and forecast 2023-2028 ($ million)
- Data Table on US - Market size and forecast 2023-2028 ($ million)
- Chart on US - Year-over-year growth 2023-2028 (%)
- Data Table on US - Year-over-year growth 2023-2028 (%)
- 9.10 UK - Market size and forecast 2023-2028
- Chart on UK - Market size and forecast 2023-2028 ($ million)
- Data Table on UK - Market size and forecast 2023-2028 ($ million)
- Chart on UK - Year-over-year growth 2023-2028 (%)
- Data Table on UK - Year-over-year growth 2023-2028 (%)
- 9.11 China - Market size and forecast 2023-2028
- Chart on China - Market size and forecast 2023-2028 ($ million)
- Data Table on China - Market size and forecast 2023-2028 ($ million)
- Chart on China - Year-over-year growth 2023-2028 (%)
- Data Table on China - Year-over-year growth 2023-2028 (%)
- 9.12 India - Market size and forecast 2023-2028
- Chart on India - Market size and forecast 2023-2028 ($ million)
- Data Table on India - Market size and forecast 2023-2028 ($ million)
- Chart on India - Year-over-year growth 2023-2028 (%)
- Data Table on India - Year-over-year growth 2023-2028 (%)
- 9.13 Market opportunity By Geographical Landscape
- Market opportunity By Geographical Landscape ($ million)
- Data Tables on Market opportunity By Geographical Landscape ($ million)
10 Drivers, Challenges, and Opportunity/Restraints
- 10.1 Market drivers
- 10.2 Market challenges
- 10.3 Impact of drivers and challenges
- Impact of drivers and challenges in 2023 and 2028
- 10.4 Market opportunities/restraints
11 Competitive Landscape
- 11.1 Overview
- 11.2 Competitive Landscape
- Overview on criticality of inputs and factors of differentiation
- 11.3 Landscape disruption
- Overview on factors of disruption
- 11.4 Industry risks
- Impact of key risks on business
12 Competitive Analysis
- 12.1 Companies profiled
- Companies covered
- 12.2 Market positioning of companies
- Matrix on companies position and classification
- 12.3 ABB Ltd.
- ABB Ltd. - Overview
- ABB Ltd. - Business segments
- ABB Ltd. - Key news
- ABB Ltd. - Key offerings
- ABB Ltd. - Segment focus
- 12.4 Apator SA
- Apator SA - Overview
- Apator SA - Product / Service
- Apator SA - Key offerings
- 12.5 Electronet Equipments Pvt. Ltd.
- Electronet Equipments Pvt. Ltd. - Overview
- Electronet Equipments Pvt. Ltd. - Product / Service
- Electronet Equipments Pvt. Ltd. - Key offerings
- 12.6 Emerson Electric Co.
- Emerson Electric Co. - Overview
- Emerson Electric Co. - Business segments
- Emerson Electric Co. - Key news
- Emerson Electric Co. - Key offerings
- Emerson Electric Co. - Segment focus
- 12.7 General Electric Co.
- General Electric Co. - Overview
- General Electric Co. - Business segments
- General Electric Co. - Key news
- General Electric Co. - Key offerings
- General Electric Co. - Segment focus
- 12.8 Honeywell International Inc.
- Honeywell International Inc. - Overview
- Honeywell International Inc. - Business segments
- Honeywell International Inc. - Key news
- Honeywell International Inc. - Key offerings
- Honeywell International Inc. - Segment focus
- 12.9 KROHNE Messtechnik GmbH
- KROHNE Messtechnik GmbH - Overview
- KROHNE Messtechnik GmbH - Product / Service
- KROHNE Messtechnik GmbH - Key news
- KROHNE Messtechnik GmbH - Key offerings
- 12.10 Landis Gyr AG
- Landis Gyr AG - Overview
- Landis Gyr AG - Business segments
- Landis Gyr AG - Key offerings
- Landis Gyr AG - Segment focus
- 12.11 Max Machinery Inc.
- Max Machinery Inc. - Overview
- Max Machinery Inc. - Product / Service
- Max Machinery Inc. - Key offerings
- 12.12 Omega Engineering Inc.
- Omega Engineering Inc. - Overview
- Omega Engineering Inc. - Product / Service
- Omega Engineering Inc. - Key offerings
- 12.13 Osaki Electric Co. Ltd.
- Osaki Electric Co. Ltd. - Overview
- Osaki Electric Co. Ltd. - Product / Service
- Osaki Electric Co. Ltd. - Key offerings
- 12.14 Schneider Electric SE
- Schneider Electric SE - Overview
- Schneider Electric SE - Business segments
- Schneider Electric SE - Key news
- Schneider Electric SE - Key offerings
- Schneider Electric SE - Segment focus
- 12.15 SICK AG
- SICK AG - Overview
- SICK AG - Product / Service
- SICK AG - Key offerings
- 12.16 Siemens AG
- Siemens AG - Overview
- Siemens AG - Business segments
- Siemens AG - Key news
- Siemens AG - Key offerings
- Siemens AG - Segment focus
- 12.17 Yokogawa Electric Corp.
- Yokogawa Electric Corp. - Overview
- Yokogawa Electric Corp. - Business segments
- Yokogawa Electric Corp. - Key news
- Yokogawa Electric Corp. - Key offerings
- Yokogawa Electric Corp. - Segment focus
13 Appendix
- 13.1 Scope of the report
- 13.2 Inclusions and exclusions checklist
- Inclusions checklist
- Exclusions checklist
- 13.3 Currency conversion rates for US$
- Currency conversion rates for US$
- 13.4 Research methodology
- Research methodology
- 13.5 Data procurement
- Information sources
- 13.6 Data validation
- Data validation
- 13.7 Validation techniques employed for market sizing
- Validation techniques employed for market sizing
- 13.8 Data synthesis
- Data synthesis
- 13.9 360 degree market analysis
- 360 degree market analysis
- 13.10 List of abbreviations
- List of abbreviations

