|
|
市場調査レポート
商品コード
1908432
世界の筋電図(EMG)機器市場2026-2030年Global Electromyography (Emg) Devices Market 2026-2030 |
||||||
|
|||||||
カスタマイズ可能
|
|||||||


| 世界の筋電図(EMG)機器市場2026-2030年 |
|
出版日: 2026年01月14日
発行: TechNavio
ページ情報: 英文 294 Pages
納期: 即納可能
|

概要
世界の筋電図(EMG)装置市場は、2025年から2030年の予測期間において、CAGR 7.8%で成長し、5億930万米ドル規模に拡大すると予測されております。
本報告書は、世界の筋電図(EMG)装置市場に関する包括的な分析、市場規模と予測、動向、成長要因、課題、ならびに約25社のベンダー分析を提供します。
本レポートは、現在の市場状況、最新の動向と促進要因、市場環境全般に関する最新の分析を提供します。市場は、神経系および筋骨格系疾患の有病率の上昇、EMG装置の設計と機能性における技術的進歩、リハビリテーションおよび理学療法におけるEMG装置の需要増加によって牽引されています。
本調査は、業界の主要関係者からの情報を含む、一次情報と二次情報の客観的な組み合わせを用いて実施されました。本レポートには、主要企業の分析に加え、包括的な市場規模データ、地域別分析を伴うセグメント、ベンダー情勢が含まれています。レポートには過去データと予測データが記載されています。
| 市場範囲 | |
|---|---|
| 基準年 | 2026年 |
| 終了年 | 2030年 |
| 予測期間 | 2026-2030 |
| 成長モメンタム | 加速 |
| 前年比2026年 | 7.1% |
| CAGR | 7.8% |
| 増分額 | 5億930万米ドル |
本調査では、今後数年間における世界の筋電図(EMG)デバイス市場成長を牽引する主要要因の一つとして、携帯型およびポイントオブケア型EMGデバイスの採用拡大を挙げております。また、EMGデータのデジタルヘルスおよび分析プラットフォームとの統合、ならびに従来の神経学領域を超えたEMGアプリケーションの拡大が、市場における相当な需要を生み出すものと見込まれます。
目次
第1章 エグゼクティブサマリー
- 市場概要
第2章 Technavio分析
- 価格・ライフサイクル・顧客購入バスケット・採用率・購入基準の分析
- インプットの重要性と差別化の要因
- 混乱の要因
- 促進要因と課題の影響
第3章 市場情勢
- 市場エコシステム
- 市場の特徴
- バリューチェーン分析
第4章 市場規模
- 市場の定義
- 市場セグメント分析
- 市場規模 2025
- 市場の見通し 2025-2030
第5章 市場規模実績
- 世界の筋電図(EMG)機器市場 2020-2024
- エンドユーザーセグメント分析 2020-2024
- 測定法別セグメント分析 2020-2024
- 用途別セグメント分析 2020-2024
- 地域別セグメント分析 2020-2024
- 国別セグメント分析 2020-2024
第6章 定性分析
- AIの影響:世界の筋電図(EMG)機器市場
第7章 ファイブフォース分析
- ファイブフォースの要約
- 買い手の交渉力
- 供給企業の交渉力
- 新規参入業者の脅威
- 代替品の脅威
- 競争の脅威
- 市況
第8章 市場セグメンテーション:エンドユーザー別
- 市場セグメント
- 比較:エンドユーザー別
- 病院および診療所:市場規模と予測 2025-2030
- リハビリテーションセンター:市場規模と予測 2025-2030
- 在宅ケア:市場規模と予測 2025-2030
- 市場機会:エンドユーザー別
第9章 市場セグメンテーション:モダリティ別
- 市場セグメント
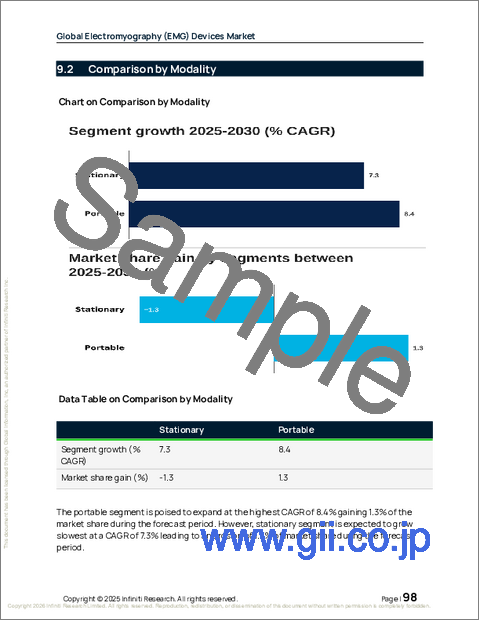
- 比較:モダリティ別
- 据置型:市場規模と予測 2025-2030
- ポータブル:市場規模と予測 2025-2030
- 市場機会:モダリティ別
第10章 市場セグメンテーション:用途別
- 市場セグメント
- 比較:用途別
- 臨床診断:市場規模と予測 2025-2030
- スポーツおよび生体力学:市場規模と予測 2025-2030
- 調査機関・学術機関:市場規模と予測 2025-2030
- その他:市場規模と予測 2025-2030
- 市場機会:用途別
第11章 顧客情勢
- 顧客情勢の概要
第12章 地域別情勢
- 地域別セグメンテーション
- 地域別比較
- 北米:市場規模と予測 2025-2030
- 欧州:市場規模と予測 2025-2030
- アジア:市場規模と予測 2025-2030
- 世界のその他の地域:市場規模と予測 2025-2030
- 市場機会:地域別
第13章 促進要因、課題、および機会
- 市場促進要因
- 市場の課題
- 促進要因と課題の影響
- 市場機会
第14章 競合情勢
- 概要
- 競合情勢
- 混乱の状況
- 業界のリスク
第15章 競合分析
- 企業プロファイル
- 企業ランキング指標
- 企業の市場ポジショニング
- ADInstruments Pty Ltd.
- Ambu AS
- Biometrics Ltd.
- BTS Bioengineering Corp.
- Cadwell Industries Inc.
- Clarity Medical Pvt. Ltd.
- Cometa srl
- Compumedics Ltd.
- Delsys Inc.
- DEYMED Diagnostic sro
- Medtronic Plc
- Natus Medical Inc.
- NCC Medical Co. Ltd.
- Nihon Kohden Corp.
- Noraxon USA Inc.

