|
|
市場調査レポート
商品コード
1915381
ウルトラHDテレビ(UHD TV)の世界市場、2025年~2029年Global Ultra Hd Television (UHD TV) Market 2025-2029 |
||||||
|
|||||||
カスタマイズ可能
|
|||||||

| ウルトラHDテレビ(UHD TV)の世界市場、2025年~2029年 |
|
出版日: 2026年01月19日
発行: TechNavio
ページ情報: 英文 300 Pages
納期: 即納可能
|

概要
世界のウルトラHDテレビ(UHD TV)市場は、2024年から2029年の予測期間中にCAGR12.3%で成長し、1,770億9,150万米ドル規模に達すると予測されています。
世界のウルトラHDテレビ(UHD TV)市場に関する本レポートでは、包括的な分析、市場規模と予測、動向、成長要因、課題に加え、約25社のベンダー分析を提供しています。
本レポートは、現在の市場状況、最新の動向と促進要因、市場環境全般に関する最新の分析を提供します。市場は、UHDテレビへの需要、大型ディスプレイテレビの人気の高まり、ゲーム用途への需要増加によって牽引されています。
本調査は、業界の主要関係者からの情報を含む、一次情報と二次情報の客観的な組み合わせを用いて実施されました。本レポートには、主要企業の分析に加え、包括的な市場規模データ、地域別分析を伴うセグメント、ベンダー情勢が含まれています。レポートには過去データと予測データが掲載されています。
| 市場範囲 | |
|---|---|
| 基準年 | 2025年 |
| 終了年 | 2029年 |
| 予測期間 | 2025年~2029年 |
| 成長モメンタム | 加速 |
| 前年比 | 11.1% |
| CAGR | 12.3% |
| 増分額 | 1,770億9,150万米ドル |
本調査では、今後数年間における世界のウルトラHDテレビ(UHD TV)市場の成長を牽引する主要な要因の一つとして、8K UHDテレビの登場を挙げています。また、スマートテレビへの需要の高まりとUHDテレビの技術革新が、市場において相当な需要を生み出すものと見込まれます。
目次
第1章 エグゼクティブサマリー
第2章 Technavio分析
- 価格反応性・ライフサイクル・顧客購入バスケット・採用率・購入基準の分析
- インプットの重要性と差別化の要因
- 混乱の要因
- 促進要因と課題の影響
第3章 市場情勢
- 市場エコシステム
- 市場の特徴
- バリューチェーン分析
第4章 市場規模
- 市場の定義
- 市場セグメント分析
- 市場規模、2024年
- 市場の見通し、2024年~2029年
第5章 市場規模実績
- 世界のウルトラHDテレビ(UHD TV)市場、2019年~2023年
- ディスプレイタイプセグメント分析、2019年~2023年
- 画面サイズ別セグメント分析、2019年~2023年
- タイプセグメント分析、2019年~2023年
- 地域別セグメント分析、2019年~2023年
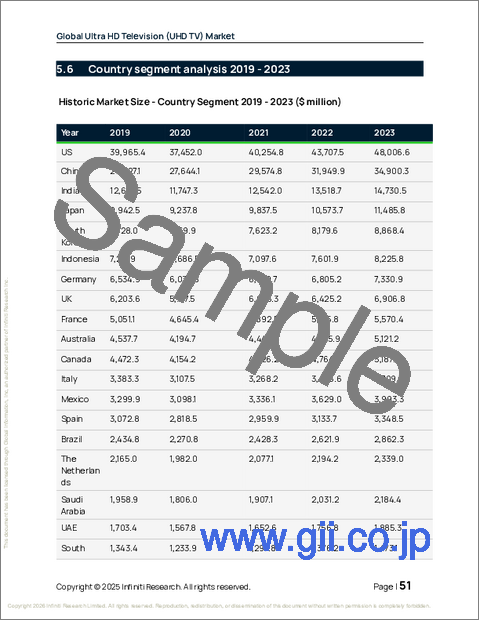
- 国別セグメント分析、2019年~2023年
第6章 定性分析
- AIの影響:世界のウルトラHDテレビ(UHD TV)市場
第7章 ファイブフォース分析
- ファイブフォースの要約
- 買い手の交渉力
- 供給企業の交渉力
- 新規参入業者の脅威
- 代替品の脅威
- 競争の脅威
- 市況
第8章 市場セグメンテーション:ディスプレイタイプ別
- 比較:ディスプレイタイプ別
- LED
- QLED
- OLED
- 市場機会:ディスプレイタイプ別
第9章 市場セグメンテーション:画面サイズ別
- 比較:画面サイズ別
- 50~59インチ
- 60-69インチ
- 40-49インチ
- 70インチ以上
- 市場機会:画面サイズ別
第10章 市場セグメンテーション:タイプ別
- 比較:タイプ別
- 4K
- 8K
- 市場機会:タイプ別
第11章 顧客情勢
第12章 地域別情勢
- 地域別セグメンテーション
- 地域別比較
- アジア太平洋
- 中国
- インド
- 日本
- 韓国
- インドネシア
- オーストラリア
- 北米
- 米国
- カナダ
- メキシコ
- 欧州
- ドイツ
- 英国
- フランス
- イタリア
- スペイン
- オランダ
- 中東・アフリカ
- サウジアラビア
- アラブ首長国連邦
- 南アフリカ
- エジプト
- ナイジェリア
- 南米
- ブラジル
- アルゼンチン
- チリ
- 市場機会:地域別
第13章 促進要因・課題・機会
- 市場促進要因
- 市場の課題
- 促進要因と課題の影響
- 市場機会
第14章 競合情勢
- 概要
- 競合情勢
- 混乱の状況
- 業界のリスク
第15章 競合分析
- 企業プロファイル
- 企業ランキング指標
- 企業の市場ポジショニング
- Apple Inc.
- Haier Smart Home Co. Ltd.
- Koninklijke Philips NV
- LG Corp.
- Micromax Informatics Ltd.
- MIRC Electronics Ltd.
- Panasonic Holdings Corp.
- Samsung Electronics Co. Ltd.
- Sharp Corp.
- Sony Group Corp.
- TCL Industries Holdings Ltd.
- Toshiba Corp.
- VIZIO Holding Corp.
- Vu Televisions
- Xiaomi Inc.

