|
|
市場調査レポート
商品コード
1581074
鋸刃の世界市場 (2024~2028年)Global Saw Blades Market 2024-2028 |
||||||

|
|||||||
カスタマイズ可能
|
|||||||


| 鋸刃の世界市場 (2024~2028年) |
|
出版日: 2024年08月02日
発行: TechNavio
ページ情報: 英文 156 Pages
納期: 即納可能
|

全表示
- 概要
- 図表
- 目次
鋸刃市場は2023年から2028年に6億6,220万米ドル分拡大し、予測期間中に4.5%のCAGRで成長すると予測されます。
当レポートでは、鋸刃市場の全体的な分析、市場規模・予測、動向、成長促進要因、課題、約25社のベンダーを網羅したベンダー分析などを掲載しています。
当レポートでは、現在の市場シナリオ、最新動向と促進要因、市場環境全体に関する最新分析を提供しています。市場は、自動車需要の増加、新興国市場における建設活動の増加、新しく革新的な製品の発売によって牽引されています。
| 市場範囲 | |
|---|---|
| 基準年 | 2024年 |
| 終了年 | 2028年 |
| 予測期間 | 2024~2028年 |
| 成長モメンタム | 加速 |
| 前年比 (2024年) | 4.23% |
| CAGR | 4.5% |
| 増分額 | 6億6,220万米ドル |
当レポートでは、鋸刃の技術進歩が、今後数年間の鋸刃市場成長を促進する主要な理由の1つであると特定しています。また、DIYプロジェクトや住宅リフォームの人気の高まり、積層造形プロセスによる鋸刃の製造は、市場の大きな需要につながります。
目次
第1章 エグゼクティブサマリー
- 市場概要
第2章 市場情勢
- 市場エコシステム
- 市場の特徴
- バリューチェーン分析
第3章 市場規模の評価
- 市場の定義
- 市場セグメント分析
- 市場規模 (2023年)
- 市場の見通し (2023~2028年)
第4章 市場規模実績
- 鋸刃の世界市場 (2018~2022年)
- 製品別の分析 (2018~2022年)
- 地域別分析 (2018~2022年)
- 国別分析 (2018~2022年)
第5章 ファイブフォース分析
- ファイブフォースの要約
- 買い手の交渉力
- 供給企業の交渉力
- 新規参入業者の脅威
- 代替品の脅威
- 競争の脅威
- 市況
第6章 市場セグメンテーション:製品別
- 市場セグメンテーション
- 比較:製品別
- 石切り鋸刃:市場規模と予測 (2023~2028年)
- 円形鋸刃:市場規模と予測 (2023~2028年)
- バンド鋸刃:市場規模と予測 (2023~2028年)
- チェーン鋸刃:市場規模と予測 (2023~2028年)
- その他:市場規模と予測 (2023~2028年)
- 製品別の市場機会
第7章 顧客情勢
- 顧客情勢の概要
第8章 地域別情勢
- 地域別セグメンテーション
- 地域別比較
- 欧州:市場規模と予測 (2023~2028年)
- アジア太平洋:市場規模と予測 (2023~2028年)
- 北米:市場規模と予測 (2023~2028年)
- 中東・アフリカ:市場規模と予測 (2023~2028年)
- 南米:市場規模と予測 (2023~2028年)
- 米国:市場規模と予測 (2023~2028年)
- ドイツ:市場規模と予測 (2023~2028年)
- 中国:市場規模と予測 (2023~2028年)
- 英国:市場規模と予測 (2023~2028年)
- 日本:市場規模と予測 (2023~2028年)
- 地域別の市場機会
第9章 促進要因・課題・機会・抑制要因
- 市場促進要因
- 市場の課題
- 促進要因と課題の影響
- 市場の機会・抑制要因
第10章 競合情勢
- 概要
- 競合情勢
- 混乱の状況
- 業界のリスク
第11章 競合分析
- 企業プロファイル
- 企業の市場ポジショニング
- AKE Knebel GmbH and Co. KG
- AMADA Co. Ltd.
- Freud America Inc.
- Illinois Tool Works Inc.
- Ingersoll Rand Inc.
- LEUCO AG
- Makita USA Inc.
- Pilana Metal Sro
- Snap On Inc.
- Stanley Black and Decker Inc.
第12章 付録
Exhibits:
- Exhibits1: Executive Summary - Chart on Market Overview
- Exhibits2: Executive Summary - Data Table on Market Overview
- Exhibits3: Executive Summary - Chart on Global Market Characteristics
- Exhibits4: Executive Summary - Chart on Market By Geographical Landscape
- Exhibits5: Executive Summary - Chart on Market Segmentation by Product
- Exhibits6: Executive Summary - Chart on Incremental Growth
- Exhibits7: Executive Summary - Data Table on Incremental Growth
- Exhibits8: Executive Summary - Chart on Company Market Positioning
- Exhibits9: Parent Market
- Exhibits10: Data Table on - Parent Market
- Exhibits11: Market characteristics analysis
- Exhibits12: Value Chain Analysis
- Exhibits13: Offerings of companies included in the market definition
- Exhibits14: Market segments
- Exhibits15: Chart on Global - Market size and forecast 2023-2028 ($ million)
- Exhibits16: Data Table on Global - Market size and forecast 2023-2028 ($ million)
- Exhibits17: Chart on Global Market: Year-over-year growth 2023-2028 (%)
- Exhibits18: Data Table on Global Market: Year-over-year growth 2023-2028 (%)
- Exhibits19: Historic Market Size - Data Table on Global Saw Blades Market 2018 - 2022 ($ million)
- Exhibits20: Historic Market Size - Product Segment 2018 - 2022 ($ million)
- Exhibits21: Historic Market Size - Geography Segment 2018 - 2022 ($ million)
- Exhibits22: Historic Market Size - Country Segment 2018 - 2022 ($ million)
- Exhibits23: Five forces analysis - Comparison between 2023 and 2028
- Exhibits24: Bargaining power of buyers - Impact of key factors 2023 and 2028
- Exhibits25: Bargaining power of suppliers - Impact of key factors in 2023 and 2028
- Exhibits26: Threat of new entrants - Impact of key factors in 2023 and 2028
- Exhibits27: Threat of substitutes - Impact of key factors in 2023 and 2028
- Exhibits28: Threat of rivalry - Impact of key factors in 2023 and 2028
- Exhibits29: Chart on Market condition - Five forces 2023 and 2028
- Exhibits30: Chart on Product - Market share 2023-2028 (%)
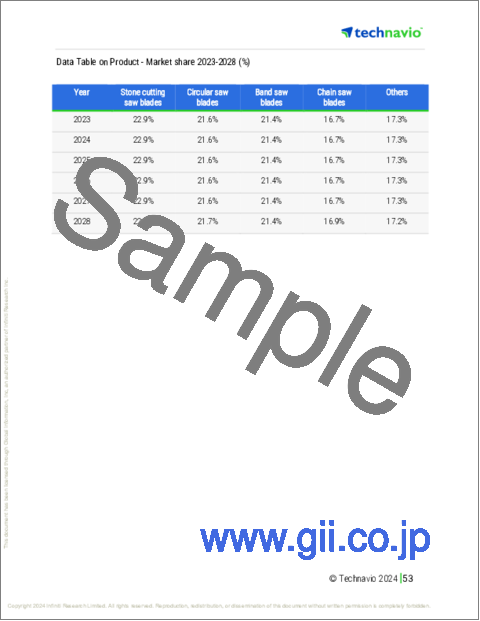
- Exhibits31: Data Table on Product - Market share 2023-2028 (%)
- Exhibits32: Chart on Comparison by Product
- Exhibits33: Data Table on Comparison by Product
- Exhibits34: Chart on Stone cutting saw blades - Market size and forecast 2023-2028 ($ million)
- Exhibits35: Data Table on Stone cutting saw blades - Market size and forecast 2023-2028 ($ million)
- Exhibits36: Chart on Stone cutting saw blades - Year-over-year growth 2023-2028 (%)
- Exhibits37: Data Table on Stone cutting saw blades - Year-over-year growth 2023-2028 (%)
- Exhibits38: Chart on Circular saw blades - Market size and forecast 2023-2028 ($ million)
- Exhibits39: Data Table on Circular saw blades - Market size and forecast 2023-2028 ($ million)
- Exhibits40: Chart on Circular saw blades - Year-over-year growth 2023-2028 (%)
- Exhibits41: Data Table on Circular saw blades - Year-over-year growth 2023-2028 (%)
- Exhibits42: Chart on Band saw blades - Market size and forecast 2023-2028 ($ million)
- Exhibits43: Data Table on Band saw blades - Market size and forecast 2023-2028 ($ million)
- Exhibits44: Chart on Band saw blades - Year-over-year growth 2023-2028 (%)
- Exhibits45: Data Table on Band saw blades - Year-over-year growth 2023-2028 (%)
- Exhibits46: Chart on Chain saw blades - Market size and forecast 2023-2028 ($ million)
- Exhibits47: Data Table on Chain saw blades - Market size and forecast 2023-2028 ($ million)
- Exhibits48: Chart on Chain saw blades - Year-over-year growth 2023-2028 (%)
- Exhibits49: Data Table on Chain saw blades - Year-over-year growth 2023-2028 (%)
- Exhibits50: Chart on Others - Market size and forecast 2023-2028 ($ million)
- Exhibits51: Data Table on Others - Market size and forecast 2023-2028 ($ million)
- Exhibits52: Chart on Others - Year-over-year growth 2023-2028 (%)
- Exhibits53: Data Table on Others - Year-over-year growth 2023-2028 (%)
- Exhibits54: Market opportunity by Product ($ million)
- Exhibits55: Data Table on Market opportunity by Product ($ million)
- Exhibits56: Analysis of price sensitivity, lifecycle, customer purchase basket, adoption rates, and purchase criteria
- Exhibits57: Chart on Market share By Geographical Landscape 2023-2028 (%)
- Exhibits58: Data Table on Market share By Geographical Landscape 2023-2028 (%)
- Exhibits59: Chart on Geographic comparison
- Exhibits60: Data Table on Geographic comparison
- Exhibits61: Chart on Europe - Market size and forecast 2023-2028 ($ million)
- Exhibits62: Data Table on Europe - Market size and forecast 2023-2028 ($ million)
- Exhibits63: Chart on Europe - Year-over-year growth 2023-2028 (%)
- Exhibits64: Data Table on Europe - Year-over-year growth 2023-2028 (%)
- Exhibits65: Chart on APAC - Market size and forecast 2023-2028 ($ million)
- Exhibits66: Data Table on APAC - Market size and forecast 2023-2028 ($ million)
- Exhibits67: Chart on APAC - Year-over-year growth 2023-2028 (%)
- Exhibits68: Data Table on APAC - Year-over-year growth 2023-2028 (%)
- Exhibits69: Chart on North America - Market size and forecast 2023-2028 ($ million)
- Exhibits70: Data Table on North America - Market size and forecast 2023-2028 ($ million)
- Exhibits71: Chart on North America - Year-over-year growth 2023-2028 (%)
- Exhibits72: Data Table on North America - Year-over-year growth 2023-2028 (%)
- Exhibits73: Chart on Middle East and Africa - Market size and forecast 2023-2028 ($ million)
- Exhibits74: Data Table on Middle East and Africa - Market size and forecast 2023-2028 ($ million)
- Exhibits75: Chart on Middle East and Africa - Year-over-year growth 2023-2028 (%)
- Exhibits76: Data Table on Middle East and Africa - Year-over-year growth 2023-2028 (%)
- Exhibits77: Chart on South America - Market size and forecast 2023-2028 ($ million)
- Exhibits78: Data Table on South America - Market size and forecast 2023-2028 ($ million)
- Exhibits79: Chart on South America - Year-over-year growth 2023-2028 (%)
- Exhibits80: Data Table on South America - Year-over-year growth 2023-2028 (%)
- Exhibits81: Chart on US - Market size and forecast 2023-2028 ($ million)
- Exhibits82: Data Table on US - Market size and forecast 2023-2028 ($ million)
- Exhibits83: Chart on US - Year-over-year growth 2023-2028 (%)
- Exhibits84: Data Table on US - Year-over-year growth 2023-2028 (%)
- Exhibits85: Chart on Germany - Market size and forecast 2023-2028 ($ million)
- Exhibits86: Data Table on Germany - Market size and forecast 2023-2028 ($ million)
- Exhibits87: Chart on Germany - Year-over-year growth 2023-2028 (%)
- Exhibits88: Data Table on Germany - Year-over-year growth 2023-2028 (%)
- Exhibits89: Chart on China - Market size and forecast 2023-2028 ($ million)
- Exhibits90: Data Table on China - Market size and forecast 2023-2028 ($ million)
- Exhibits91: Chart on China - Year-over-year growth 2023-2028 (%)
- Exhibits92: Data Table on China - Year-over-year growth 2023-2028 (%)
- Exhibits93: Chart on UK - Market size and forecast 2023-2028 ($ million)
- Exhibits94: Data Table on UK - Market size and forecast 2023-2028 ($ million)
- Exhibits95: Chart on UK - Year-over-year growth 2023-2028 (%)
- Exhibits96: Data Table on UK - Year-over-year growth 2023-2028 (%)
- Exhibits97: Chart on Japan - Market size and forecast 2023-2028 ($ million)
- Exhibits98: Data Table on Japan - Market size and forecast 2023-2028 ($ million)
- Exhibits99: Chart on Japan - Year-over-year growth 2023-2028 (%)
- Exhibits100: Data Table on Japan - Year-over-year growth 2023-2028 (%)
- Exhibits101: Market opportunity By Geographical Landscape ($ million)
- Exhibits102: Data Tables on Market opportunity By Geographical Landscape ($ million)
- Exhibits103: Impact of drivers and challenges in 2023 and 2028
- Exhibits104: Overview on criticality of inputs and factors of differentiation
- Exhibits105: Overview on factors of disruption
- Exhibits106: Impact of key risks on business
- Exhibits107: Companies covered
- Exhibits108: Matrix on companies position and classification
- Exhibits109: AKE Knebel GmbH and Co. KG - Overview
- Exhibits110: AKE Knebel GmbH and Co. KG - Product / Service
- Exhibits111: AKE Knebel GmbH and Co. KG - Key offerings
- Exhibits112: AMADA Co. Ltd. - Overview
- Exhibits113: AMADA Co. Ltd. - Business segments
- Exhibits114: AMADA Co. Ltd. - Key offerings
- Exhibits115: AMADA Co. Ltd. - Segment focus
- Exhibits116: Freud America Inc. - Overview
- Exhibits117: Freud America Inc. - Product / Service
- Exhibits118: Freud America Inc. - Key offerings
- Exhibits119: Illinois Tool Works Inc. - Overview
- Exhibits120: Illinois Tool Works Inc. - Business segments
- Exhibits121: Illinois Tool Works Inc. - Key news
- Exhibits122: Illinois Tool Works Inc. - Key offerings
- Exhibits123: Illinois Tool Works Inc. - Segment focus
- Exhibits124: Ingersoll Rand Inc. - Overview
- Exhibits125: Ingersoll Rand Inc. - Business segments
- Exhibits126: Ingersoll Rand Inc. - Key news
- Exhibits127: Ingersoll Rand Inc. - Key offerings
- Exhibits128: Ingersoll Rand Inc. - Segment focus
- Exhibits129: LEUCO AG - Overview
- Exhibits130: LEUCO AG - Product / Service
- Exhibits131: LEUCO AG - Key offerings
- Exhibits132: Makita USA Inc. - Overview
- Exhibits133: Makita USA Inc. - Product / Service
- Exhibits134: Makita USA Inc. - Key offerings
- Exhibits135: Pilana Metal Sro - Overview
- Exhibits136: Pilana Metal Sro - Product / Service
- Exhibits137: Pilana Metal Sro - Key offerings
- Exhibits138: Snap On Inc. - Overview
- Exhibits139: Snap On Inc. - Business segments
- Exhibits140: Snap On Inc. - Key offerings
- Exhibits141: Snap On Inc. - Segment focus
- Exhibits142: Stanley Black and Decker Inc. - Overview
- Exhibits143: Stanley Black and Decker Inc. - Business segments
- Exhibits144: Stanley Black and Decker Inc. - Key news
- Exhibits145: Stanley Black and Decker Inc. - Key offerings
- Exhibits146: Stanley Black and Decker Inc. - Segment focus
- Exhibits147: Inclusions checklist
- Exhibits148: Exclusions checklist
- Exhibits149: Currency conversion rates for US$
- Exhibits150: Research methodology
- Exhibits151: Information sources
- Exhibits152: Data validation
- Exhibits153: Validation techniques employed for market sizing
- Exhibits154: Data synthesis
- Exhibits155: 360 degree market analysis
- Exhibits156: List of abbreviations
The saw blades market is forecasted to grow by USD 662.2 mn during 2023-2028, accelerating at a CAGR of 4.5% during the forecast period. The report on the saw blades market provides a holistic analysis, market size and forecast, trends, growth drivers, and challenges, as well as vendor analysis covering around 25 vendors.
The report offers an up-to-date analysis regarding the current market scenario, the latest trends and drivers, and the overall market environment. The market is driven by increased demand for automobiles, rise in construction activities in developing countries, and new and innovative product launches.
Technavio's saw blades market is segmented as below:
| Market Scope | |
|---|---|
| Base Year | 2024 |
| End Year | 2028 |
| Series Year | 2024-2028 |
| Growth Momentum | Accelerate |
| YOY 2024 | 4.23% |
| CAGR | 4.5% |
| Incremental Value | $662.2 mn |
By Product
- Stone cutting saw blades
- Circular saw blades
- Band saw blades
- Chain saw blades
- Others
By Geographical Landscape
- Europe
- APAC
- North America
- Middle East and Africa
- South America
This study identifies the technological advancement in saw blades as one of the prime reasons driving the saw blades market growth during the next few years. Also, growing popularity of diy projects and home renovation and manufacturing of saw blades using additive manufacturing process will lead to sizable demand in the market.
The report on the saw blades market covers the following areas:
- Saw blades market sizing
- Saw blades market forecast
- Saw blades market industry analysis
The robust vendor analysis is designed to help clients improve their market position, and in line with this, this report provides a detailed analysis of several leading saw blades market vendors that include AKE Knebel GmbH and Co. KG, AMADA Co. Ltd., DOALL SAWS, DIMAR GROUP, Freud America Inc., Illinois Tool Works Inc., Ingersoll Rand Inc., J.N. Eberle and Cie. GmbH, Kinkelder BV, Leitz GmbH and Co. KG, LEUCO AG, Makita USA Inc., Pilana Metal Sro, ROTHENBERGER Werkzeuge GmbH, Simonds International LLC, Snap On Inc., Stanley Black and Decker Inc., Stark Spa, The M. K. Morse Co., and Tyrolit Schleifmittelwerke Swarovski KG. Also, the saw blades market analysis report includes information on upcoming trends and challenges that will influence market growth. This is to help companies strategize and leverage all forthcoming growth opportunities.
The study was conducted using an objective combination of primary and secondary information including inputs from key participants in the industry. The report contains a comprehensive market and vendor landscape in addition to an analysis of the key vendors.
The publisher presents a detailed picture of the market by the way of study, synthesis, and summation of data from multiple sources by an analysis of key parameters such as profit, pricing, competition, and promotions. It presents various market facets by identifying the key industry influencers. The data presented is comprehensive, reliable, and a result of extensive research - both primary and secondary. The market research reports provide a complete competitive landscape and an in-depth vendor selection methodology and analysis using qualitative and quantitative research to forecast the accurate market growth.
Table of Contents
1 Executive Summary
- 1.1 Market overview
- Executive Summary - Chart on Market Overview
- Executive Summary - Data Table on Market Overview
- Executive Summary - Chart on Global Market Characteristics
- Executive Summary - Chart on Market By Geographical Landscape
- Executive Summary - Chart on Market Segmentation by Product
- Executive Summary - Chart on Incremental Growth
- Executive Summary - Data Table on Incremental Growth
- Executive Summary - Chart on Company Market Positioning
2 Market Landscape
- 2.1 Market ecosystem
- Parent Market
- Data Table on - Parent Market
- 2.2 Market characteristics
- Market characteristics analysis
- 2.3 Value chain analysis
- Value Chain Analysis
3 Market Sizing
- 3.1 Market definition
- Offerings of companies included in the market definition
- 3.2 Market segment analysis
- Market segments
- 3.3 Market size 2023
- 3.4 Market outlook: Forecast for 2023-2028
- Chart on Global - Market size and forecast 2023-2028 ($ million)
- Data Table on Global - Market size and forecast 2023-2028 ($ million)
- Chart on Global Market: Year-over-year growth 2023-2028 (%)
- Data Table on Global Market: Year-over-year growth 2023-2028 (%)
4 Historic Market Size
- 4.1 Global Saw Blades Market 2018 - 2022
- Historic Market Size - Data Table on Global Saw Blades Market 2018 - 2022 ($ million)
- 4.2 Product segment analysis 2018 - 2022
- Historic Market Size - Product Segment 2018 - 2022 ($ million)
- 4.3 Geography segment analysis 2018 - 2022
- Historic Market Size - Geography Segment 2018 - 2022 ($ million)
- 4.4 Country segment analysis 2018 - 2022
- Historic Market Size - Country Segment 2018 - 2022 ($ million)
5 Five Forces Analysis
- 5.1 Five forces summary
- Five forces analysis - Comparison between 2023 and 2028
- 5.2 Bargaining power of buyers
- Bargaining power of buyers - Impact of key factors 2023 and 2028
- 5.3 Bargaining power of suppliers
- Bargaining power of suppliers - Impact of key factors in 2023 and 2028
- 5.4 Threat of new entrants
- Threat of new entrants - Impact of key factors in 2023 and 2028
- 5.5 Threat of substitutes
- Threat of substitutes - Impact of key factors in 2023 and 2028
- 5.6 Threat of rivalry
- Threat of rivalry - Impact of key factors in 2023 and 2028
- 5.7 Market condition
- Chart on Market condition - Five forces 2023 and 2028
6 Market Segmentation by Product
- 6.1 Market segments
- Chart on Product - Market share 2023-2028 (%)
- Data Table on Product - Market share 2023-2028 (%)
- 6.2 Comparison by Product
- Chart on Comparison by Product
- Data Table on Comparison by Product
- 6.3 Stone cutting saw blades - Market size and forecast 2023-2028
- Chart on Stone cutting saw blades - Market size and forecast 2023-2028 ($ million)
- Data Table on Stone cutting saw blades - Market size and forecast 2023-2028 ($ million)
- Chart on Stone cutting saw blades - Year-over-year growth 2023-2028 (%)
- Data Table on Stone cutting saw blades - Year-over-year growth 2023-2028 (%)
- 6.4 Circular saw blades - Market size and forecast 2023-2028
- Chart on Circular saw blades - Market size and forecast 2023-2028 ($ million)
- Data Table on Circular saw blades - Market size and forecast 2023-2028 ($ million)
- Chart on Circular saw blades - Year-over-year growth 2023-2028 (%)
- Data Table on Circular saw blades - Year-over-year growth 2023-2028 (%)
- 6.5 Band saw blades - Market size and forecast 2023-2028
- Chart on Band saw blades - Market size and forecast 2023-2028 ($ million)
- Data Table on Band saw blades - Market size and forecast 2023-2028 ($ million)
- Chart on Band saw blades - Year-over-year growth 2023-2028 (%)
- Data Table on Band saw blades - Year-over-year growth 2023-2028 (%)
- 6.6 Chain saw blades - Market size and forecast 2023-2028
- Chart on Chain saw blades - Market size and forecast 2023-2028 ($ million)
- Data Table on Chain saw blades - Market size and forecast 2023-2028 ($ million)
- Chart on Chain saw blades - Year-over-year growth 2023-2028 (%)
- Data Table on Chain saw blades - Year-over-year growth 2023-2028 (%)
- 6.7 Others - Market size and forecast 2023-2028
- Chart on Others - Market size and forecast 2023-2028 ($ million)
- Data Table on Others - Market size and forecast 2023-2028 ($ million)
- Chart on Others - Year-over-year growth 2023-2028 (%)
- Data Table on Others - Year-over-year growth 2023-2028 (%)
- 6.8 Market opportunity by Product
- Market opportunity by Product ($ million)
- Data Table on Market opportunity by Product ($ million)
7 Customer Landscape
- 7.1 Customer landscape overview
- Analysis of price sensitivity, lifecycle, customer purchase basket, adoption rates, and purchase criteria
8 Geographic Landscape
- 8.1 Geographic segmentation
- Chart on Market share By Geographical Landscape 2023-2028 (%)
- Data Table on Market share By Geographical Landscape 2023-2028 (%)
- 8.2 Geographic comparison
- Chart on Geographic comparison
- Data Table on Geographic comparison
- 8.3 Europe - Market size and forecast 2023-2028
- Chart on Europe - Market size and forecast 2023-2028 ($ million)
- Data Table on Europe - Market size and forecast 2023-2028 ($ million)
- Chart on Europe - Year-over-year growth 2023-2028 (%)
- Data Table on Europe - Year-over-year growth 2023-2028 (%)
- 8.4 APAC - Market size and forecast 2023-2028
- Chart on APAC - Market size and forecast 2023-2028 ($ million)
- Data Table on APAC - Market size and forecast 2023-2028 ($ million)
- Chart on APAC - Year-over-year growth 2023-2028 (%)
- Data Table on APAC - Year-over-year growth 2023-2028 (%)
- 8.5 North America - Market size and forecast 2023-2028
- Chart on North America - Market size and forecast 2023-2028 ($ million)
- Data Table on North America - Market size and forecast 2023-2028 ($ million)
- Chart on North America - Year-over-year growth 2023-2028 (%)
- Data Table on North America - Year-over-year growth 2023-2028 (%)
- 8.6 Middle East and Africa - Market size and forecast 2023-2028
- Chart on Middle East and Africa - Market size and forecast 2023-2028 ($ million)
- Data Table on Middle East and Africa - Market size and forecast 2023-2028 ($ million)
- Chart on Middle East and Africa - Year-over-year growth 2023-2028 (%)
- Data Table on Middle East and Africa - Year-over-year growth 2023-2028 (%)
- 8.7 South America - Market size and forecast 2023-2028
- Chart on South America - Market size and forecast 2023-2028 ($ million)
- Data Table on South America - Market size and forecast 2023-2028 ($ million)
- Chart on South America - Year-over-year growth 2023-2028 (%)
- Data Table on South America - Year-over-year growth 2023-2028 (%)
- 8.8 US - Market size and forecast 2023-2028
- Chart on US - Market size and forecast 2023-2028 ($ million)
- Data Table on US - Market size and forecast 2023-2028 ($ million)
- Chart on US - Year-over-year growth 2023-2028 (%)
- Data Table on US - Year-over-year growth 2023-2028 (%)
- 8.9 Germany - Market size and forecast 2023-2028
- Chart on Germany - Market size and forecast 2023-2028 ($ million)
- Data Table on Germany - Market size and forecast 2023-2028 ($ million)
- Chart on Germany - Year-over-year growth 2023-2028 (%)
- Data Table on Germany - Year-over-year growth 2023-2028 (%)
- 8.10 China - Market size and forecast 2023-2028
- Chart on China - Market size and forecast 2023-2028 ($ million)
- Data Table on China - Market size and forecast 2023-2028 ($ million)
- Chart on China - Year-over-year growth 2023-2028 (%)
- Data Table on China - Year-over-year growth 2023-2028 (%)
- 8.11 UK - Market size and forecast 2023-2028
- Chart on UK - Market size and forecast 2023-2028 ($ million)
- Data Table on UK - Market size and forecast 2023-2028 ($ million)
- Chart on UK - Year-over-year growth 2023-2028 (%)
- Data Table on UK - Year-over-year growth 2023-2028 (%)
- 8.12 Japan - Market size and forecast 2023-2028
- Chart on Japan - Market size and forecast 2023-2028 ($ million)
- Data Table on Japan - Market size and forecast 2023-2028 ($ million)
- Chart on Japan - Year-over-year growth 2023-2028 (%)
- Data Table on Japan - Year-over-year growth 2023-2028 (%)
- 8.13 Market opportunity By Geographical Landscape
- Market opportunity By Geographical Landscape ($ million)
- Data Tables on Market opportunity By Geographical Landscape ($ million)
9 Drivers, Challenges, and Opportunity/Restraints
- 9.1 Market drivers
- 9.2 Market challenges
- 9.3 Impact of drivers and challenges
- Impact of drivers and challenges in 2023 and 2028
- 9.4 Market opportunities/restraints
10 Competitive Landscape
- 10.1 Overview
- 10.2 Competitive Landscape
- Overview on criticality of inputs and factors of differentiation
- 10.3 Landscape disruption
- Overview on factors of disruption
- 10.4 Industry risks
- Impact of key risks on business
11 Competitive Analysis
- 11.1 Companies profiled
- Companies covered
- 11.2 Market positioning of companies
- Matrix on companies position and classification
- 11.3 AKE Knebel GmbH and Co. KG
- AKE Knebel GmbH and Co. KG - Overview
- AKE Knebel GmbH and Co. KG - Product / Service
- AKE Knebel GmbH and Co. KG - Key offerings
- 11.4 AMADA Co. Ltd.
- AMADA Co. Ltd. - Overview
- AMADA Co. Ltd. - Business segments
- AMADA Co. Ltd. - Key offerings
- AMADA Co. Ltd. - Segment focus
- 11.5 Freud America Inc.
- Freud America Inc. - Overview
- Freud America Inc. - Product / Service
- Freud America Inc. - Key offerings
- 11.6 Illinois Tool Works Inc.
- Illinois Tool Works Inc. - Overview
- Illinois Tool Works Inc. - Business segments
- Illinois Tool Works Inc. - Key news
- Illinois Tool Works Inc. - Key offerings
- Illinois Tool Works Inc. - Segment focus
- 11.7 Ingersoll Rand Inc.
- Ingersoll Rand Inc. - Overview
- Ingersoll Rand Inc. - Business segments
- Ingersoll Rand Inc. - Key news
- Ingersoll Rand Inc. - Key offerings
- Ingersoll Rand Inc. - Segment focus
- 11.8 LEUCO AG
- LEUCO AG - Overview
- LEUCO AG - Product / Service
- LEUCO AG - Key offerings
- 11.9 Makita USA Inc.
- Makita USA Inc. - Overview
- Makita USA Inc. - Product / Service
- Makita USA Inc. - Key offerings
- 11.10 Pilana Metal Sro
- Pilana Metal Sro - Overview
- Pilana Metal Sro - Product / Service
- Pilana Metal Sro - Key offerings
- 11.11 Snap On Inc.
- Snap On Inc. - Overview
- Snap On Inc. - Business segments
- Snap On Inc. - Key offerings
- Snap On Inc. - Segment focus
- 11.12 Stanley Black and Decker Inc.
- Stanley Black and Decker Inc. - Overview
- Stanley Black and Decker Inc. - Business segments
- Stanley Black and Decker Inc. - Key news
- Stanley Black and Decker Inc. - Key offerings
- Stanley Black and Decker Inc. - Segment focus
12 Appendix
- 12.1 Scope of the report
- 12.2 Inclusions and exclusions checklist
- Inclusions checklist
- Exclusions checklist
- 12.3 Currency conversion rates for US$
- Currency conversion rates for US$
- 12.4 Research methodology
- Research methodology
- 12.5 Data procurement
- Information sources
- 12.6 Data validation
- Data validation
- 12.7 Validation techniques employed for market sizing
- Validation techniques employed for market sizing
- 12.8 Data synthesis
- Data synthesis
- 360 degree market analysis
- 360 degree market analysis
- 12.10 List of abbreviations
- List of abbreviations

