|
|
市場調査レポート
商品コード
1581030
金属不活性化剤の世界市場 (2024~2028年)Global Metal Deactivator Market 2024-2028 |
||||||

|
|||||||
カスタマイズ可能
|
|||||||


| 金属不活性化剤の世界市場 (2024~2028年) |
|
出版日: 2024年08月29日
発行: TechNavio
ページ情報: 英文 212 Pages
納期: 即納可能
|

全表示
- 概要
- 図表
- 目次
金属不活性化剤市場は2023年から2028年に3億9,910万米ドル分拡大し、予測期間中に4.54%のCAGRで成長すると予測されます。
当レポートでは、金属不活性化剤市場の全体的な分析、市場規模・予測、動向、成長促進要因、課題、約25社のベンダーを網羅したベンダー分析などを掲載しています。
当レポートでは、現在の市場シナリオ、最新動向と促進要因、市場環境全体に関する最新分析を提供しています。市場を牽引しているのは、信頼性の高い機械とその効果的な整備に対するニーズの高まり、機械の技術更新による高性能金属不活性化剤へのニーズの高まり、eコマース業界を活用した顧客リーチの拡大などです。
| 市場範囲 | |
|---|---|
| 基準年 | 2024年 |
| 終了年 | 2028年 |
| 予測期間 | 2024~2028年 |
| 成長モメンタム | 加速 |
| 前年比 (2024年) | 4.26% |
| CAGR | 4.54% |
| 増分額 | 3億9,910万米ドル |
当レポートでは、持続可能な金属不活性化剤に対する需要の高まりが、今後数年間の金属不活性化剤市場成長を牽引する主要因の一つであると分析しています。また、燃料における多機能添加剤への需要の高まりや、成長経済圏における急速な工業化は、市場の大きな需要につながります。
目次
第1章 エグゼクティブサマリー
- 市場概要
第2章 Technavioの分析
- 価格反応性・ライフサイクル・顧客購入バスケット・採用率・購入基準の分析
- インプットの重要性と差別化の要因
- 混乱の要因
- 促進要因と課題の影響
第3章 市場情勢
- 市場エコシステム
- 市場の特徴
- バリューチェーン分析
第4章 市場規模の評価
- 市場の定義
- 市場セグメント分析
- 市場規模 (2023年)
- 市場の見通し (2023~2028年)
第5章 市場規模実績
- 金属不活性化剤の世界市場 (2018~2022年)
- 剤形別分析 (2018~2022年)
- エンドユーザー別分析 (2018~2022年)
- 地域別分析 (2018~2022年)
- 国別分析 (2018~2022年)
第6章 定性分析
- 世界の金属不活性化剤市場に対するAIの影響
第7章 ファイブフォース分析
- ファイブフォースの要約
- 買い手の交渉力
- 供給企業の交渉力
- 新規参入業者の脅威
- 代替品の脅威
- 競争の脅威
- 市況
第8章 市場セグメンテーション:剤形別
- 市場セグメンテーション
- 比較:剤形別
- 油溶性:市場規模と予測 (2023~2028年)
- 水溶性:市場規模と予測 (2023~2028年)
- 剤形別の市場機会
第9章 市場セグメンテーション:エンドユーザー別
- 市場セグメンテーション
- 比較:エンドユーザー別
- 自動車:市場規模と予測 (2023~2028年)
- 産業:市場規模と予測 (2023~2028年)
- 航空:市場規模と予測 (2023~2028年)
- 海洋:市場規模と予測 (2023~2028年)
- その他:市場規模と予測 (2023~2028年)
- エンドユーザー別の市場機会
第10章 顧客情勢
- 顧客情勢の概要
第11章 地域別情勢
- 地域別セグメンテーション
- 地域別比較
- アジア太平洋:市場規模と予測 (2023~2028年)
- 北米:市場規模と予測 (2023~2028年)
- 欧州:市場規模と予測 (2023~2028年)
- 南米:市場規模と予測 (2023~2028年)
- 中東・アフリカ:市場規模と予測 (2023~2028年)
- 米国:市場規模と予測 (2023~2028年)
- 中国:市場規模と予測 (2023~2028年)
- インド:市場規模と予測 (2023~2028年)
- ドイツ:市場規模と予測 (2023~2028年)
- 日本:市場規模と予測 (2023~2028年)
- 英国:市場規模と予測 (2023~2028年)
- カナダ:市場規模と予測 (2023~2028年)
- フランス:市場規模と予測 (2023~2028年)
- 韓国:市場規模と予測 (2023~2028年)
- イタリア:市場規模と予測 (2023~2028年)
- 地域別の市場機会
第12章 促進要因・課題・機会・抑制要因
- 市場促進要因
- 市場の課題
- 促進要因と課題の影響
- 市場の機会・抑制要因
第13章 競合情勢
- 概要
- 競合情勢
- 混乱の状況
- 業界のリスク
第14章 競合分析
- 企業プロファイル
- 企業ランキング指数
- 企業の市場ポジショニング
- ADEKA Corp.
- Afton Chemical
- BASF SE
- Clariant AG
- Dorf Ketal Chemicals I Pvt. Ltd.
- Dow Inc.
- Eastman Chemical Co.
- Innospec Inc.
- Lanxess AG
- Mayzo Inc.
- Metall-Chemie Holding GmbH
- R.T. Vanderbilt Holding Co. Inc.
- SI Group Inc.
- Songwon Industrial Co. Ltd.
- The Lubrizol Corp.
第15章 付録
Exhibits:
- Exhibits1: Executive Summary - Chart on Market Overview
- Exhibits2: Executive Summary - Data Table on Market Overview
- Exhibits3: Executive Summary - Chart on Global Market Characteristics
- Exhibits4: Executive Summary - Chart on Market By Geographical Landscape
- Exhibits5: Executive Summary - Chart on Market Segmentation by Formulation
- Exhibits6: Executive Summary - Chart on Market Segmentation by End-user
- Exhibits7: Executive Summary - Chart on Incremental Growth
- Exhibits8: Executive Summary - Data Table on Incremental Growth
- Exhibits9: Executive Summary - Chart on Company Market Positioning
- Exhibits10: Analysis of price sensitivity, lifecycle, customer purchase basket, adoption rates, and purchase criteria
- Exhibits11: Overview on criticality of inputs and factors of differentiation
- Exhibits12: Overview on factors of disruption
- Exhibits13: Impact of drivers and challenges in 2023 and 2028
- Exhibits14: Parent Market
- Exhibits15: Data Table on - Parent Market
- Exhibits16: Market characteristics analysis
- Exhibits17: Value Chain Analysis
- Exhibits18: Offerings of companies included in the market definition
- Exhibits19: Market segments
- Exhibits20: Chart on Global - Market size and forecast 2023-2028 ($ million)
- Exhibits21: Data Table on Global - Market size and forecast 2023-2028 ($ million)
- Exhibits22: Chart on Global Market: Year-over-year growth 2023-2028 (%)
- Exhibits23: Data Table on Global Market: Year-over-year growth 2023-2028 (%)
- Exhibits24: Historic Market Size - Data Table on Global Metal Deactivator Market 2018 - 2022 ($ million)
- Exhibits25: Historic Market Size - Formulation Segment 2018 - 2022 ($ million)
- Exhibits26: Historic Market Size - End-user Segment 2018 - 2022 ($ million)
- Exhibits27: Historic Market Size - Geography Segment 2018 - 2022 ($ million)
- Exhibits28: Historic Market Size - Country Segment 2018 - 2022 ($ million)
- Exhibits29: Five forces analysis - Comparison between 2023 and 2028
- Exhibits30: Bargaining power of buyers - Impact of key factors 2023 and 2028
- Exhibits31: Bargaining power of suppliers - Impact of key factors in 2023 and 2028
- Exhibits32: Threat of new entrants - Impact of key factors in 2023 and 2028
- Exhibits33: Threat of substitutes - Impact of key factors in 2023 and 2028
- Exhibits34: Threat of rivalry - Impact of key factors in 2023 and 2028
- Exhibits35: Chart on Market condition - Five forces 2023 and 2028
- Exhibits36: Chart on Formulation - Market share 2023-2028 (%)
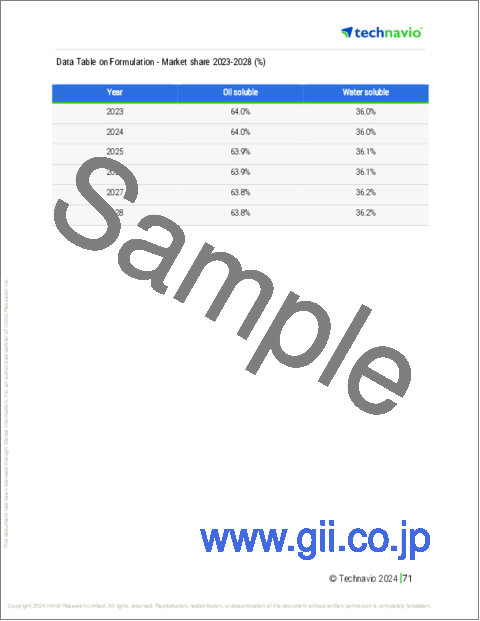
- Exhibits37: Data Table on Formulation - Market share 2023-2028 (%)
- Exhibits38: Chart on Comparison by Formulation
- Exhibits39: Data Table on Comparison by Formulation
- Exhibits40: Chart on Oil soluble - Market size and forecast 2023-2028 ($ million)
- Exhibits41: Data Table on Oil soluble - Market size and forecast 2023-2028 ($ million)
- Exhibits42: Chart on Oil soluble - Year-over-year growth 2023-2028 (%)
- Exhibits43: Data Table on Oil soluble - Year-over-year growth 2023-2028 (%)
- Exhibits44: Chart on Water soluble - Market size and forecast 2023-2028 ($ million)
- Exhibits45: Data Table on Water soluble - Market size and forecast 2023-2028 ($ million)
- Exhibits46: Chart on Water soluble - Year-over-year growth 2023-2028 (%)
- Exhibits47: Data Table on Water soluble - Year-over-year growth 2023-2028 (%)
- Exhibits48: Market opportunity by Formulation ($ million)
- Exhibits49: Data Table on Market opportunity by Formulation ($ million)
- Exhibits50: Chart on End-user - Market share 2023-2028 (%)
- Exhibits51: Data Table on End-user - Market share 2023-2028 (%)
- Exhibits52: Chart on Comparison by End-user
- Exhibits53: Data Table on Comparison by End-user
- Exhibits54: Chart on Automotive - Market size and forecast 2023-2028 ($ million)
- Exhibits55: Data Table on Automotive - Market size and forecast 2023-2028 ($ million)
- Exhibits56: Chart on Automotive - Year-over-year growth 2023-2028 (%)
- Exhibits57: Data Table on Automotive - Year-over-year growth 2023-2028 (%)
- Exhibits58: Chart on Industrial - Market size and forecast 2023-2028 ($ million)
- Exhibits59: Data Table on Industrial - Market size and forecast 2023-2028 ($ million)
- Exhibits60: Chart on Industrial - Year-over-year growth 2023-2028 (%)
- Exhibits61: Data Table on Industrial - Year-over-year growth 2023-2028 (%)
- Exhibits62: Chart on Aviation - Market size and forecast 2023-2028 ($ million)
- Exhibits63: Data Table on Aviation - Market size and forecast 2023-2028 ($ million)
- Exhibits64: Chart on Aviation - Year-over-year growth 2023-2028 (%)
- Exhibits65: Data Table on Aviation - Year-over-year growth 2023-2028 (%)
- Exhibits66: Chart on Marine - Market size and forecast 2023-2028 ($ million)
- Exhibits67: Data Table on Marine - Market size and forecast 2023-2028 ($ million)
- Exhibits68: Chart on Marine - Year-over-year growth 2023-2028 (%)
- Exhibits69: Data Table on Marine - Year-over-year growth 2023-2028 (%)
- Exhibits70: Chart on Others - Market size and forecast 2023-2028 ($ million)
- Exhibits71: Data Table on Others - Market size and forecast 2023-2028 ($ million)
- Exhibits72: Chart on Others - Year-over-year growth 2023-2028 (%)
- Exhibits73: Data Table on Others - Year-over-year growth 2023-2028 (%)
- Exhibits74: Market opportunity by End-user ($ million)
- Exhibits75: Data Table on Market opportunity by End-user ($ million)
- Exhibits76: Analysis of price sensitivity, lifecycle, customer purchase basket, adoption rates, and purchase criteria
- Exhibits77: Chart on Market share By Geographical Landscape 2023-2028 (%)
- Exhibits78: Data Table on Market share By Geographical Landscape 2023-2028 (%)
- Exhibits79: Chart on Geographic comparison
- Exhibits80: Data Table on Geographic comparison
- Exhibits81: Chart on APAC - Market size and forecast 2023-2028 ($ million)
- Exhibits82: Data Table on APAC - Market size and forecast 2023-2028 ($ million)
- Exhibits83: Chart on APAC - Year-over-year growth 2023-2028 (%)
- Exhibits84: Data Table on APAC - Year-over-year growth 2023-2028 (%)
- Exhibits85: Chart on North America - Market size and forecast 2023-2028 ($ million)
- Exhibits86: Data Table on North America - Market size and forecast 2023-2028 ($ million)
- Exhibits87: Chart on North America - Year-over-year growth 2023-2028 (%)
- Exhibits88: Data Table on North America - Year-over-year growth 2023-2028 (%)
- Exhibits89: Chart on Europe - Market size and forecast 2023-2028 ($ million)
- Exhibits90: Data Table on Europe - Market size and forecast 2023-2028 ($ million)
- Exhibits91: Chart on Europe - Year-over-year growth 2023-2028 (%)
- Exhibits92: Data Table on Europe - Year-over-year growth 2023-2028 (%)
- Exhibits93: Chart on South America - Market size and forecast 2023-2028 ($ million)
- Exhibits94: Data Table on South America - Market size and forecast 2023-2028 ($ million)
- Exhibits95: Chart on South America - Year-over-year growth 2023-2028 (%)
- Exhibits96: Data Table on South America - Year-over-year growth 2023-2028 (%)
- Exhibits97: Chart on Middle East and Africa - Market size and forecast 2023-2028 ($ million)
- Exhibits98: Data Table on Middle East and Africa - Market size and forecast 2023-2028 ($ million)
- Exhibits99: Chart on Middle East and Africa - Year-over-year growth 2023-2028 (%)
- Exhibits100: Data Table on Middle East and Africa - Year-over-year growth 2023-2028 (%)
- Exhibits101: Chart on US - Market size and forecast 2023-2028 ($ million)
- Exhibits102: Data Table on US - Market size and forecast 2023-2028 ($ million)
- Exhibits103: Chart on US - Year-over-year growth 2023-2028 (%)
- Exhibits104: Data Table on US - Year-over-year growth 2023-2028 (%)
- Exhibits105: Chart on China - Market size and forecast 2023-2028 ($ million)
- Exhibits106: Data Table on China - Market size and forecast 2023-2028 ($ million)
- Exhibits107: Chart on China - Year-over-year growth 2023-2028 (%)
- Exhibits108: Data Table on China - Year-over-year growth 2023-2028 (%)
- Exhibits109: Chart on India - Market size and forecast 2023-2028 ($ million)
- Exhibits110: Data Table on India - Market size and forecast 2023-2028 ($ million)
- Exhibits111: Chart on India - Year-over-year growth 2023-2028 (%)
- Exhibits112: Data Table on India - Year-over-year growth 2023-2028 (%)
- Exhibits113: Chart on Germany - Market size and forecast 2023-2028 ($ million)
- Exhibits114: Data Table on Germany - Market size and forecast 2023-2028 ($ million)
- Exhibits115: Chart on Germany - Year-over-year growth 2023-2028 (%)
- Exhibits116: Data Table on Germany - Year-over-year growth 2023-2028 (%)
- Exhibits117: Chart on Japan - Market size and forecast 2023-2028 ($ million)
- Exhibits118: Data Table on Japan - Market size and forecast 2023-2028 ($ million)
- Exhibits119: Chart on Japan - Year-over-year growth 2023-2028 (%)
- Exhibits120: Data Table on Japan - Year-over-year growth 2023-2028 (%)
- Exhibits121: Chart on UK - Market size and forecast 2023-2028 ($ million)
- Exhibits122: Data Table on UK - Market size and forecast 2023-2028 ($ million)
- Exhibits123: Chart on UK - Year-over-year growth 2023-2028 (%)
- Exhibits124: Data Table on UK - Year-over-year growth 2023-2028 (%)
- Exhibits125: Chart on Canada - Market size and forecast 2023-2028 ($ million)
- Exhibits126: Data Table on Canada - Market size and forecast 2023-2028 ($ million)
- Exhibits127: Chart on Canada - Year-over-year growth 2023-2028 (%)
- Exhibits128: Data Table on Canada - Year-over-year growth 2023-2028 (%)
- Exhibits129: Chart on France - Market size and forecast 2023-2028 ($ million)
- Exhibits130: Data Table on France - Market size and forecast 2023-2028 ($ million)
- Exhibits131: Chart on France - Year-over-year growth 2023-2028 (%)
- Exhibits132: Data Table on France - Year-over-year growth 2023-2028 (%)
- Exhibits133: Chart on South Korea - Market size and forecast 2023-2028 ($ million)
- Exhibits134: Data Table on South Korea - Market size and forecast 2023-2028 ($ million)
- Exhibits135: Chart on South Korea - Year-over-year growth 2023-2028 (%)
- Exhibits136: Data Table on South Korea - Year-over-year growth 2023-2028 (%)
- Exhibits137: Chart on Italy - Market size and forecast 2023-2028 ($ million)
- Exhibits138: Data Table on Italy - Market size and forecast 2023-2028 ($ million)
- Exhibits139: Chart on Italy - Year-over-year growth 2023-2028 (%)
- Exhibits140: Data Table on Italy - Year-over-year growth 2023-2028 (%)
- Exhibits141: Market opportunity By Geographical Landscape ($ million)
- Exhibits142: Data Tables on Market opportunity By Geographical Landscape ($ million)
- Exhibits143: Impact of drivers and challenges in 2023 and 2028
- Exhibits144: Overview on criticality of inputs and factors of differentiation
- Exhibits145: Overview on factors of disruption
- Exhibits146: Impact of key risks on business
- Exhibits147: Companies covered
- Exhibits148: Company ranking index
- Exhibits149: Matrix on companies position and classification
- Exhibits150: ADEKA Corp. - Overview
- Exhibits151: ADEKA Corp. - Business segments
- Exhibits152: ADEKA Corp. - Key offerings
- Exhibits153: ADEKA Corp. - Segment focus
- Exhibits154: SWOT
- Exhibits155: Afton Chemical - Overview
- Exhibits156: Afton Chemical - Product / Service
- Exhibits157: Afton Chemical - Key offerings
- Exhibits158: SWOT
- Exhibits159: BASF SE - Overview
- Exhibits160: BASF SE - Business segments
- Exhibits161: BASF SE - Key news
- Exhibits162: BASF SE - Key offerings
- Exhibits163: BASF SE - Segment focus
- Exhibits164: SWOT
- Exhibits165: Clariant AG - Overview
- Exhibits166: Clariant AG - Business segments
- Exhibits167: Clariant AG - Key news
- Exhibits168: Clariant AG - Key offerings
- Exhibits169: Clariant AG - Segment focus
- Exhibits170: SWOT
- Exhibits171: Dorf Ketal Chemicals I Pvt. Ltd. - Overview
- Exhibits172: Dorf Ketal Chemicals I Pvt. Ltd. - Product / Service
- Exhibits173: Dorf Ketal Chemicals I Pvt. Ltd. - Key offerings
- Exhibits174: SWOT
- Exhibits175: Dow Inc. - Overview
- Exhibits176: Dow Inc. - Business segments
- Exhibits177: Dow Inc. - Key news
- Exhibits178: Dow Inc. - Key offerings
- Exhibits179: Dow Inc. - Segment focus
- Exhibits180: SWOT
- Exhibits181: Eastman Chemical Co. - Overview
- Exhibits182: Eastman Chemical Co. - Business segments
- Exhibits183: Eastman Chemical Co. - Key news
- Exhibits184: Eastman Chemical Co. - Key offerings
- Exhibits185: Eastman Chemical Co. - Segment focus
- Exhibits186: SWOT
- Exhibits187: Innospec Inc. - Overview
- Exhibits188: Innospec Inc. - Business segments
- Exhibits189: Innospec Inc. - Key offerings
- Exhibits190: Innospec Inc. - Segment focus
- Exhibits191: SWOT
- Exhibits192: Lanxess AG - Overview
- Exhibits193: Lanxess AG - Business segments
- Exhibits194: Lanxess AG - Key news
- Exhibits195: Lanxess AG - Key offerings
- Exhibits196: Lanxess AG - Segment focus
- Exhibits197: SWOT
- Exhibits198: Mayzo Inc. - Overview
- Exhibits199: Mayzo Inc. - Product / Service
- Exhibits200: Mayzo Inc. - Key offerings
- Exhibits201: SWOT
- Exhibits202: Metall-Chemie Holding GmbH - Overview
- Exhibits203: Metall-Chemie Holding GmbH - Product / Service
- Exhibits204: Metall-Chemie Holding GmbH - Key offerings
- Exhibits205: SWOT
- Exhibits206: R.T. Vanderbilt Holding Co. Inc. - Overview
- Exhibits207: R.T. Vanderbilt Holding Co. Inc. - Product / Service
- Exhibits208: R.T. Vanderbilt Holding Co. Inc. - Key offerings
- Exhibits209: SWOT
- Exhibits210: SI Group Inc. - Overview
- Exhibits211: SI Group Inc. - Product / Service
- Exhibits212: SI Group Inc. - Key offerings
- Exhibits213: SWOT
- Exhibits214: Songwon Industrial Co. Ltd. - Overview
- Exhibits215: Songwon Industrial Co. Ltd. - Business segments
- Exhibits216: Songwon Industrial Co. Ltd. - Key offerings
- Exhibits217: Songwon Industrial Co. Ltd. - Segment focus
- Exhibits218: SWOT
- Exhibits219: The Lubrizol Corp. - Overview
- Exhibits220: The Lubrizol Corp. - Product / Service
- Exhibits221: The Lubrizol Corp. - Key offerings
- Exhibits222: SWOT
- Exhibits223: Inclusions checklist
- Exhibits224: Exclusions checklist
- Exhibits225: Currency conversion rates for US$
- Exhibits226: Research methodology
- Exhibits227: Information sources
- Exhibits228: Data validation
- Exhibits229: Validation techniques employed for market sizing
- Exhibits230: Data synthesis
- Exhibits231: 360 degree market analysis
- Exhibits232: List of abbreviations
The metal deactivator market is forecasted to grow by USD 399.1 mn during 2023-2028, accelerating at a CAGR of 4.54% during the forecast period. The report on the metal deactivator market provides a holistic analysis, market size and forecast, trends, growth drivers, and challenges, as well as vendor analysis covering around 25 vendors.
The report offers an up-to-date analysis regarding the current market scenario, the latest trends and drivers, and the overall market environment. The market is driven by increasing need for reliable machinery and its effective maintenance, technological upgrades in machinery drive need for high-performance metal deactivator, and leveraging e-commerce industry to increase customer reach.
Technavio's metal deactivator market is segmented as below:
| Market Scope | |
|---|---|
| Base Year | 2024 |
| End Year | 2028 |
| Series Year | 2024-2028 |
| Growth Momentum | Accelerate |
| YOY 2024 | 4.26% |
| CAGR | 4.54% |
| Incremental Value | $399.1 mn |
By Formulation
- Oil soluble
- Water soluble
By End-user
- Automotive
- Industrial
- Aviation
- Marine
- Others
By Geographical Landscape
- APAC
- North America
- Europe
- South America
- Middle East and Africa
This study identifies the growing demand for sustainable metal deactivator as one of the prime reasons driving the metal deactivator market growth during the next few years. Also, growing demand for multifunctional additives in fuels and rapid industrialization in growing economies will lead to sizable demand in the market.
The report on the metal deactivator market covers the following areas:
- Metal deactivator market sizing
- Metal deactivator market forecast
- Metal deactivator market industry analysis
The robust vendor analysis is designed to help clients improve their market position, and in line with this, this report provides a detailed analysis of several leading metal deactivator market vendors that include ADEKA Corp., Afton Chemical, BASF SE, Clariant AG, Dorf Ketal Chemicals I Pvt. Ltd., Dow Inc., Eastman Chemical Co., Innospec Inc., Lanxess AG, Mayzo Inc., Metall-Chemie Holding GmbH, R.T. Vanderbilt Holding Co. Inc., SI Group Inc., Songwon Industrial Co. Ltd., and The Lubrizol Corp.. Also, the metal deactivator market analysis report includes information on upcoming trends and challenges that will influence market growth. This is to help companies strategize and leverage all forthcoming growth opportunities.
The study was conducted using an objective combination of primary and secondary information including inputs from key participants in the industry. The report contains a comprehensive market and vendor landscape in addition to an analysis of the key vendors.
The publisher presents a detailed picture of the market by the way of study, synthesis, and summation of data from multiple sources by an analysis of key parameters such as profit, pricing, competition, and promotions. It presents various market facets by identifying the key industry influencers. The data presented is comprehensive, reliable, and a result of extensive primary and secondary research. The market research reports provide a complete competitive landscape and an in-depth vendor selection methodology and analysis using qualitative and quantitative research to forecast accurate market growth.
Table of Contents
1 Executive Summary
- 1.1 Market overview
- Executive Summary - Chart on Market Overview
- Executive Summary - Data Table on Market Overview
- Executive Summary - Chart on Global Market Characteristics
- Executive Summary - Chart on Market By Geographical Landscape
- Executive Summary - Chart on Market Segmentation by Formulation
- Executive Summary - Chart on Market Segmentation by End-user
- Executive Summary - Chart on Incremental Growth
- Executive Summary - Data Table on Incremental Growth
- Executive Summary - Chart on Company Market Positioning
2 Technavio Analysis
- 2.1 Analysis of price sensitivity, lifecycle, customer purchase basket, adoption rates, and purchase criteria
- Analysis of price sensitivity, lifecycle, customer purchase basket, adoption rates, and purchase criteria
- 2.2 Criticality of inputs and Factors of differentiation
- Overview on criticality of inputs and factors of differentiation
- 2.3 Factors of disruption
- Overview on factors of disruption
- 2.4 Impact of drivers and challenges
- Impact of drivers and challenges in 2023 and 2028
3 Market Landscape
- 3.1 Market ecosystem
- Parent Market
- Data Table on - Parent Market
- 3.2 Market characteristics
- Market characteristics analysis
- 3.3 Value chain analysis
- Value Chain Analysis
4 Market Sizing
- 4.1 Market definition
- Offerings of companies included in the market definition
- 4.2 Market segment analysis
- Market segments
- 4.3 Market size 2023
- 4.4 Market outlook: Forecast for 2023-2028
- Chart on Global - Market size and forecast 2023-2028 ($ million)
- Data Table on Global - Market size and forecast 2023-2028 ($ million)
- Chart on Global Market: Year-over-year growth 2023-2028 (%)
- Data Table on Global Market: Year-over-year growth 2023-2028 (%)
5 Historic Market Size
- 5.1 Global Metal Deactivator Market 2018 - 2022
- Historic Market Size - Data Table on Global Metal Deactivator Market 2018 - 2022 ($ million)
- 5.2 Formulation segment analysis 2018 - 2022
- Historic Market Size - Formulation Segment 2018 - 2022 ($ million)
- 5.3 End-user segment analysis 2018 - 2022
- Historic Market Size - End-user Segment 2018 - 2022 ($ million)
- 5.4 Geography segment analysis 2018 - 2022
- Historic Market Size - Geography Segment 2018 - 2022 ($ million)
- 5.5 Country segment analysis 2018 - 2022
- Historic Market Size - Country Segment 2018 - 2022 ($ million)
6 Qualitative Analysis
- 6.1 Impact of AI in the Global Metal Deactivator Market
7 Five Forces Analysis
- 7.1 Five forces summary
- Five forces analysis - Comparison between 2023 and 2028
- 7.2 Bargaining power of buyers
- Bargaining power of buyers - Impact of key factors 2023 and 2028
- 7.3 Bargaining power of suppliers
- Bargaining power of suppliers - Impact of key factors in 2023 and 2028
- 7.4 Threat of new entrants
- Threat of new entrants - Impact of key factors in 2023 and 2028
- 7.5 Threat of substitutes
- Threat of substitutes - Impact of key factors in 2023 and 2028
- 7.6 Threat of rivalry
- Threat of rivalry - Impact of key factors in 2023 and 2028
- 7.7 Market condition
- Chart on Market condition - Five forces 2023 and 2028
8 Market Segmentation by Formulation
- 8.1 Market segments
- Chart on Formulation - Market share 2023-2028 (%)
- Data Table on Formulation - Market share 2023-2028 (%)
- 8.2 Comparison by Formulation
- Chart on Comparison by Formulation
- Data Table on Comparison by Formulation
- 8.3 Oil soluble - Market size and forecast 2023-2028
- Chart on Oil soluble - Market size and forecast 2023-2028 ($ million)
- Data Table on Oil soluble - Market size and forecast 2023-2028 ($ million)
- Chart on Oil soluble - Year-over-year growth 2023-2028 (%)
- Data Table on Oil soluble - Year-over-year growth 2023-2028 (%)
- 8.4 Water soluble - Market size and forecast 2023-2028
- Chart on Water soluble - Market size and forecast 2023-2028 ($ million)
- Data Table on Water soluble - Market size and forecast 2023-2028 ($ million)
- Chart on Water soluble - Year-over-year growth 2023-2028 (%)
- Data Table on Water soluble - Year-over-year growth 2023-2028 (%)
- 8.5 Market opportunity by Formulation
- Market opportunity by Formulation ($ million)
- Data Table on Market opportunity by Formulation ($ million)
9 Market Segmentation by End-user
- 9.1 Market segments
- Chart on End-user - Market share 2023-2028 (%)
- Data Table on End-user - Market share 2023-2028 (%)
- 9.2 Comparison by End-user
- Chart on Comparison by End-user
- Data Table on Comparison by End-user
- 9.3 Automotive - Market size and forecast 2023-2028
- Chart on Automotive - Market size and forecast 2023-2028 ($ million)
- Data Table on Automotive - Market size and forecast 2023-2028 ($ million)
- Chart on Automotive - Year-over-year growth 2023-2028 (%)
- Data Table on Automotive - Year-over-year growth 2023-2028 (%)
- 9.4 Industrial - Market size and forecast 2023-2028
- Chart on Industrial - Market size and forecast 2023-2028 ($ million)
- Data Table on Industrial - Market size and forecast 2023-2028 ($ million)
- Chart on Industrial - Year-over-year growth 2023-2028 (%)
- Data Table on Industrial - Year-over-year growth 2023-2028 (%)
- 9.5 Aviation - Market size and forecast 2023-2028
- Chart on Aviation - Market size and forecast 2023-2028 ($ million)
- Data Table on Aviation - Market size and forecast 2023-2028 ($ million)
- Chart on Aviation - Year-over-year growth 2023-2028 (%)
- Data Table on Aviation - Year-over-year growth 2023-2028 (%)
- 9.6 Marine - Market size and forecast 2023-2028
- Chart on Marine - Market size and forecast 2023-2028 ($ million)
- Data Table on Marine - Market size and forecast 2023-2028 ($ million)
- Chart on Marine - Year-over-year growth 2023-2028 (%)
- Data Table on Marine - Year-over-year growth 2023-2028 (%)
- 9.7 Others - Market size and forecast 2023-2028
- Chart on Others - Market size and forecast 2023-2028 ($ million)
- Data Table on Others - Market size and forecast 2023-2028 ($ million)
- Chart on Others - Year-over-year growth 2023-2028 (%)
- Data Table on Others - Year-over-year growth 2023-2028 (%)
- 9.8 Market opportunity by End-user
- Market opportunity by End-user ($ million)
- Data Table on Market opportunity by End-user ($ million)
10 Customer Landscape
- 10.1 Customer landscape overview
- Analysis of price sensitivity, lifecycle, customer purchase basket, adoption rates, and purchase criteria
11 Geographic Landscape
- 11.1 Geographic segmentation
- Chart on Market share By Geographical Landscape 2023-2028 (%)
- Data Table on Market share By Geographical Landscape 2023-2028 (%)
- 11.2 Geographic comparison
- Chart on Geographic comparison
- Data Table on Geographic comparison
- 11.3 APAC - Market size and forecast 2023-2028
- Chart on APAC - Market size and forecast 2023-2028 ($ million)
- Data Table on APAC - Market size and forecast 2023-2028 ($ million)
- Chart on APAC - Year-over-year growth 2023-2028 (%)
- Data Table on APAC - Year-over-year growth 2023-2028 (%)
- 11.4 North America - Market size and forecast 2023-2028
- Chart on North America - Market size and forecast 2023-2028 ($ million)
- Data Table on North America - Market size and forecast 2023-2028 ($ million)
- Chart on North America - Year-over-year growth 2023-2028 (%)
- Data Table on North America - Year-over-year growth 2023-2028 (%)
- 11.5 Europe - Market size and forecast 2023-2028
- Chart on Europe - Market size and forecast 2023-2028 ($ million)
- Data Table on Europe - Market size and forecast 2023-2028 ($ million)
- Chart on Europe - Year-over-year growth 2023-2028 (%)
- Data Table on Europe - Year-over-year growth 2023-2028 (%)
- 11.6 South America - Market size and forecast 2023-2028
- Chart on South America - Market size and forecast 2023-2028 ($ million)
- Data Table on South America - Market size and forecast 2023-2028 ($ million)
- Chart on South America - Year-over-year growth 2023-2028 (%)
- Data Table on South America - Year-over-year growth 2023-2028 (%)
- 11.7 Middle East and Africa - Market size and forecast 2023-2028
- Chart on Middle East and Africa - Market size and forecast 2023-2028 ($ million)
- Data Table on Middle East and Africa - Market size and forecast 2023-2028 ($ million)
- Chart on Middle East and Africa - Year-over-year growth 2023-2028 (%)
- Data Table on Middle East and Africa - Year-over-year growth 2023-2028 (%)
- 11.8 US - Market size and forecast 2023-2028
- Chart on US - Market size and forecast 2023-2028 ($ million)
- Data Table on US - Market size and forecast 2023-2028 ($ million)
- Chart on US - Year-over-year growth 2023-2028 (%)
- Data Table on US - Year-over-year growth 2023-2028 (%)
- 11.9 China - Market size and forecast 2023-2028
- Chart on China - Market size and forecast 2023-2028 ($ million)
- Data Table on China - Market size and forecast 2023-2028 ($ million)
- Chart on China - Year-over-year growth 2023-2028 (%)
- Data Table on China - Year-over-year growth 2023-2028 (%)
- 11.10 India - Market size and forecast 2023-2028
- Chart on India - Market size and forecast 2023-2028 ($ million)
- Data Table on India - Market size and forecast 2023-2028 ($ million)
- Chart on India - Year-over-year growth 2023-2028 (%)
- Data Table on India - Year-over-year growth 2023-2028 (%)
- 11.11 Germany - Market size and forecast 2023-2028
- Chart on Germany - Market size and forecast 2023-2028 ($ million)
- Data Table on Germany - Market size and forecast 2023-2028 ($ million)
- Chart on Germany - Year-over-year growth 2023-2028 (%)
- Data Table on Germany - Year-over-year growth 2023-2028 (%)
- 11.12 Japan - Market size and forecast 2023-2028
- Chart on Japan - Market size and forecast 2023-2028 ($ million)
- Data Table on Japan - Market size and forecast 2023-2028 ($ million)
- Chart on Japan - Year-over-year growth 2023-2028 (%)
- Data Table on Japan - Year-over-year growth 2023-2028 (%)
- 11.13 UK - Market size and forecast 2023-2028
- Chart on UK - Market size and forecast 2023-2028 ($ million)
- Data Table on UK - Market size and forecast 2023-2028 ($ million)
- Chart on UK - Year-over-year growth 2023-2028 (%)
- Data Table on UK - Year-over-year growth 2023-2028 (%)
- 11.14 Canada - Market size and forecast 2023-2028
- Chart on Canada - Market size and forecast 2023-2028 ($ million)
- Data Table on Canada - Market size and forecast 2023-2028 ($ million)
- Chart on Canada - Year-over-year growth 2023-2028 (%)
- Data Table on Canada - Year-over-year growth 2023-2028 (%)
- 11.15 France - Market size and forecast 2023-2028
- Chart on France - Market size and forecast 2023-2028 ($ million)
- Data Table on France - Market size and forecast 2023-2028 ($ million)
- Chart on France - Year-over-year growth 2023-2028 (%)
- Data Table on France - Year-over-year growth 2023-2028 (%)
- 11.16 South Korea - Market size and forecast 2023-2028
- Chart on South Korea - Market size and forecast 2023-2028 ($ million)
- Data Table on South Korea - Market size and forecast 2023-2028 ($ million)
- Chart on South Korea - Year-over-year growth 2023-2028 (%)
- Data Table on South Korea - Year-over-year growth 2023-2028 (%)
- 11.17 Italy - Market size and forecast 2023-2028
- Chart on Italy - Market size and forecast 2023-2028 ($ million)
- Data Table on Italy - Market size and forecast 2023-2028 ($ million)
- Chart on Italy - Year-over-year growth 2023-2028 (%)
- Data Table on Italy - Year-over-year growth 2023-2028 (%)
- 11.18 Market opportunity By Geographical Landscape
- Market opportunity By Geographical Landscape ($ million)
- Data Tables on Market opportunity By Geographical Landscape ($ million)
12 Drivers, Challenges, and Opportunity/Restraints
- 12.1 Market drivers
- 12.2 Market challenges
- 12.3 Impact of drivers and challenges
- Impact of drivers and challenges in 2023 and 2028
- 12.4 Market opportunities/restraints
13 Competitive Landscape
- 13.1 Overview
- 13.2 Competitive Landscape
- Overview on criticality of inputs and factors of differentiation
- 13.3 Landscape disruption
- Overview on factors of disruption
- 13.4 Industry risks
- Impact of key risks on business
14 Competitive Analysis
- 14.1 Companies profiled
- Companies covered
- 14.2 Company ranking index
- Company ranking index
- 14.3 Market positioning of companies
- Matrix on companies position and classification
- 14.4 ADEKA Corp.
- ADEKA Corp. - Overview
- ADEKA Corp. - Business segments
- ADEKA Corp. - Key offerings
- ADEKA Corp. - Segment focus
- SWOT
- 14.5 Afton Chemical
- Afton Chemical - Overview
- Afton Chemical - Product / Service
- Afton Chemical - Key offerings
- SWOT
- 14.6 BASF SE
- BASF SE - Overview
- BASF SE - Business segments
- BASF SE - Key news
- BASF SE - Key offerings
- BASF SE - Segment focus
- SWOT
- 14.7 Clariant AG
- Clariant AG - Overview
- Clariant AG - Business segments
- Clariant AG - Key news
- Clariant AG - Key offerings
- Clariant AG - Segment focus
- SWOT
- 14.8 Dorf Ketal Chemicals I Pvt. Ltd.
- Dorf Ketal Chemicals I Pvt. Ltd. - Overview
- Dorf Ketal Chemicals I Pvt. Ltd. - Product / Service
- Dorf Ketal Chemicals I Pvt. Ltd. - Key offerings
- SWOT
- 14.9 Dow Inc.
- Dow Inc. - Overview
- Dow Inc. - Business segments
- Dow Inc. - Key news
- Dow Inc. - Key offerings
- Dow Inc. - Segment focus
- SWOT
- 14.10 Eastman Chemical Co.
- Eastman Chemical Co. - Overview
- Eastman Chemical Co. - Business segments
- Eastman Chemical Co. - Key news
- Eastman Chemical Co. - Key offerings
- Eastman Chemical Co. - Segment focus
- SWOT
- 14.11 Innospec Inc.
- Innospec Inc. - Overview
- Innospec Inc. - Business segments
- Innospec Inc. - Key offerings
- Innospec Inc. - Segment focus
- SWOT
- 14.12 Lanxess AG
- Lanxess AG - Overview
- Lanxess AG - Business segments
- Lanxess AG - Key news
- Lanxess AG - Key offerings
- Lanxess AG - Segment focus
- SWOT
- 14.13 Mayzo Inc.
- Mayzo Inc. - Overview
- Mayzo Inc. - Product / Service
- Mayzo Inc. - Key offerings
- SWOT
- 14.14 Metall-Chemie Holding GmbH
- Metall-Chemie Holding GmbH - Overview
- Metall-Chemie Holding GmbH - Product / Service
- Metall-Chemie Holding GmbH - Key offerings
- SWOT
- 14.15 R.T. Vanderbilt Holding Co. Inc.
- R.T. Vanderbilt Holding Co. Inc. - Overview
- R.T. Vanderbilt Holding Co. Inc. - Product / Service
- R.T. Vanderbilt Holding Co. Inc. - Key offerings
- SWOT
- 14.16 SI Group Inc.
- SI Group Inc. - Overview
- SI Group Inc. - Product / Service
- SI Group Inc. - Key offerings
- SWOT
- 14.17 Songwon Industrial Co. Ltd.
- Songwon Industrial Co. Ltd. - Overview
- Songwon Industrial Co. Ltd. - Business segments
- Songwon Industrial Co. Ltd. - Key offerings
- Songwon Industrial Co. Ltd. - Segment focus
- SWOT
- 14.18 The Lubrizol Corp.
- The Lubrizol Corp. - Overview
- The Lubrizol Corp. - Product / Service
- The Lubrizol Corp. - Key offerings
- SWOT
15 Appendix
- 15.1 Scope of the report
- 15.2 Inclusions and exclusions checklist
- Inclusions checklist
- Exclusions checklist
- 15.3 Currency conversion rates for US$
- Currency conversion rates for US$
- 15.4 Research methodology
- Research methodology
- 15.5 Data procurement
- Information sources
- 15.6 Data validation
- Data validation
- 15.7 Validation techniques employed for market sizing
- Validation techniques employed for market sizing
- 15.8 Data synthesis
- Data synthesis
- 15.9 360 degree market analysis
- 360 degree market analysis
- 15.10 List of abbreviations
- List of abbreviations

