|
|
市場調査レポート
商品コード
1915394
世界の移動床式バイオリアクター(MBBR)市場2025-2029年Global Moving Bed Bioreactor (MBBR) Market 2025-2029 |
||||||
|
|||||||
カスタマイズ可能
|
|||||||

| 世界の移動床式バイオリアクター(MBBR)市場2025-2029年 |
|
出版日: 2026年01月19日
発行: TechNavio
ページ情報: 英文 296 Pages
納期: 即納可能
|

概要
世界の移動床式バイオリアクター(MBBR)市場は、2024年から2029年の予測期間において、CAGR 16.1%で成長し、19億9,760万米ドル規模に達すると予測されております。
本報告書は、世界の移動床式バイオリアクター(MBBR)市場に関する包括的な分析、市場規模と予測、動向、成長要因、課題、ならびに約25社のベンダー分析を提供します。
本レポートは、現在の市場状況、最新の動向と促進要因、市場環境全般に関する最新の分析を提供します。市場は、水処理に関連する規制、都市下水処理への投資拡大、低コスト下水処理プラントへの需要増加によって牽引されています。
本調査は、業界の主要関係者からの情報を含む、一次情報と二次情報の客観的な組み合わせを用いて実施されました。本レポートには、主要企業の分析に加え、包括的な市場規模データ、地域別分析を伴うセグメント、ベンダー情勢が含まれています。レポートには過去データと予測データが掲載されています。
| 市場範囲 | |
|---|---|
| 基準年 | 2025年 |
| 対象期間 | 2029年 |
| 予測期間 | 2025-2029 |
| 成長モメンタム | 加速 |
| 前年比 | 13.5% |
| CAGR | 16.1% |
| 増分額 | 19億9,760万米ドル |
本調査では、今後数年間における世界の移動床式バイオリアクター(MBBR)市場の成長を牽引する主な要因の一つとして、プロモーション支援および活動の必要性が高まっていることを明らかにしております。また、廃水処理プラントの進歩とMBBRへのIoTの統合により、市場において相当な需要が見込まれます。
目次
第1章 エグゼクティブサマリー
第2章 Technavio分析
- 価格・ライフサイクル・顧客購入バスケット・採用率・購入基準の分析
- インプットの重要性と差別化の要因
- 混乱の要因
- 促進要因と課題の影響
第3章 市場情勢
- 市場エコシステム
- 市場の特徴
- バリューチェーン分析
第4章 市場規模
- 市場の定義
- 市場セグメント分析
- 市場規模 2024
- 市場の見通し 2024-2029
第5章 市場規模実績
- 世界の移動床式バイオリアクター(MBBR)市場 2019-2023
- エンドユーザーセグメント分析 2019-2023
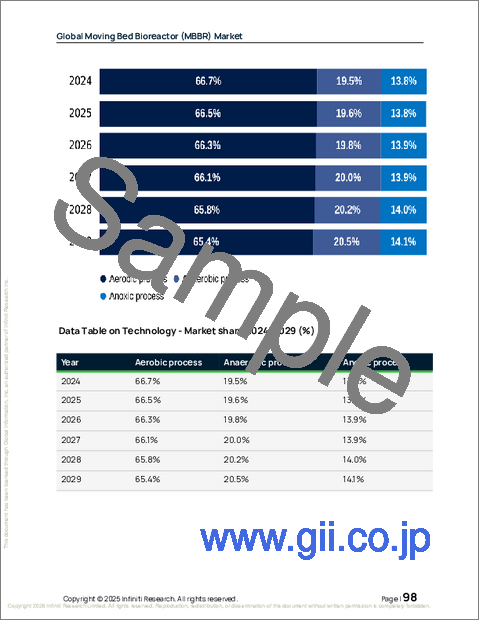
- 技術セグメント分析 2019-2023
- 材料セグメント分析 2019-2023
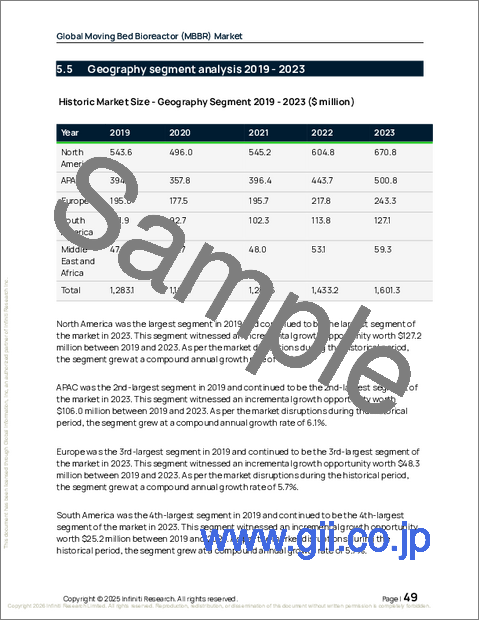
- 地域別セグメント分析 2019-2023
- 国別セグメント分析 2019-2023
第6章 定性分析
- AIの影響:世界の移動床式バイオリアクター(MBBR)市場
第7章 ファイブフォース分析
- ファイブフォースの要約
- 買い手の交渉力
- 供給企業の交渉力
- 新規参入業者の脅威
- 代替品の脅威
- 競争の脅威
- 市況
第8章 市場セグメンテーション:エンドユーザー別
- 比較:エンドユーザー別
- 都市下水処理
- パルプ・製紙
- 食品・飲料
- ヘルスケア
- その他
- 市場機会:エンドユーザー別
第9章 市場セグメンテーション:技術別
- 比較:技術別
- 好気性プロセス
- 嫌気性プロセス
- 無酸素プロセス
- 市場機会:技術別
第10章 市場セグメンテーション:素材別
- 比較:素材別
- ポリエチレン(PE)
- ポリプロピレン(PP)
- ポリ塩化ビニル(PVC)
- 市場機会:素材別
第11章 顧客情勢
第12章 地域別情勢
- 地域別セグメンテーション
- 地域別比較
- 北米
- 米国
- カナダ
- メキシコ
- アジア太平洋
- 中国
- インド
- 日本
- オーストラリア
- 韓国
- シンガポール
- 欧州
- ドイツ
- フランス
- 英国
- イタリア
- スペイン
- オランダ
- 南米
- ブラジル
- チリ
- アルゼンチン
- 中東・アフリカ
- サウジアラビア
- 南アフリカ
- アラブ首長国連邦
- カタール
- イスラエル
- 市場機会:地域別
第13章 促進要因・課題・機会
- 市場促進要因
- 市場の課題
- 促進要因と課題の影響
- 市場機会
第14章 競合情勢
- 概要
- 競合情勢
- 混乱の状況
- 業界のリスク
第15章 競合分析
- 企業プロファイル
- 企業ランキング指標
- 企業の市場ポジショニング
- Applied Water Solutions Inc.
- Aquapoint Inc.
- Aquatech International LLC
- Aqwise Wise Water Technologies Ltd.
- Biowater Technology AS
- CID Srl
- Colloide Engineering Systems
- Evoqua Water Technologies LLC
- Genesis Water Technologies Inc.
- Headworks International
- Novotec N V
- Ovivo Inc.
- PEXCO
- SUEZ International SAS
- Veolia Water Technologies
