|
|
市場調査レポート
商品コード
1908409
世界の3D細胞培養市場2026-2030年Global 3D Cell Culture Market 2026-2030 |
||||||
|
|||||||
カスタマイズ可能
|
|||||||

| 世界の3D細胞培養市場2026-2030年 |
|
出版日: 2026年01月14日
発行: TechNavio
ページ情報: 英文 301 Pages
納期: 即納可能
|

概要
世界の3D細胞培養市場は、2025年から2030年の間に22億630万米ドル規模で成長し、予測期間中のCAGRは19.2%と予測されております。
本報告書では、世界の3D細胞培養市場に関する包括的な分析、市場規模と予測、動向、成長要因、課題に加え、約25社のベンダー分析を提供しております。
本レポートは、現在の市場状況、最新の動向と促進要因、市場環境全般に関する最新の分析を提供します。市場の成長要因としては、予測可能な前臨床モデルへの需要増加、3D培養ワークフローにおける自動化とAIの統合拡大、医薬品開発におけるマイクロ流体式臓器オンチップシステムの統合進展が挙げられます。
本調査は、業界の主要関係者からの情報を含む、一次情報と二次情報の客観的な組み合わせを用いて実施されました。本レポートには、主要企業の分析に加え、包括的な市場規模データ、地域別分析を伴うセグメント、ベンダー情勢が含まれています。レポートには過去データと予測データが掲載されています。
| 市場範囲 | |
|---|---|
| 基準年 | 2026年 |
| 対象期間 | 2030年 |
| 予測期間 | 2026-2030 |
| 成長モメンタム | 加速 |
| 前年比2026年 | 16.1% |
| CAGR | 19.2% |
| 増分額 | 22億630万米ドル |
本調査では、自動化およびAIを活用した3D培養ワークフローの進展が、今後数年間における世界の3D細胞培養市場成長を牽引する主要要因の一つであると特定しております。また、マイクロ流体技術および臓器オンチップ技術の進歩、ならびにオルガノイドベースの個別化医療モデルの拡大が、市場において相当な需要を生み出すものと見込まれます。
目次
第1章 エグゼクティブサマリー
- 市場概要
第2章 Technavio分析
- 価格・ライフサイクル・顧客購入バスケット・採用率・購入基準の分析
- インプットの重要性と差別化の要因
- 混乱の要因
- 促進要因と課題の影響
第3章 市場情勢
- 市場エコシステム
- 市場の特徴
- バリューチェーン分析
第4章 市場規模
- 市場の定義
- 市場セグメント分析
- 市場規模 2025
- 市場の見通し 2025-2030
第5章 市場規模実績
- 世界の3D細胞培養市場 2020-2024
- 用途別セグメント分析 2020-2024
- タイプセグメント分析 2020-2024
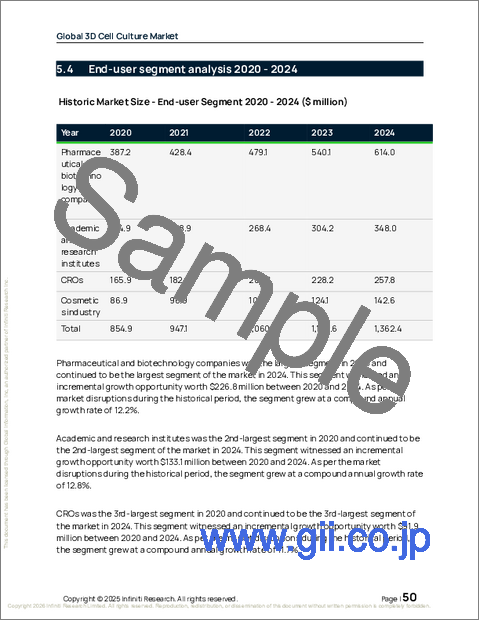
- エンドユーザーセグメント分析 2020-2024
- 地域別セグメント分析 2020-2024
- 国別セグメント分析 2020-2024
第6章 定性分析
- AIの影響:世界の3D細胞培養市場
第7章 ファイブフォース分析
- ファイブフォースの要約
- 買い手の交渉力
- 供給企業の交渉力
- 新規参入業者の脅威
- 代替品の脅威
- 競争の脅威
- 市況
第8章 市場セグメンテーション:用途別
- 市場セグメント
- 比較:用途別
- がんおよび幹細胞調査:市場規模と予測 2025-2030
- 創薬および毒性試験:市場規模と予測 2025-2030
- 組織工学および再生医療:市場規模と予測 2025-2030
- 市場機会:用途別
第9章 市場セグメンテーション:タイプ別
- 市場セグメント
- 比較:タイプ別
- 足場ベース:市場規模と予測 2025-2030
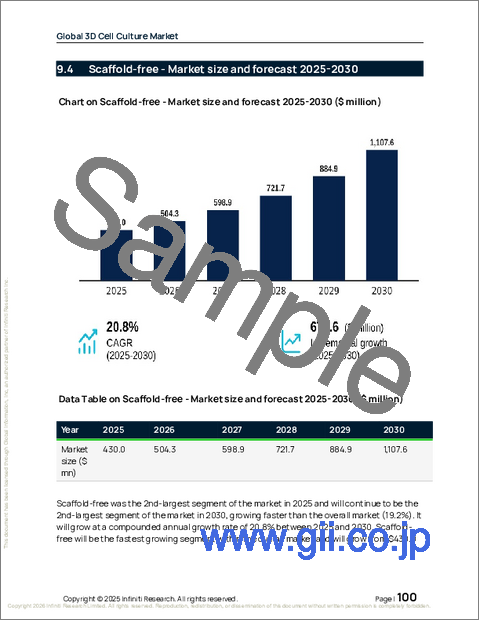
- 足場フリー:市場規模と予測 2025-2030
- バイオプリントシステム:市場規模と予測 2025-2030
- マイクロ流体技術ベース:市場規模と予測 2025-2030
- 市場機会:タイプ別
第10章 市場セグメンテーション:エンドユーザー別
- 市場セグメント
- 比較:エンドユーザー別
- 製薬・バイオテクノロジー企業:市場規模と予測 2025-2030
- 学術研究機関:市場規模と予測 2025-2030
- CRO:市場規模と予測 2025-2030
- 化粧品業界:市場規模と予測 2025-2030
- 市場機会:エンドユーザー別
第11章 顧客情勢
- 顧客情勢の概要
第12章 地域別情勢
- 地域別セグメンテーション
- 地域別比較
- 北米:市場規模と予測 2025-2030
- 欧州:市場規模と予測 2025-2030
- アジア:市場規模と予測 2025-2030
- 世界のその他の地域:市場規模と予測 2025-2030
- 市場機会:地域別
第13章 促進要因、課題、および機会
- 市場促進要因
- 市場の課題
- 促進要因と課題の影響
- 市場機会
第14章 競合情勢
- 概要
- 競合情勢
- 混乱の状況
- 業界のリスク
第15章 競合分析
- 企業プロファイル
- 企業ランキング指数
- 企業の市場ポジショニング
- 3D Biotek LLC
- CN Bio Innovations Ltd.
- Corning Inc.
- Greiner Bio One International GmbH
- Hamilton Co.
- InSphero AG
- Lonza Group Ltd.
- Merck KGaA
- MIMETAS BV
- PromoCell GmbH
- REPROCELL Inc.
- Revvity Inc.
- Synthecon Inc.
- Tecan Trading AG
- Thermo Fisher Scientific Inc.

