|
|
市場調査レポート
商品コード
1559447
工業用潤滑油添加剤の世界市場、2024~2028年Global Industrial Lubricant Additives Market 2024-2028 |
||||||

|
|||||||
カスタマイズ可能
|
|||||||


| 工業用潤滑油添加剤の世界市場、2024~2028年 |
|
出版日: 2024年08月27日
発行: TechNavio
ページ情報: 英文 214 Pages
納期: 即納可能
|

全表示
- 概要
- 図表
- 目次
工業用潤滑油添加剤市場は2023~2028年に15億3,690万米ドル、予測期間中のCAGRは3.59%で成長すると予測されます。
当レポートでは、工業用潤滑油添加剤市場の全体的な分析、市場規模・予測、動向、成長促進要因、課題、約25のベンダーを網羅したベンダー分析などを掲載しています。
現在の市場シナリオ、最新動向と促進要因、市場環境全体に関する最新分析を提供しています。市場は、エネルギー産業への投資拡大、成長経済圏における急速な工業化、専門的かつ合成的なソリューションの重視の高まりによって牽引されています。
| 市場範囲 | |
|---|---|
| 基準年 | 2024年 |
| 終了年 | 2028年 |
| 予測期間 | 2024~2028年 |
| 成長モメンタム | 加速 |
| 前年比[2024年] | 3.23% |
| CAGR | 3.59% |
| 増分額 | 15億3,690万米ドル |
本調査では、今後数年間の工業用潤滑油添加剤市場成長を牽引する主要要因の1つとして、加工・包装機械における工業用潤滑油添加剤採用の拡大を挙げています。また、バイオベースの潤滑油添加剤の需要の増加や、スマート潤滑システムにおけるモノのインターネット(iot)とセンサー技術の統合は、市場の大きな需要につながります。
目次
第1章 エグゼクティブサマリー
- 市場概要
第2章 Technavio分析
- 価格・ライフサイクル・顧客購入バスケット・採用率・購入基準の分析
- インプットの重要性と差別化の要因
- 混乱の要因
- 促進要因と課題の影響
第3章 市場情勢
- 市場エコシステム
- 市場の特徴
- バリューチェーン分析
第4章 市場規模の評価
- 市場の定義
- 市場セグメント分析
- 市場規模 2023年
- 市場の展望 2023~2028年
第5章 市場規模実績
- 工業用潤滑油添加剤の世界市場 2018~2022年
- 用途別セグメント分析 2018~2022年
- タイプ別セグメント分析 2018~2022年
- 地域別セグメント分析 2018~2022年
- 国別セグメント分析 2018~2022年
第6章 定性分析
- AIの影響-工業用潤滑油添加剤の世界市場
第7章 ファイブフォース分析
- ファイブフォースの要約
- 買い手の交渉力
- 供給企業の交渉力
- 新規参入業者の脅威
- 代替品の脅威
- 競争の脅威
- 市況
第8章 市場セグメンテーション:用途別
- 市場セグメンテーション
- 比較:用途別
- エンジン:市場規模と予測 2023~2028年
- ギア:市場規模と予測 2023~2028年
- 油圧システム:市場規模と予測 2023~2028年
- 蒸気タービン:市場規模と予測 2023~2028年
- 市場機会:用途別
第9章 市場セグメンテーション:タイプ別
- 市場セグメンテーション
- 比較:タイプ別
- パフォーマンス向上:市場規模と予測 2023~2028年
- 表面保護:市場規模と予測 2023~2028年
- 潤滑油保護:市場規模と予測 2023~2028年
- 市場機会:タイプ別
第10章 顧客情勢
- 顧客情勢概要
第11章 地域別情勢
- 地域別セグメンテーション
- 比較:地域別
- アジア太平洋:市場規模と予測 2023~2028年
- 欧州:市場規模と予測 2023~2028年
- 北米:市場規模と予測 2023~2028年
- 中東・アフリカ:市場規模と予測 2023~2028年
- 南米:市場規模と予測 2023~2028年
- 中国:市場規模と予測 2023~2028年
- 米国:市場規模と予測 2023~2028年
- 日本:市場規模と予測 2023~2028年
- ドイツ:市場規模と予測 2023~2028年
- インド:市場規模と予測 2023~2028年
- 韓国:市場規模と予測 2023~2028年
- イタリア:市場規模と予測 2023~2028年
- フランス:市場規模と予測 2023~2028年
- 英国:市場規模と予測 2023~2028年
- インドネシア:市場規模と予測 2023~2028年
- 市場機会:地域情勢別
第12章 促進要因・課題・機会・抑制要因
- 市場促進要因
- 市場課題
- 促進要因と課題の影響
- 市場の機会・抑制要因
第13章 競合情勢
- 概要
- 競合情勢
- 混乱の状況
- 業界のリスク
第14章 競合分析
- 企業プロファイル
- 企業ランキング指数
- 企業の市場ポジショニング
- Afton Chemical
- BASF SE
- BRB International BV
- Chevron Corp.
- Clariant AG
- DOG Deutsche Oelfabrik
- Dover Chemical Corp.
- Eni SpA
- Evonik Industries AG
- Exxon Mobil Corp.
- FUCHS PETROLUB SE
- King Industries Inc.
- Lanxess AG
- The Lubrizol Corp.
- Wuxi Southern Petroleum Additives Co. Ltd.
第15章 付録
Exhibits:
- Exhibits1: Executive Summary - Chart on Market Overview
- Exhibits2: Executive Summary - Data Table on Market Overview
- Exhibits3: Executive Summary - Chart on Global Market Characteristics
- Exhibits4: Executive Summary - Chart on Market By Geographical Landscape
- Exhibits5: Executive Summary - Chart on Market Segmentation by Application
- Exhibits6: Executive Summary - Chart on Market Segmentation by Type
- Exhibits7: Executive Summary - Chart on Incremental Growth
- Exhibits8: Executive Summary - Data Table on Incremental Growth
- Exhibits9: Executive Summary - Chart on Company Market Positioning
- Exhibits10: Analysis of price sensitivity, lifecycle, customer purchase basket, adoption rates, and purchase criteria
- Exhibits11: Overview on criticality of inputs and factors of differentiation
- Exhibits12: Overview on factors of disruption
- Exhibits13: Impact of drivers and challenges in 2023 and 2028
- Exhibits14: Parent Market
- Exhibits15: Data Table on - Parent Market
- Exhibits16: Market characteristics analysis
- Exhibits17: Value Chain Analysis
- Exhibits18: Offerings of companies included in the market definition
- Exhibits19: Market segments
- Exhibits20: Chart on Global - Market size and forecast 2023-2028 ($ million)
- Exhibits21: Data Table on Global - Market size and forecast 2023-2028 ($ million)
- Exhibits22: Chart on Global Market: Year-over-year growth 2023-2028 (%)
- Exhibits23: Data Table on Global Market: Year-over-year growth 2023-2028 (%)
- Exhibits24: Historic Market Size - Data Table on Global Industrial Lubricant Additives Market 2018 - 2022 ($ million)
- Exhibits25: Historic Market Size - Application Segment 2018 - 2022 ($ million)
- Exhibits26: Historic Market Size - Type Segment 2018 - 2022 ($ million)
- Exhibits27: Historic Market Size - Geography Segment 2018 - 2022 ($ million)
- Exhibits28: Historic Market Size - Country Segment 2018 - 2022 ($ million)
- Exhibits29: Five forces analysis - Comparison between 2023 and 2028
- Exhibits30: Bargaining power of buyers - Impact of key factors 2023 and 2028
- Exhibits31: Bargaining power of suppliers - Impact of key factors in 2023 and 2028
- Exhibits32: Threat of new entrants - Impact of key factors in 2023 and 2028
- Exhibits33: Threat of substitutes - Impact of key factors in 2023 and 2028
- Exhibits34: Threat of rivalry - Impact of key factors in 2023 and 2028
- Exhibits35: Chart on Market condition - Five forces 2023 and 2028
- Exhibits36: Chart on Application - Market share 2023-2028 (%)
- Exhibits37: Data Table on Application - Market share 2023-2028 (%)
- Exhibits38: Chart on Comparison by Application
- Exhibits39: Data Table on Comparison by Application
- Exhibits40: Chart on Engines - Market size and forecast 2023-2028 ($ million)
- Exhibits41: Data Table on Engines - Market size and forecast 2023-2028 ($ million)
- Exhibits42: Chart on Engines - Year-over-year growth 2023-2028 (%)
- Exhibits43: Data Table on Engines - Year-over-year growth 2023-2028 (%)
- Exhibits44: Chart on Gears - Market size and forecast 2023-2028 ($ million)
- Exhibits45: Data Table on Gears - Market size and forecast 2023-2028 ($ million)
- Exhibits46: Chart on Gears - Year-over-year growth 2023-2028 (%)
- Exhibits47: Data Table on Gears - Year-over-year growth 2023-2028 (%)
- Exhibits48: Chart on Hydraulic systems - Market size and forecast 2023-2028 ($ million)
- Exhibits49: Data Table on Hydraulic systems - Market size and forecast 2023-2028 ($ million)
- Exhibits50: Chart on Hydraulic systems - Year-over-year growth 2023-2028 (%)
- Exhibits51: Data Table on Hydraulic systems - Year-over-year growth 2023-2028 (%)
- Exhibits52: Chart on Steam turbines - Market size and forecast 2023-2028 ($ million)
- Exhibits53: Data Table on Steam turbines - Market size and forecast 2023-2028 ($ million)
- Exhibits54: Chart on Steam turbines - Year-over-year growth 2023-2028 (%)
- Exhibits55: Data Table on Steam turbines - Year-over-year growth 2023-2028 (%)
- Exhibits56: Market opportunity by Application ($ million)
- Exhibits57: Data Table on Market opportunity by Application ($ million)
- Exhibits58: Chart on Type - Market share 2023-2028 (%)
- Exhibits59: Data Table on Type - Market share 2023-2028 (%)
- Exhibits60: Chart on Comparison by Type
- Exhibits61: Data Table on Comparison by Type
- Exhibits62: Chart on Performance enhancing additives - Market size and forecast 2023-2028 ($ million)
- Exhibits63: Data Table on Performance enhancing additives - Market size and forecast 2023-2028 ($ million)
- Exhibits64: Chart on Performance enhancing additives - Year-over-year growth 2023-2028 (%)
- Exhibits65: Data Table on Performance enhancing additives - Year-over-year growth 2023-2028 (%)
- Exhibits66: Chart on Surface protecting additives - Market size and forecast 2023-2028 ($ million)
- Exhibits67: Data Table on Surface protecting additives - Market size and forecast 2023-2028 ($ million)
- Exhibits68: Chart on Surface protecting additives - Year-over-year growth 2023-2028 (%)
- Exhibits69: Data Table on Surface protecting additives - Year-over-year growth 2023-2028 (%)
- Exhibits70: Chart on Lubricant protecting additives - Market size and forecast 2023-2028 ($ million)
- Exhibits71: Data Table on Lubricant protecting additives - Market size and forecast 2023-2028 ($ million)
- Exhibits72: Chart on Lubricant protecting additives - Year-over-year growth 2023-2028 (%)
- Exhibits73: Data Table on Lubricant protecting additives - Year-over-year growth 2023-2028 (%)
- Exhibits74: Market opportunity by Type ($ million)
- Exhibits75: Data Table on Market opportunity by Type ($ million)
- Exhibits76: Analysis of price sensitivity, lifecycle, customer purchase basket, adoption rates, and purchase criteria
- Exhibits77: Chart on Market share By Geographical Landscape 2023-2028 (%)
- Exhibits78: Data Table on Market share By Geographical Landscape 2023-2028 (%)
- Exhibits79: Chart on Geographic comparison
- Exhibits80: Data Table on Geographic comparison
- Exhibits81: Chart on APAC - Market size and forecast 2023-2028 ($ million)
- Exhibits82: Data Table on APAC - Market size and forecast 2023-2028 ($ million)
- Exhibits83: Chart on APAC - Year-over-year growth 2023-2028 (%)
- Exhibits84: Data Table on APAC - Year-over-year growth 2023-2028 (%)
- Exhibits85: Chart on Europe - Market size and forecast 2023-2028 ($ million)
- Exhibits86: Data Table on Europe - Market size and forecast 2023-2028 ($ million)
- Exhibits87: Chart on Europe - Year-over-year growth 2023-2028 (%)
- Exhibits88: Data Table on Europe - Year-over-year growth 2023-2028 (%)
- Exhibits89: Chart on North America - Market size and forecast 2023-2028 ($ million)
- Exhibits90: Data Table on North America - Market size and forecast 2023-2028 ($ million)
- Exhibits91: Chart on North America - Year-over-year growth 2023-2028 (%)
- Exhibits92: Data Table on North America - Year-over-year growth 2023-2028 (%)
- Exhibits93: Chart on Middle East and Africa - Market size and forecast 2023-2028 ($ million)
- Exhibits94: Data Table on Middle East and Africa - Market size and forecast 2023-2028 ($ million)
- Exhibits95: Chart on Middle East and Africa - Year-over-year growth 2023-2028 (%)
- Exhibits96: Data Table on Middle East and Africa - Year-over-year growth 2023-2028 (%)
- Exhibits97: Chart on South America - Market size and forecast 2023-2028 ($ million)
- Exhibits98: Data Table on South America - Market size and forecast 2023-2028 ($ million)
- Exhibits99: Chart on South America - Year-over-year growth 2023-2028 (%)
- Exhibits100: Data Table on South America - Year-over-year growth 2023-2028 (%)
- Exhibits101: Chart on China - Market size and forecast 2023-2028 ($ million)
- Exhibits102: Data Table on China - Market size and forecast 2023-2028 ($ million)
- Exhibits103: Chart on China - Year-over-year growth 2023-2028 (%)
- Exhibits104: Data Table on China - Year-over-year growth 2023-2028 (%)
- Exhibits105: Chart on US - Market size and forecast 2023-2028 ($ million)
- Exhibits106: Data Table on US - Market size and forecast 2023-2028 ($ million)
- Exhibits107: Chart on US - Year-over-year growth 2023-2028 (%)
- Exhibits108: Data Table on US - Year-over-year growth 2023-2028 (%)
- Exhibits109: Chart on Japan - Market size and forecast 2023-2028 ($ million)
- Exhibits110: Data Table on Japan - Market size and forecast 2023-2028 ($ million)
- Exhibits111: Chart on Japan - Year-over-year growth 2023-2028 (%)
- Exhibits112: Data Table on Japan - Year-over-year growth 2023-2028 (%)
- Exhibits113: Chart on Germany - Market size and forecast 2023-2028 ($ million)
- Exhibits114: Data Table on Germany - Market size and forecast 2023-2028 ($ million)
- Exhibits115: Chart on Germany - Year-over-year growth 2023-2028 (%)
- Exhibits116: Data Table on Germany - Year-over-year growth 2023-2028 (%)
- Exhibits117: Chart on India - Market size and forecast 2023-2028 ($ million)
- Exhibits118: Data Table on India - Market size and forecast 2023-2028 ($ million)
- Exhibits119: Chart on India - Year-over-year growth 2023-2028 (%)
- Exhibits120: Data Table on India - Year-over-year growth 2023-2028 (%)
- Exhibits121: Chart on South Korea - Market size and forecast 2023-2028 ($ million)
- Exhibits122: Data Table on South Korea - Market size and forecast 2023-2028 ($ million)
- Exhibits123: Chart on South Korea - Year-over-year growth 2023-2028 (%)
- Exhibits124: Data Table on South Korea - Year-over-year growth 2023-2028 (%)
- Exhibits125: Chart on Italy - Market size and forecast 2023-2028 ($ million)
- Exhibits126: Data Table on Italy - Market size and forecast 2023-2028 ($ million)
- Exhibits127: Chart on Italy - Year-over-year growth 2023-2028 (%)
- Exhibits128: Data Table on Italy - Year-over-year growth 2023-2028 (%)
- Exhibits129: Chart on France - Market size and forecast 2023-2028 ($ million)
- Exhibits130: Data Table on France - Market size and forecast 2023-2028 ($ million)
- Exhibits131: Chart on France - Year-over-year growth 2023-2028 (%)
- Exhibits132: Data Table on France - Year-over-year growth 2023-2028 (%)
- Exhibits133: Chart on UK - Market size and forecast 2023-2028 ($ million)
- Exhibits134: Data Table on UK - Market size and forecast 2023-2028 ($ million)
- Exhibits135: Chart on UK - Year-over-year growth 2023-2028 (%)
- Exhibits136: Data Table on UK - Year-over-year growth 2023-2028 (%)
- Exhibits137: Chart on Indonesia - Market size and forecast 2023-2028 ($ million)
- Exhibits138: Data Table on Indonesia - Market size and forecast 2023-2028 ($ million)
- Exhibits139: Chart on Indonesia - Year-over-year growth 2023-2028 (%)
- Exhibits140: Data Table on Indonesia - Year-over-year growth 2023-2028 (%)
- Exhibits141: Market opportunity By Geographical Landscape ($ million)
- Exhibits142: Data Tables on Market opportunity By Geographical Landscape ($ million)
- Exhibits143: Impact of drivers and challenges in 2023 and 2028
- Exhibits144: Overview on criticality of inputs and factors of differentiation
- Exhibits145: Overview on factors of disruption
- Exhibits146: Impact of key risks on business
- Exhibits147: Companies covered
- Exhibits148: Company ranking index
- Exhibits149: Matrix on companies position and classification
- Exhibits150: Afton Chemical - Overview
- Exhibits151: Afton Chemical - Product / Service
- Exhibits152: Afton Chemical - Key offerings
- Exhibits153: SWOT
- Exhibits154: BASF SE - Overview
- Exhibits155: BASF SE - Business segments
- Exhibits156: BASF SE - Key news
- Exhibits157: BASF SE - Key offerings
- Exhibits158: BASF SE - Segment focus
- Exhibits159: SWOT
- Exhibits160: BRB International BV - Overview
- Exhibits161: BRB International BV - Product / Service
- Exhibits162: BRB International BV - Key offerings
- Exhibits163: SWOT
- Exhibits164: Chevron Corp. - Overview
- Exhibits165: Chevron Corp. - Business segments
- Exhibits166: Chevron Corp. - Key news
- Exhibits167: Chevron Corp. - Key offerings
- Exhibits168: Chevron Corp. - Segment focus
- Exhibits169: SWOT
- Exhibits170: Clariant AG - Overview
- Exhibits171: Clariant AG - Business segments
- Exhibits172: Clariant AG - Key news
- Exhibits173: Clariant AG - Key offerings
- Exhibits174: Clariant AG - Segment focus
- Exhibits175: SWOT
- Exhibits176: DOG Deutsche Oelfabrik - Overview
- Exhibits177: DOG Deutsche Oelfabrik - Product / Service
- Exhibits178: DOG Deutsche Oelfabrik - Key offerings
- Exhibits179: SWOT
- Exhibits180: Dover Chemical Corp. - Overview
- Exhibits181: Dover Chemical Corp. - Product / Service
- Exhibits182: Dover Chemical Corp. - Key offerings
- Exhibits183: SWOT
- Exhibits184: Eni SpA - Overview
- Exhibits185: Eni SpA - Business segments
- Exhibits186: Eni SpA - Key news
- Exhibits187: Eni SpA - Key offerings
- Exhibits188: Eni SpA - Segment focus
- Exhibits189: SWOT
- Exhibits190: Evonik Industries AG - Overview
- Exhibits191: Evonik Industries AG - Business segments
- Exhibits192: Evonik Industries AG - Key news
- Exhibits193: Evonik Industries AG - Key offerings
- Exhibits194: Evonik Industries AG - Segment focus
- Exhibits195: SWOT
- Exhibits196: Exxon Mobil Corp. - Overview
- Exhibits197: Exxon Mobil Corp. - Product / Service
- Exhibits198: Exxon Mobil Corp. - Key offerings
- Exhibits199: SWOT
- Exhibits200: FUCHS PETROLUB SE - Overview
- Exhibits201: FUCHS PETROLUB SE - Business segments
- Exhibits202: FUCHS PETROLUB SE - Key news
- Exhibits203: FUCHS PETROLUB SE - Key offerings
- Exhibits204: FUCHS PETROLUB SE - Segment focus
- Exhibits205: SWOT
- Exhibits206: King Industries Inc. - Overview
- Exhibits207: King Industries Inc. - Product / Service
- Exhibits208: King Industries Inc. - Key offerings
- Exhibits209: SWOT
- Exhibits210: Lanxess AG - Overview
- Exhibits211: Lanxess AG - Business segments
- Exhibits212: Lanxess AG - Key news
- Exhibits213: Lanxess AG - Key offerings
- Exhibits214: Lanxess AG - Segment focus
- Exhibits215: SWOT
- Exhibits216: The Lubrizol Corp. - Overview
- Exhibits217: The Lubrizol Corp. - Product / Service
- Exhibits218: The Lubrizol Corp. - Key offerings
- Exhibits219: SWOT
- Exhibits220: Wuxi Southern Petroleum Additives Co. Ltd. - Overview
- Exhibits221: Wuxi Southern Petroleum Additives Co. Ltd. - Product / Service
- Exhibits222: Wuxi Southern Petroleum Additives Co. Ltd. - Key offerings
- Exhibits223: SWOT
- Exhibits224: Inclusions checklist
- Exhibits225: Exclusions checklist
- Exhibits226: Currency conversion rates for US$
- Exhibits227: Research methodology
- Exhibits228: Information sources
- Exhibits229: Data validation
- Exhibits230: Validation techniques employed for market sizing
- Exhibits231: Data synthesis
- Exhibits232: 360 degree market analysis
- Exhibits233: List of abbreviations
The industrial lubricant additives market is forecasted to grow by USD 1536.9 mn during 2023-2028, accelerating at a CAGR of 3.59% during the forecast period. The report on the industrial lubricant additives market provides a holistic analysis, market size and forecast, trends, growth drivers, and challenges, as well as vendor analysis covering around 25 vendors.
The report offers an up-to-date analysis regarding the current market scenario, the latest trends and drivers, and the overall market environment. The market is driven by growth investments in energy industries, rapid industrialization in growing economies, and growing emphasis on specialized and synthetic solutions.
Technavio's industrial lubricant additives market is segmented as below:
| Market Scope | |
|---|---|
| Base Year | 2024 |
| End Year | 2028 |
| Series Year | 2024-2028 |
| Growth Momentum | Accelerate |
| YOY 2024 | 3.23% |
| CAGR | 3.59% |
| Incremental Value | $1536.9 mn |
By Application
- Engines
- Gears
- Hydraulic systems
- Steam turbines
By Type
- Performance enhancing additives
- Surface protecting additives
- Lubricant protecting additives
By Geographical Landscape
- APAC
- Europe
- North America
- Middle East and Africa
- South America
This study identifies the growing adoption of industrial lubricant additives in processing and packaging machinery as one of the prime reasons driving the industrial lubricant additives market growth during the next few years. Also, rise in demand for bio-based lubricant additives and integration of internet of things (iot) and sensor technology in smart lubrication systems will lead to sizable demand in the market.
The report on the industrial lubricant additives market covers the following areas:
- Industrial lubricant additives market sizing
- Industrial lubricant additives market forecast
- Industrial lubricant additives market industry analysis
The robust vendor analysis is designed to help clients improve their market position, and in line with this, this report provides a detailed analysis of several leading industrial lubricant additives market vendors that include Afton Chemical, BASF SE, BRB International BV, Chevron Corp., Clariant AG, DOG Deutsche Oelfabrik, Dover Chemical Corp., Eni SpA, Evonik Industries AG, Exxon Mobil Corp., FUCHS PETROLUB SE, Infineum International Ltd., Italmatch Chemicals Spa, King Industries Inc., Lanxess AG, Lucas Oil Products Inc., The Lubrizol Corp., Valvoline Inc., and Wuxi Southern Petroleum Additives Co. Ltd.. Also, the industrial lubricant additives market analysis report includes information on upcoming trends and challenges that will influence market growth. This is to help companies strategize and leverage all forthcoming growth opportunities.
The study was conducted using an objective combination of primary and secondary information including inputs from key participants in the industry. The report contains a comprehensive market and vendor landscape in addition to an analysis of the key vendors.
The publisher presents a detailed picture of the market by the way of study, synthesis, and summation of data from multiple sources by an analysis of key parameters such as profit, pricing, competition, and promotions. It presents various market facets by identifying the key industry influencers. The data presented is comprehensive, reliable, and a result of extensive research - both primary and secondary. The market research reports provide a complete competitive landscape and an in-depth vendor selection methodology and analysis using qualitative and quantitative research to forecast the accurate market growth.
Table of Contents
1 Executive Summary
- 1.1 Market overview
- Executive Summary - Chart on Market Overview
- Executive Summary - Data Table on Market Overview
- Executive Summary - Chart on Global Market Characteristics
- Executive Summary - Chart on Market By Geographical Landscape
- Executive Summary - Chart on Market Segmentation by Application
- Executive Summary - Chart on Market Segmentation by Type
- Executive Summary - Chart on Incremental Growth
- Executive Summary - Data Table on Incremental Growth
- Executive Summary - Chart on Company Market Positioning
2 Technavio Analysis
- 2.1 Analysis of price sensitivity, lifecycle, customer purchase basket, adoption rates, and purchase criteria
- Analysis of price sensitivity, lifecycle, customer purchase basket, adoption rates, and purchase criteria
- 2.2 Criticality of inputs and Factors of differentiation
- Overview on criticality of inputs and factors of differentiation
- 2.3 Factors of disruption
- Overview on factors of disruption
- 2.4 Impact of drivers and challenges
- Impact of drivers and challenges in 2023 and 2028
3 Market Landscape
- 3.1 Market ecosystem
- Parent Market
- Data Table on - Parent Market
- 3.2 Market characteristics
- Market characteristics analysis
- 3.3 Value chain analysis
- Value Chain Analysis
4 Market Sizing
- 4.1 Market definition
- Offerings of companies included in the market definition
- 4.2 Market segment analysis
- Market segments
- 4.3 Market size 2023
- 4.4 Market outlook: Forecast for 2023-2028
- Chart on Global - Market size and forecast 2023-2028 ($ million)
- Data Table on Global - Market size and forecast 2023-2028 ($ million)
- Chart on Global Market: Year-over-year growth 2023-2028 (%)
- Data Table on Global Market: Year-over-year growth 2023-2028 (%)
5 Historic Market Size
- 5.1 Global Industrial Lubricant Additives Market 2018 - 2022
- Historic Market Size - Data Table on Global Industrial Lubricant Additives Market 2018 - 2022 ($ million)
- 5.2 Application segment analysis 2018 - 2022
- Historic Market Size - Application Segment 2018 - 2022 ($ million)
- 5.3 Type segment analysis 2018 - 2022
- Historic Market Size - Type Segment 2018 - 2022 ($ million)
- 5.4 Geography segment analysis 2018 - 2022
- Historic Market Size - Geography Segment 2018 - 2022 ($ million)
- 5.5 Country segment analysis 2018 - 2022
- Historic Market Size - Country Segment 2018 - 2022 ($ million)
6 Qualitative Analysis
- 6.1 Impact of AI on global industrial lubricant additives market
7 Five Forces Analysis
- 7.1 Five forces summary
- Five forces analysis - Comparison between 2023 and 2028
- 7.2 Bargaining power of buyers
- Bargaining power of buyers - Impact of key factors 2023 and 2028
- 7.3 Bargaining power of suppliers
- Bargaining power of suppliers - Impact of key factors in 2023 and 2028
- 7.4 Threat of new entrants
- Threat of new entrants - Impact of key factors in 2023 and 2028
- 7.5 Threat of substitutes
- Threat of substitutes - Impact of key factors in 2023 and 2028
- 7.6 Threat of rivalry
- Threat of rivalry - Impact of key factors in 2023 and 2028
- 7.7 Market condition
- Chart on Market condition - Five forces 2023 and 2028
8 Market Segmentation by Application
- 8.1 Market segments
- Chart on Application - Market share 2023-2028 (%)
- Data Table on Application - Market share 2023-2028 (%)
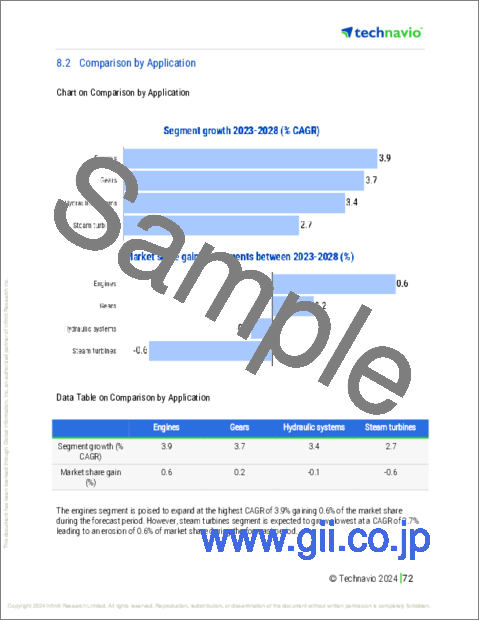
- 8.2 Comparison by Application
- Chart on Comparison by Application
- Data Table on Comparison by Application
- 8.3 Engines - Market size and forecast 2023-2028
- Chart on Engines - Market size and forecast 2023-2028 ($ million)
- Data Table on Engines - Market size and forecast 2023-2028 ($ million)
- Chart on Engines - Year-over-year growth 2023-2028 (%)
- Data Table on Engines - Year-over-year growth 2023-2028 (%)
- 8.4 Gears - Market size and forecast 2023-2028
- Chart on Gears - Market size and forecast 2023-2028 ($ million)
- Data Table on Gears - Market size and forecast 2023-2028 ($ million)
- Chart on Gears - Year-over-year growth 2023-2028 (%)
- Data Table on Gears - Year-over-year growth 2023-2028 (%)
- 8.5 Hydraulic systems - Market size and forecast 2023-2028
- Chart on Hydraulic systems - Market size and forecast 2023-2028 ($ million)
- Data Table on Hydraulic systems - Market size and forecast 2023-2028 ($ million)
- Chart on Hydraulic systems - Year-over-year growth 2023-2028 (%)
- Data Table on Hydraulic systems - Year-over-year growth 2023-2028 (%)
- 8.6 Steam turbines - Market size and forecast 2023-2028
- Chart on Steam turbines - Market size and forecast 2023-2028 ($ million)
- Data Table on Steam turbines - Market size and forecast 2023-2028 ($ million)
- Chart on Steam turbines - Year-over-year growth 2023-2028 (%)
- Data Table on Steam turbines - Year-over-year growth 2023-2028 (%)
- 8.7 Market opportunity by Application
- Market opportunity by Application ($ million)
- Data Table on Market opportunity by Application ($ million)
9 Market Segmentation by Type
- 9.1 Market segments
- Chart on Type - Market share 2023-2028 (%)
- Data Table on Type - Market share 2023-2028 (%)
- 9.2 Comparison by Type
- Chart on Comparison by Type
- Data Table on Comparison by Type
- 9.3 Performance enhancing additives - Market size and forecast 2023-2028
- Chart on Performance enhancing additives - Market size and forecast 2023-2028 ($ million)
- Data Table on Performance enhancing additives - Market size and forecast 2023-2028 ($ million)
- Chart on Performance enhancing additives - Year-over-year growth 2023-2028 (%)
- Data Table on Performance enhancing additives - Year-over-year growth 2023-2028 (%)
- 9.4 Surface protecting additives - Market size and forecast 2023-2028
- Chart on Surface protecting additives - Market size and forecast 2023-2028 ($ million)
- Data Table on Surface protecting additives - Market size and forecast 2023-2028 ($ million)
- Chart on Surface protecting additives - Year-over-year growth 2023-2028 (%)
- Data Table on Surface protecting additives - Year-over-year growth 2023-2028 (%)
- 9.5 Lubricant protecting additives - Market size and forecast 2023-2028
- Chart on Lubricant protecting additives - Market size and forecast 2023-2028 ($ million)
- Data Table on Lubricant protecting additives - Market size and forecast 2023-2028 ($ million)
- Chart on Lubricant protecting additives - Year-over-year growth 2023-2028 (%)
- Data Table on Lubricant protecting additives - Year-over-year growth 2023-2028 (%)
- 9.6 Market opportunity by Type
- Market opportunity by Type ($ million)
- Data Table on Market opportunity by Type ($ million)
10 Customer Landscape
- 10.1 Customer landscape overview
- Analysis of price sensitivity, lifecycle, customer purchase basket, adoption rates, and purchase criteria
11 Geographic Landscape
- 11.1 Geographic segmentation
- Chart on Market share By Geographical Landscape 2023-2028 (%)
- Data Table on Market share By Geographical Landscape 2023-2028 (%)
- 11.2 Geographic comparison
- Chart on Geographic comparison
- Data Table on Geographic comparison
- 11.3 APAC - Market size and forecast 2023-2028
- Chart on APAC - Market size and forecast 2023-2028 ($ million)
- Data Table on APAC - Market size and forecast 2023-2028 ($ million)
- Chart on APAC - Year-over-year growth 2023-2028 (%)
- Data Table on APAC - Year-over-year growth 2023-2028 (%)
- 11.4 Europe - Market size and forecast 2023-2028
- Chart on Europe - Market size and forecast 2023-2028 ($ million)
- Data Table on Europe - Market size and forecast 2023-2028 ($ million)
- Chart on Europe - Year-over-year growth 2023-2028 (%)
- Data Table on Europe - Year-over-year growth 2023-2028 (%)
- 11.5 North America - Market size and forecast 2023-2028
- Chart on North America - Market size and forecast 2023-2028 ($ million)
- Data Table on North America - Market size and forecast 2023-2028 ($ million)
- Chart on North America - Year-over-year growth 2023-2028 (%)
- Data Table on North America - Year-over-year growth 2023-2028 (%)
- 11.6 Middle East and Africa - Market size and forecast 2023-2028
- Chart on Middle East and Africa - Market size and forecast 2023-2028 ($ million)
- Data Table on Middle East and Africa - Market size and forecast 2023-2028 ($ million)
- Chart on Middle East and Africa - Year-over-year growth 2023-2028 (%)
- Data Table on Middle East and Africa - Year-over-year growth 2023-2028 (%)
- 11.7 South America - Market size and forecast 2023-2028
- Chart on South America - Market size and forecast 2023-2028 ($ million)
- Data Table on South America - Market size and forecast 2023-2028 ($ million)
- Chart on South America - Year-over-year growth 2023-2028 (%)
- Data Table on South America - Year-over-year growth 2023-2028 (%)
- 11.8 China - Market size and forecast 2023-2028
- Chart on China - Market size and forecast 2023-2028 ($ million)
- Data Table on China - Market size and forecast 2023-2028 ($ million)
- Chart on China - Year-over-year growth 2023-2028 (%)
- Data Table on China - Year-over-year growth 2023-2028 (%)
- 11.9 US - Market size and forecast 2023-2028
- Chart on US - Market size and forecast 2023-2028 ($ million)
- Data Table on US - Market size and forecast 2023-2028 ($ million)
- Chart on US - Year-over-year growth 2023-2028 (%)
- Data Table on US - Year-over-year growth 2023-2028 (%)
- 11.10 Japan - Market size and forecast 2023-2028
- Chart on Japan - Market size and forecast 2023-2028 ($ million)
- Data Table on Japan - Market size and forecast 2023-2028 ($ million)
- Chart on Japan - Year-over-year growth 2023-2028 (%)
- Data Table on Japan - Year-over-year growth 2023-2028 (%)
- 11.11 Germany - Market size and forecast 2023-2028
- Chart on Germany - Market size and forecast 2023-2028 ($ million)
- Data Table on Germany - Market size and forecast 2023-2028 ($ million)
- Chart on Germany - Year-over-year growth 2023-2028 (%)
- Data Table on Germany - Year-over-year growth 2023-2028 (%)
- 11.12 India - Market size and forecast 2023-2028
- Chart on India - Market size and forecast 2023-2028 ($ million)
- Data Table on India - Market size and forecast 2023-2028 ($ million)
- Chart on India - Year-over-year growth 2023-2028 (%)
- Data Table on India - Year-over-year growth 2023-2028 (%)
- 11.13 South Korea - Market size and forecast 2023-2028
- Chart on South Korea - Market size and forecast 2023-2028 ($ million)
- Data Table on South Korea - Market size and forecast 2023-2028 ($ million)
- Chart on South Korea - Year-over-year growth 2023-2028 (%)
- Data Table on South Korea - Year-over-year growth 2023-2028 (%)
- 11.14 Italy - Market size and forecast 2023-2028
- Chart on Italy - Market size and forecast 2023-2028 ($ million)
- Data Table on Italy - Market size and forecast 2023-2028 ($ million)
- Chart on Italy - Year-over-year growth 2023-2028 (%)
- Data Table on Italy - Year-over-year growth 2023-2028 (%)
- 11.15 France - Market size and forecast 2023-2028
- Chart on France - Market size and forecast 2023-2028 ($ million)
- Data Table on France - Market size and forecast 2023-2028 ($ million)
- Chart on France - Year-over-year growth 2023-2028 (%)
- Data Table on France - Year-over-year growth 2023-2028 (%)
- 11.16 UK - Market size and forecast 2023-2028
- Chart on UK - Market size and forecast 2023-2028 ($ million)
- Data Table on UK - Market size and forecast 2023-2028 ($ million)
- Chart on UK - Year-over-year growth 2023-2028 (%)
- Data Table on UK - Year-over-year growth 2023-2028 (%)
- 11.17 Indonesia - Market size and forecast 2023-2028
- Chart on Indonesia - Market size and forecast 2023-2028 ($ million)
- Data Table on Indonesia - Market size and forecast 2023-2028 ($ million)
- Chart on Indonesia - Year-over-year growth 2023-2028 (%)
- Data Table on Indonesia - Year-over-year growth 2023-2028 (%)
- 11.18 Market opportunity By Geographical Landscape
- Market opportunity By Geographical Landscape ($ million)
- Data Tables on Market opportunity By Geographical Landscape ($ million)
12 Drivers, Challenges, and Opportunity/Restraints
- 12.1 Market drivers
- 12.2 Market challenges
- 12.3 Impact of drivers and challenges
- Impact of drivers and challenges in 2023 and 2028
- 12.4 Market opportunities/restraints
13 Competitive Landscape
- 13.1 Overview
- 13.2 Competitive Landscape
- Overview on criticality of inputs and factors of differentiation
- 13.3 Landscape disruption
- Overview on factors of disruption
- 13.4 Industry risks
- Impact of key risks on business
14 Competitive Analysis
- 14.1 Companies profiled
- Companies covered
- 14.2 Company ranking index
- Company ranking index
- 14.3 Market positioning of companies
- Matrix on companies position and classification
- 14.4 Afton Chemical
- Afton Chemical - Overview
- Afton Chemical - Product / Service
- Afton Chemical - Key offerings
- SWOT
- 14.5 BASF SE
- BASF SE - Overview
- BASF SE - Business segments
- BASF SE - Key news
- BASF SE - Key offerings
- BASF SE - Segment focus
- SWOT
- 14.6 BRB International BV
- BRB International BV - Overview
- BRB International BV - Product / Service
- BRB International BV - Key offerings
- SWOT
- 14.7 Chevron Corp.
- Chevron Corp. - Overview
- Chevron Corp. - Business segments
- Chevron Corp. - Key news
- Chevron Corp. - Key offerings
- Chevron Corp. - Segment focus
- SWOT
- 14.8 Clariant AG
- Clariant AG - Overview
- Clariant AG - Business segments
- Clariant AG - Key news
- Clariant AG - Key offerings
- Clariant AG - Segment focus
- SWOT
- 14.9 DOG Deutsche Oelfabrik
- DOG Deutsche Oelfabrik - Overview
- DOG Deutsche Oelfabrik - Product / Service
- DOG Deutsche Oelfabrik - Key offerings
- SWOT
- 14.10 Dover Chemical Corp.
- Dover Chemical Corp. - Overview
- Dover Chemical Corp. - Product / Service
- Dover Chemical Corp. - Key offerings
- SWOT
- 14.11 Eni SpA
- Eni SpA - Overview
- Eni SpA - Business segments
- Eni SpA - Key news
- Eni SpA - Key offerings
- Eni SpA - Segment focus
- SWOT
- 14.12 Evonik Industries AG
- Evonik Industries AG - Overview
- Evonik Industries AG - Business segments
- Evonik Industries AG - Key news
- Evonik Industries AG - Key offerings
- Evonik Industries AG - Segment focus
- SWOT
- 14.13 Exxon Mobil Corp.
- Exxon Mobil Corp. - Overview
- Exxon Mobil Corp. - Product / Service
- Exxon Mobil Corp. - Key offerings
- SWOT
- 14.14 FUCHS PETROLUB SE
- FUCHS PETROLUB SE - Overview
- FUCHS PETROLUB SE - Business segments
- FUCHS PETROLUB SE - Key news
- FUCHS PETROLUB SE - Key offerings
- FUCHS PETROLUB SE - Segment focus
- SWOT
- 14.15 King Industries Inc.
- King Industries Inc. - Overview
- King Industries Inc. - Product / Service
- King Industries Inc. - Key offerings
- SWOT
- 14.16 Lanxess AG
- Lanxess AG - Overview
- Lanxess AG - Business segments
- Lanxess AG - Key news
- Lanxess AG - Key offerings
- Lanxess AG - Segment focus
- SWOT
- 14.17 The Lubrizol Corp.
- The Lubrizol Corp. - Overview
- The Lubrizol Corp. - Product / Service
- The Lubrizol Corp. - Key offerings
- SWOT
- 14.18 Wuxi Southern Petroleum Additives Co. Ltd.
- Wuxi Southern Petroleum Additives Co. Ltd. - Overview
- Wuxi Southern Petroleum Additives Co. Ltd. - Product / Service
- Wuxi Southern Petroleum Additives Co. Ltd. - Key offerings
- SWOT
15 Appendix
- 15.1 Scope of the report
- 15.2 Inclusions and exclusions checklist
- Inclusions checklist
- Exclusions checklist
- 15.3 Currency conversion rates for US$
- Currency conversion rates for US$
- 15.4 Research methodology
- Research methodology
- 15.5 Data procurement
- Information sources
- 15.6 Data validation
- Data validation
- 15.7 Validation techniques employed for market sizing
- Validation techniques employed for market sizing
- 15.8 Data synthesis
- Data synthesis
- 15.9 360 degree market analysis
- 360 degree market analysis
- 15.10 List of abbreviations
- List of abbreviations
