|
|
市場調査レポート
商品コード
1559444
RNAベースの治療薬の世界市場、2024~2028年Global RNA Based Therapeutics Market 2024-2028 |
||||||

|
|||||||
カスタマイズ可能
|
|||||||

| RNAベースの治療薬の世界市場、2024~2028年 |
|
出版日: 2024年08月27日
発行: TechNavio
ページ情報: 英文 208 Pages
納期: 即納可能
|

全表示
- 概要
- 図表
- 目次
RNAベースの治療薬市場、2024~2028年
RNAベースの治療薬市場は2023~2028年に12億6,820万米ドル、予測期間中のCAGRは5.54%で成長すると予測されます。当レポートでは、RNAベースの治療薬市場の全体的な分析、市場規模・予測、動向、成長促進要因、課題、約25のベンダーを網羅したベンダー分析などを掲載しています。
現在の市場シナリオ、最新動向と促進要因、市場環境全体に関する最新分析を提供しています。市場は、RNAベースの治療薬への投資や資金調達の増加、政府認可によるRNAベースの治療薬の拡大、慢性疾患や感染症の罹患率の上昇などが牽引しています。
| 市場範囲 | |
|---|---|
| 基準年 | 2024年 |
| 終了年 | 2028年 |
| 予測期間 | 2024~2028年 |
| 成長モメンタム | 加速 |
| 前年比[2024年] | 5.12% |
| CAGR | 5.54% |
| 増分額 | 12億6,820万米ドル |
本調査では、今後数年間のRNAベースの治療薬市場の成長を促進する主要理由の1つとして、共同研究やパートナーシップの増加を挙げています。また、遺伝子編集技術の市場開拓やドラッグデリバリーシステムの進歩は、市場の大きな需要につながります。
目次
第1章 エグゼクティブサマリー
- 市場概要
第2章 Technavio分析
- 価格・ライフサイクル・顧客購入バスケット・採用率・購入基準の分析
- インプットの重要性と差別化の要因
- 混乱の要因
- 促進要因と課題の影響
第3章 市場情勢
- 市場エコシステム
- 市場の特徴
- バリューチェーン分析
第4章 市場規模の評価
- 市場の定義
- 市場セグメント分析
- 市場規模 2023年
- 市場の展望 2023~2028年
第5章 市場規模実績
- RNAベースの治療薬の世界市場 2018~2022年
- タイプ別セグメント分析 2018~2022年
- 投与経路別セグメント分析 2018~2022年
- 地域別セグメント分析 2018~2022年
- 国別セグメント分析 2018~2022年
第6章 定性分析
- AIの影響-RNAベースの治療薬の世界市場
第7章 ファイブフォース分析
- ファイブフォースの要約
- 買い手の交渉力
- 供給企業の交渉力
- 新規参入業者の脅威
- 代替品の脅威
- 競争の脅威
- 市況
第8章 市場セグメンテーション:タイプ別
- 市場セグメンテーション
- 比較:タイプ別
- mRNA治療薬:市場規模と予測 2023~2028年
- アンチセンスオリゴヌクレオチド(ASO)治療薬:市場規模と予測 2023~2028年
- RNA干渉(RNAi)治療薬:市場規模と予測 2023~2028年
- その他:市場規模と予測 2023~2028年
- 市場機会:タイプ別
第9章 市場セグメンテーション:投与経路別
- 市場セグメンテーション
- 比較:投与経路別
- 静脈内(IV):市場規模と予測 2023~2028年
- 皮下(SC):市場規模と予測 2023~2028年
- 筋肉内(IM):市場規模と予測 2023~2028年
- 市場機会:投与経路別
第10章 顧客情勢
- 顧客情勢概要
第11章 地域別情勢
- 地域別セグメンテーション
- 比較:地域別
- 欧州:市場規模と予測 2023~2028年
- 北米:市場規模と予測 2023~2028年
- アジア:市場規模と予測 2023~2028年
- その他:市場規模と予測 2023~2028年
- 米国:市場規模と予測 2023~2028年
- 中国:市場規模と予測 2023~2028年
- ドイツ:市場規模と予測 2023~2028年
- 英国:市場規模と予測 2023~2028年
- 日本:市場規模と予測 2023~2028年
- フランス:市場規模と予測 2023~2028年
- イタリア:市場規模と予測 2023~2028年
- インド:市場規模と予測 2023~2028年
- カナダ:市場規模と予測 2023~2028年
- シンガポール:市場規模と予測 2023~2028年
- 市場機会:地域情勢別
第12章 促進要因・課題・機会・抑制要因
- 市場促進要因
- 市場課題
- 促進要因と課題の影響
- 市場の機会・抑制要因
第13章 競合情勢
- 概要
- 競合情勢
- 混乱の状況
- 業界のリスク
第14章 競合分析
- 企業プロファイル
- 企業ランキング指数
- 企業の市場ポジショニング
- Alnylam Pharmaceuticals Inc.
- Arbutus Biopharma Corp.
- Arcturus Therapeutics Holdings Inc.
- Arrowhead Pharmaceuticals Inc.
- AstraZeneca Plc
- Benitec Biopharma Inc.
- Biogen Inc.
- BioNTech SE
- CureVac AG
- Gennova Biopharmaceuticals Ltd
- Ionis Pharmaceuticals Inc.
- Moderna Inc.
- Novo Nordisk AS
- Sarepta Therapeutics Inc.
- Silence Therapeutics plc
第15章 付録
Exhibits:
- Exhibits1: Executive Summary - Chart on Market Overview
- Exhibits2: Executive Summary - Data Table on Market Overview
- Exhibits3: Executive Summary - Chart on Global Market Characteristics
- Exhibits4: Executive Summary - Chart on Market By Geographical Landscape
- Exhibits5: Executive Summary - Chart on Market Segmentation by Type
- Exhibits6: Executive Summary - Chart on Market Segmentation by Route of Administration
- Exhibits7: Executive Summary - Chart on Incremental Growth
- Exhibits8: Executive Summary - Data Table on Incremental Growth
- Exhibits9: Executive Summary - Chart on Company Market Positioning
- Exhibits10: Analysis of price sensitivity, lifecycle, customer purchase basket, adoption rates, and purchase criteria
- Exhibits11: Overview on criticality of inputs and factors of differentiation
- Exhibits12: Overview on factors of disruption
- Exhibits13: Impact of drivers and challenges in 2023 and 2028
- Exhibits14: Parent Market
- Exhibits15: Data Table on - Parent Market
- Exhibits16: Market characteristics analysis
- Exhibits17: Value Chain Analysis
- Exhibits18: Offerings of companies included in the market definition
- Exhibits19: Market segments
- Exhibits20: Chart on Global - Market size and forecast 2023-2028 ($ million)
- Exhibits21: Data Table on Global - Market size and forecast 2023-2028 ($ million)
- Exhibits22: Chart on Global Market: Year-over-year growth 2023-2028 (%)
- Exhibits23: Data Table on Global Market: Year-over-year growth 2023-2028 (%)
- Exhibits24: Historic Market Size - Data Table on Global RNA Based Therapeutics Market 2018 - 2022 ($ million)
- Exhibits25: Historic Market Size - Type Segment 2018 - 2022 ($ million)
- Exhibits26: Historic Market Size - Route of Administration Segment 2018 - 2022 ($ million)
- Exhibits27: Historic Market Size - Geography Segment 2018 - 2022 ($ million)
- Exhibits28: Historic Market Size - Country Segment 2018 - 2022 ($ million)
- Exhibits29: Five forces analysis - Comparison between 2023 and 2028
- Exhibits30: Bargaining power of buyers - Impact of key factors 2023 and 2028
- Exhibits31: Bargaining power of suppliers - Impact of key factors in 2023 and 2028
- Exhibits32: Threat of new entrants - Impact of key factors in 2023 and 2028
- Exhibits33: Threat of substitutes - Impact of key factors in 2023 and 2028
- Exhibits34: Threat of rivalry - Impact of key factors in 2023 and 2028
- Exhibits35: Chart on Market condition - Five forces 2023 and 2028
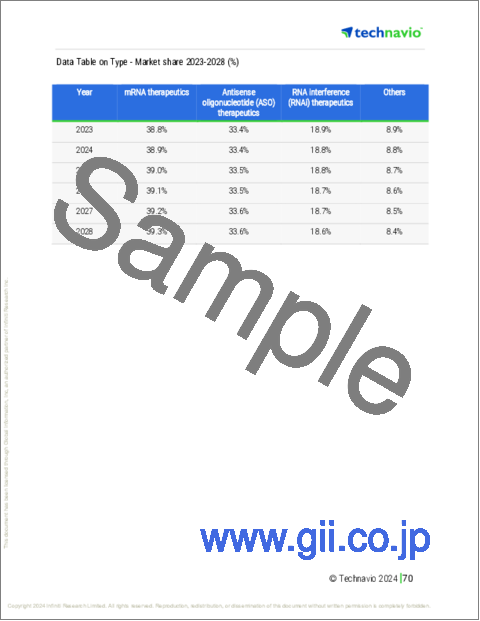
- Exhibits36: Chart on Type - Market share 2023-2028 (%)
- Exhibits37: Data Table on Type - Market share 2023-2028 (%)
- Exhibits38: Chart on Comparison by Type
- Exhibits39: Data Table on Comparison by Type
- Exhibits40: Chart on mRNA therapeutics - Market size and forecast 2023-2028 ($ million)
- Exhibits41: Data Table on mRNA therapeutics - Market size and forecast 2023-2028 ($ million)
- Exhibits42: Chart on mRNA therapeutics - Year-over-year growth 2023-2028 (%)
- Exhibits43: Data Table on mRNA therapeutics - Year-over-year growth 2023-2028 (%)
- Exhibits44: Chart on Antisense oligonucleotide (ASO) therapeutics - Market size and forecast 2023-2028 ($ million)
- Exhibits45: Data Table on Antisense oligonucleotide (ASO) therapeutics - Market size and forecast 2023-2028 ($ million)
- Exhibits46: Chart on Antisense oligonucleotide (ASO) therapeutics - Year-over-year growth 2023-2028 (%)
- Exhibits47: Data Table on Antisense oligonucleotide (ASO) therapeutics - Year-over-year growth 2023-2028 (%)
- Exhibits48: Chart on RNA interference (RNAi) therapeutics - Market size and forecast 2023-2028 ($ million)
- Exhibits49: Data Table on RNA interference (RNAi) therapeutics - Market size and forecast 2023-2028 ($ million)
- Exhibits50: Chart on RNA interference (RNAi) therapeutics - Year-over-year growth 2023-2028 (%)
- Exhibits51: Data Table on RNA interference (RNAi) therapeutics - Year-over-year growth 2023-2028 (%)
- Exhibits52: Chart on Others - Market size and forecast 2023-2028 ($ million)
- Exhibits53: Data Table on Others - Market size and forecast 2023-2028 ($ million)
- Exhibits54: Chart on Others - Year-over-year growth 2023-2028 (%)
- Exhibits55: Data Table on Others - Year-over-year growth 2023-2028 (%)
- Exhibits56: Market opportunity by Type ($ million)
- Exhibits57: Data Table on Market opportunity by Type ($ million)
- Exhibits58: Chart on Route of Administration - Market share 2023-2028 (%)
- Exhibits59: Data Table on Route of Administration - Market share 2023-2028 (%)
- Exhibits60: Chart on Comparison by Route of Administration
- Exhibits61: Data Table on Comparison by Route of Administration
- Exhibits62: Chart on Intravenous (IV) - Market size and forecast 2023-2028 ($ million)
- Exhibits63: Data Table on Intravenous (IV) - Market size and forecast 2023-2028 ($ million)
- Exhibits64: Chart on Intravenous (IV) - Year-over-year growth 2023-2028 (%)
- Exhibits65: Data Table on Intravenous (IV) - Year-over-year growth 2023-2028 (%)
- Exhibits66: Chart on Subcutaneous (SC) - Market size and forecast 2023-2028 ($ million)
- Exhibits67: Data Table on Subcutaneous (SC) - Market size and forecast 2023-2028 ($ million)
- Exhibits68: Chart on Subcutaneous (SC) - Year-over-year growth 2023-2028 (%)
- Exhibits69: Data Table on Subcutaneous (SC) - Year-over-year growth 2023-2028 (%)
- Exhibits70: Chart on Intramuscular (IM) - Market size and forecast 2023-2028 ($ million)
- Exhibits71: Data Table on Intramuscular (IM) - Market size and forecast 2023-2028 ($ million)
- Exhibits72: Chart on Intramuscular (IM) - Year-over-year growth 2023-2028 (%)
- Exhibits73: Data Table on Intramuscular (IM) - Year-over-year growth 2023-2028 (%)
- Exhibits74: Market opportunity by Route of Administration ($ million)
- Exhibits75: Data Table on Market opportunity by Route of Administration ($ million)
- Exhibits76: Analysis of price sensitivity, lifecycle, customer purchase basket, adoption rates, and purchase criteria
- Exhibits77: Chart on Market share By Geographical Landscape 2023-2028 (%)
- Exhibits78: Data Table on Market share By Geographical Landscape 2023-2028 (%)
- Exhibits79: Chart on Geographic comparison
- Exhibits80: Data Table on Geographic comparison
- Exhibits81: Chart on Europe - Market size and forecast 2023-2028 ($ million)
- Exhibits82: Data Table on Europe - Market size and forecast 2023-2028 ($ million)
- Exhibits83: Chart on Europe - Year-over-year growth 2023-2028 (%)
- Exhibits84: Data Table on Europe - Year-over-year growth 2023-2028 (%)
- Exhibits85: Chart on North America - Market size and forecast 2023-2028 ($ million)
- Exhibits86: Data Table on North America - Market size and forecast 2023-2028 ($ million)
- Exhibits87: Chart on North America - Year-over-year growth 2023-2028 (%)
- Exhibits88: Data Table on North America - Year-over-year growth 2023-2028 (%)
- Exhibits89: Chart on Asia - Market size and forecast 2023-2028 ($ million)
- Exhibits90: Data Table on Asia - Market size and forecast 2023-2028 ($ million)
- Exhibits91: Chart on Asia - Year-over-year growth 2023-2028 (%)
- Exhibits92: Data Table on Asia - Year-over-year growth 2023-2028 (%)
- Exhibits93: Chart on Rest of World (ROW) - Market size and forecast 2023-2028 ($ million)
- Exhibits94: Data Table on Rest of World (ROW) - Market size and forecast 2023-2028 ($ million)
- Exhibits95: Chart on Rest of World (ROW) - Year-over-year growth 2023-2028 (%)
- Exhibits96: Data Table on Rest of World (ROW) - Year-over-year growth 2023-2028 (%)
- Exhibits97: Chart on US - Market size and forecast 2023-2028 ($ million)
- Exhibits98: Data Table on US - Market size and forecast 2023-2028 ($ million)
- Exhibits99: Chart on US - Year-over-year growth 2023-2028 (%)
- Exhibits100: Data Table on US - Year-over-year growth 2023-2028 (%)
- Exhibits101: Chart on China - Market size and forecast 2023-2028 ($ million)
- Exhibits102: Data Table on China - Market size and forecast 2023-2028 ($ million)
- Exhibits103: Chart on China - Year-over-year growth 2023-2028 (%)
- Exhibits104: Data Table on China - Year-over-year growth 2023-2028 (%)
- Exhibits105: Chart on Germany - Market size and forecast 2023-2028 ($ million)
- Exhibits106: Data Table on Germany - Market size and forecast 2023-2028 ($ million)
- Exhibits107: Chart on Germany - Year-over-year growth 2023-2028 (%)
- Exhibits108: Data Table on Germany - Year-over-year growth 2023-2028 (%)
- Exhibits109: Chart on UK - Market size and forecast 2023-2028 ($ million)
- Exhibits110: Data Table on UK - Market size and forecast 2023-2028 ($ million)
- Exhibits111: Chart on UK - Year-over-year growth 2023-2028 (%)
- Exhibits112: Data Table on UK - Year-over-year growth 2023-2028 (%)
- Exhibits113: Chart on Japan - Market size and forecast 2023-2028 ($ million)
- Exhibits114: Data Table on Japan - Market size and forecast 2023-2028 ($ million)
- Exhibits115: Chart on Japan - Year-over-year growth 2023-2028 (%)
- Exhibits116: Data Table on Japan - Year-over-year growth 2023-2028 (%)
- Exhibits117: Chart on France - Market size and forecast 2023-2028 ($ million)
- Exhibits118: Data Table on France - Market size and forecast 2023-2028 ($ million)
- Exhibits119: Chart on France - Year-over-year growth 2023-2028 (%)
- Exhibits120: Data Table on France - Year-over-year growth 2023-2028 (%)
- Exhibits121: Chart on Italy - Market size and forecast 2023-2028 ($ million)
- Exhibits122: Data Table on Italy - Market size and forecast 2023-2028 ($ million)
- Exhibits123: Chart on Italy - Year-over-year growth 2023-2028 (%)
- Exhibits124: Data Table on Italy - Year-over-year growth 2023-2028 (%)
- Exhibits125: Chart on India - Market size and forecast 2023-2028 ($ million)
- Exhibits126: Data Table on India - Market size and forecast 2023-2028 ($ million)
- Exhibits127: Chart on India - Year-over-year growth 2023-2028 (%)
- Exhibits128: Data Table on India - Year-over-year growth 2023-2028 (%)
- Exhibits129: Chart on Canada - Market size and forecast 2023-2028 ($ million)
- Exhibits130: Data Table on Canada - Market size and forecast 2023-2028 ($ million)
- Exhibits131: Chart on Canada - Year-over-year growth 2023-2028 (%)
- Exhibits132: Data Table on Canada - Year-over-year growth 2023-2028 (%)
- Exhibits133: Chart on Singapore - Market size and forecast 2023-2028 ($ million)
- Exhibits134: Data Table on Singapore - Market size and forecast 2023-2028 ($ million)
- Exhibits135: Chart on Singapore - Year-over-year growth 2023-2028 (%)
- Exhibits136: Data Table on Singapore - Year-over-year growth 2023-2028 (%)
- Exhibits137: Market opportunity By Geographical Landscape ($ million)
- Exhibits138: Data Tables on Market opportunity By Geographical Landscape ($ million)
- Exhibits139: Impact of drivers and challenges in 2023 and 2028
- Exhibits140: Overview on criticality of inputs and factors of differentiation
- Exhibits141: Overview on factors of disruption
- Exhibits142: Impact of key risks on business
- Exhibits143: Companies covered
- Exhibits144: Company ranking index
- Exhibits145: Matrix on companies position and classification
- Exhibits146: Alnylam Pharmaceuticals Inc. - Overview
- Exhibits147: Alnylam Pharmaceuticals Inc. - Product / Service
- Exhibits148: Alnylam Pharmaceuticals Inc. - Key offerings
- Exhibits149: SWOT
- Exhibits150: Arbutus Biopharma Corp. - Overview
- Exhibits151: Arbutus Biopharma Corp. - Product / Service
- Exhibits152: Arbutus Biopharma Corp. - Key offerings
- Exhibits153: SWOT
- Exhibits154: Arcturus Therapeutics Holdings Inc. - Overview
- Exhibits155: Arcturus Therapeutics Holdings Inc. - Product / Service
- Exhibits156: Arcturus Therapeutics Holdings Inc. - Key offerings
- Exhibits157: SWOT
- Exhibits158: Arrowhead Pharmaceuticals Inc. - Overview
- Exhibits159: Arrowhead Pharmaceuticals Inc. - Product / Service
- Exhibits160: Arrowhead Pharmaceuticals Inc. - Key offerings
- Exhibits161: SWOT
- Exhibits162: AstraZeneca Plc - Overview
- Exhibits163: AstraZeneca Plc - Product / Service
- Exhibits164: AstraZeneca Plc - Key news
- Exhibits165: AstraZeneca Plc - Key offerings
- Exhibits166: SWOT
- Exhibits167: Benitec Biopharma Inc. - Overview
- Exhibits168: Benitec Biopharma Inc. - Product / Service
- Exhibits169: Benitec Biopharma Inc. - Key offerings
- Exhibits170: SWOT
- Exhibits171: Biogen Inc. - Overview
- Exhibits172: Biogen Inc. - Product / Service
- Exhibits173: Biogen Inc. - Key news
- Exhibits174: Biogen Inc. - Key offerings
- Exhibits175: SWOT
- Exhibits176: BioNTech SE - Overview
- Exhibits177: BioNTech SE - Product / Service
- Exhibits178: BioNTech SE - Key offerings
- Exhibits179: SWOT
- Exhibits180: CureVac AG - Overview
- Exhibits181: CureVac AG - Product / Service
- Exhibits182: CureVac AG - Key offerings
- Exhibits183: SWOT
- Exhibits184: Gennova Biopharmaceuticals Ltd - Overview
- Exhibits185: Gennova Biopharmaceuticals Ltd - Product / Service
- Exhibits186: Gennova Biopharmaceuticals Ltd - Key offerings
- Exhibits187: SWOT
- Exhibits188: Ionis Pharmaceuticals Inc. - Overview
- Exhibits189: Ionis Pharmaceuticals Inc. - Product / Service
- Exhibits190: Ionis Pharmaceuticals Inc. - Key news
- Exhibits191: Ionis Pharmaceuticals Inc. - Key offerings
- Exhibits192: SWOT
- Exhibits193: Moderna Inc. - Overview
- Exhibits194: Moderna Inc. - Product / Service
- Exhibits195: Moderna Inc. - Key offerings
- Exhibits196: SWOT
- Exhibits197: Novo Nordisk AS - Overview
- Exhibits198: Novo Nordisk AS - Business segments
- Exhibits199: Novo Nordisk AS - Key news
- Exhibits200: Novo Nordisk AS - Key offerings
- Exhibits201: Novo Nordisk AS - Segment focus
- Exhibits202: SWOT
- Exhibits203: Sarepta Therapeutics Inc. - Overview
- Exhibits204: Sarepta Therapeutics Inc. - Product / Service
- Exhibits205: Sarepta Therapeutics Inc. - Key offerings
- Exhibits206: SWOT
- Exhibits207: Silence Therapeutics plc - Overview
- Exhibits208: Silence Therapeutics plc - Product / Service
- Exhibits209: Silence Therapeutics plc - Key offerings
- Exhibits210: SWOT
- Exhibits211: Inclusions checklist
- Exhibits212: Exclusions checklist
- Exhibits213: Currency conversion rates for US$
- Exhibits214: Research methodology
- Exhibits215: Information sources
- Exhibits216: Data validation
- Exhibits217: Validation techniques employed for market sizing
- Exhibits218: Data synthesis
- Exhibits219: 360 degree market analysis
- Exhibits220: List of abbreviations
RNA Based Therapeutics Market 2024-2028
The RNA based therapeutics market is forecasted to grow by USD 1268.2 mn during 2023-2028, accelerating at a CAGR of 5.54% during the forecast period. The report on the RNA based therapeutics market provides a holistic analysis, market size and forecast, trends, growth drivers, and challenges, as well as vendor analysis covering around 25 vendors.
The report offers an up-to-date analysis regarding the current market scenario, the latest trends and drivers, and the overall market environment. The market is driven by growing investment and funding in RNA based therapeutics, expansion of RNA based therapeutics through government authorization, and rising incidence of chronic and infectious diseases.
| Market Scope | |
|---|---|
| Base Year | 2024 |
| End Year | 2028 |
| Series Year | 2024-2028 |
| Growth Momentum | Accelerate |
| YOY 2024 | 5.12% |
| CAGR | 5.54% |
| Incremental Value | $1268.2 mn |
Technavio's RNA based therapeutics market is segmented as below:
By Type
- mRNA therapeutics
- Antisense oligonucleotide (ASO) therapeutics
- RNA interference (RNAi) therapeutics
- Others
By Route Of Administration
- Intravenous (IV)
- Subcutaneous (SC)
- Intramuscular (IM)
By Geographical Landscape
- Europe
- North America
- Asia
- Rest of World (ROW)
This study identifies the increasing collaborations and partnerships as one of the prime reasons driving the RNA based therapeutics market growth during the next few years. Also, developments in gene editing technologies and advancements in drug delivery systems will lead to sizable demand in the market.
The report on the RNA based therapeutics market covers the following areas:
- RNA based therapeutics market sizing
- RNA based therapeutics market forecast
- RNA based therapeutics market industry analysis
The vendors analysis is designed to help clients improve their market position, and in line with this, this report provides a detailed analysis of several leading RNA based therapeutics market vendors that include Alnylam Pharmaceuticals Inc., Arbutus Biopharma Corp., Arcturus Therapeutics Holdings Inc., Arrowhead Pharmaceuticals Inc., Ascidian Therapeutics Inc, AstraZeneca PLC, Beam Therapeutics Inc., Benitec Biopharma Inc., Biogen Inc., BioNTech SE, BioSpace, Circular Genomics Inc., CureVac AG, Esperovax, Gennova Biopharmaceuticals Ltd, Ionis Pharmaceuticals Inc., Moderna Inc., Novartis AG, Novo Nordisk AS, Omega Therapeutics Inc., Sarepta Therapeutics Inc., Silence Therapeutics PLC, and Tevard Biosciences. Also, the RNA based therapeutics market analysis report includes information on upcoming trends and challenges that will influence market growth. This is to help companies strategize and leverage all forthcoming growth opportunities.
The study was conducted using an objective combination of primary and secondary information including inputs from key participants in the industry. The report contains a comprehensive market and vendor landscape in addition to an analysis of the key vendors.
The publisher presents a detailed picture of the market by the way of study, synthesis, and summation of data from multiple sources by an analysis of key parameters such as profit, pricing, competition, and promotions. It presents various market facets by identifying the key industry influencers. The data presented is comprehensive, reliable, and a result of extensive research - both primary and secondary. The market research reports provide a complete competitive landscape and an in-depth vendor selection methodology and analysis using qualitative and quantitative research to forecast the accurate market growth.
Table of Contents
1 Executive Summary
- 1.1 Market overview
- Executive Summary - Chart on Market Overview
- Executive Summary - Data Table on Market Overview
- Executive Summary - Chart on Global Market Characteristics
- Executive Summary - Chart on Market By Geographical Landscape
- Executive Summary - Chart on Market Segmentation by Type
- Executive Summary - Chart on Market Segmentation by Route of Administration
- Executive Summary - Chart on Incremental Growth
- Executive Summary - Data Table on Incremental Growth
- Executive Summary - Chart on Company Market Positioning
2 Technavio Analysis
- 2.1 Analysis of price sensitivity, lifecycle, customer purchase basket, adoption rates, and purchase criteria
- Analysis of price sensitivity, lifecycle, customer purchase basket, adoption rates, and purchase criteria
- 2.2 Criticality of inputs and Factors of differentiation
- Overview on criticality of inputs and factors of differentiation
- 2.3 Factors of disruption
- Overview on factors of disruption
- 2.4 Impact of drivers and challenges
- Impact of drivers and challenges in 2023 and 2028
3 Market Landscape
- 3.1 Market ecosystem
- Parent Market
- Data Table on - Parent Market
- 3.2 Market characteristics
- Market characteristics analysis
- 3.3 Value chain analysis
- Value Chain Analysis
4 Market Sizing
- 4.1 Market definition
- Offerings of companies included in the market definition
- 4.2 Market segment analysis
- Market segments
- 4.3 Market size 2023
- 4.4 Market outlook: Forecast for 2023-2028
- Chart on Global - Market size and forecast 2023-2028 ($ million)
- Data Table on Global - Market size and forecast 2023-2028 ($ million)
- Chart on Global Market: Year-over-year growth 2023-2028 (%)
- Data Table on Global Market: Year-over-year growth 2023-2028 (%)
5 Historic Market Size
- 5.1 Global RNA Based Therapeutics Market 2018 - 2022
- Historic Market Size - Data Table on Global RNA Based Therapeutics Market 2018 - 2022 ($ million)
- 5.2 Type segment analysis 2018 - 2022
- Historic Market Size - Type Segment 2018 - 2022 ($ million)
- 5.3 Route of Administration segment analysis 2018 - 2022
- Historic Market Size - Route of Administration Segment 2018 - 2022 ($ million)
- 5.4 Geography segment analysis 2018 - 2022
- Historic Market Size - Geography Segment 2018 - 2022 ($ million)
- 5.5 Country segment analysis 2018 - 2022
- Historic Market Size - Country Segment 2018 - 2022 ($ million)
6 Qualitative Analysis
- 6.1 Impact of AI on the Global RNA Based Therapeutics Market
7 Five Forces Analysis
- 7.1 Five forces summary
- Five forces analysis - Comparison between 2023 and 2028
- 7.2 Bargaining power of buyers
- Bargaining power of buyers - Impact of key factors 2023 and 2028
- 7.3 Bargaining power of suppliers
- Bargaining power of suppliers - Impact of key factors in 2023 and 2028
- 7.4 Threat of new entrants
- Threat of new entrants - Impact of key factors in 2023 and 2028
- 7.5 Threat of substitutes
- Threat of substitutes - Impact of key factors in 2023 and 2028
- 7.6 Threat of rivalry
- Threat of rivalry - Impact of key factors in 2023 and 2028
- 7.7 Market condition
- Chart on Market condition - Five forces 2023 and 2028
8 Market Segmentation by Type
- 8.1 Market segments
- Chart on Type - Market share 2023-2028 (%)
- Data Table on Type - Market share 2023-2028 (%)
- 8.2 Comparison by Type
- Chart on Comparison by Type
- Data Table on Comparison by Type
- 8.3 mRNA therapeutics - Market size and forecast 2023-2028
- Chart on mRNA therapeutics - Market size and forecast 2023-2028 ($ million)
- Data Table on mRNA therapeutics - Market size and forecast 2023-2028 ($ million)
- Chart on mRNA therapeutics - Year-over-year growth 2023-2028 (%)
- Data Table on mRNA therapeutics - Year-over-year growth 2023-2028 (%)
- 8.4 Antisense oligonucleotide (ASO) therapeutics - Market size and forecast 2023-2028
- Chart on Antisense oligonucleotide (ASO) therapeutics - Market size and forecast 2023-2028 ($ million)
- Data Table on Antisense oligonucleotide (ASO) therapeutics - Market size and forecast 2023-2028 ($ million)
- Chart on Antisense oligonucleotide (ASO) therapeutics - Year-over-year growth 2023-2028 (%)
- Data Table on Antisense oligonucleotide (ASO) therapeutics - Year-over-year growth 2023-2028 (%)
- 8.5 RNA interference (RNAi) therapeutics - Market size and forecast 2023-2028
- Chart on RNA interference (RNAi) therapeutics - Market size and forecast 2023-2028 ($ million)
- Data Table on RNA interference (RNAi) therapeutics - Market size and forecast 2023-2028 ($ million)
- Chart on RNA interference (RNAi) therapeutics - Year-over-year growth 2023-2028 (%)
- Data Table on RNA interference (RNAi) therapeutics - Year-over-year growth 2023-2028 (%)
- 8.6 Others - Market size and forecast 2023-2028
- Chart on Others - Market size and forecast 2023-2028 ($ million)
- Data Table on Others - Market size and forecast 2023-2028 ($ million)
- Chart on Others - Year-over-year growth 2023-2028 (%)
- Data Table on Others - Year-over-year growth 2023-2028 (%)
- 8.7 Market opportunity by Type
- Market opportunity by Type ($ million)
- Data Table on Market opportunity by Type ($ million)
9 Market Segmentation by Route of Administration
- 9.1 Market segments
- Chart on Route of Administration - Market share 2023-2028 (%)
- Data Table on Route of Administration - Market share 2023-2028 (%)
- 9.2 Comparison by Route of Administration
- Chart on Comparison by Route of Administration
- Data Table on Comparison by Route of Administration
- 9.3 Intravenous (IV) - Market size and forecast 2023-2028
- Chart on Intravenous (IV) - Market size and forecast 2023-2028 ($ million)
- Data Table on Intravenous (IV) - Market size and forecast 2023-2028 ($ million)
- Chart on Intravenous (IV) - Year-over-year growth 2023-2028 (%)
- Data Table on Intravenous (IV) - Year-over-year growth 2023-2028 (%)
- 9.4 Subcutaneous (SC) - Market size and forecast 2023-2028
- Chart on Subcutaneous (SC) - Market size and forecast 2023-2028 ($ million)
- Data Table on Subcutaneous (SC) - Market size and forecast 2023-2028 ($ million)
- Chart on Subcutaneous (SC) - Year-over-year growth 2023-2028 (%)
- Data Table on Subcutaneous (SC) - Year-over-year growth 2023-2028 (%)
- 9.5 Intramuscular (IM) - Market size and forecast 2023-2028
- Chart on Intramuscular (IM) - Market size and forecast 2023-2028 ($ million)
- Data Table on Intramuscular (IM) - Market size and forecast 2023-2028 ($ million)
- Chart on Intramuscular (IM) - Year-over-year growth 2023-2028 (%)
- Data Table on Intramuscular (IM) - Year-over-year growth 2023-2028 (%)
- 9.6 Market opportunity by Route of Administration
- Market opportunity by Route of Administration ($ million)
- Data Table on Market opportunity by Route of Administration ($ million)
10 Customer Landscape
- 10.1 Customer landscape overview
- Analysis of price sensitivity, lifecycle, customer purchase basket, adoption rates, and purchase criteria
11 Geographic Landscape
- 11.1 Geographic segmentation
- Chart on Market share By Geographical Landscape 2023-2028 (%)
- Data Table on Market share By Geographical Landscape 2023-2028 (%)
- 11.2 Geographic comparison
- Chart on Geographic comparison
- Data Table on Geographic comparison
- 11.3 Europe - Market size and forecast 2023-2028
- Chart on Europe - Market size and forecast 2023-2028 ($ million)
- Data Table on Europe - Market size and forecast 2023-2028 ($ million)
- Chart on Europe - Year-over-year growth 2023-2028 (%)
- Data Table on Europe - Year-over-year growth 2023-2028 (%)
- 11.4 North America - Market size and forecast 2023-2028
- Chart on North America - Market size and forecast 2023-2028 ($ million)
- Data Table on North America - Market size and forecast 2023-2028 ($ million)
- Chart on North America - Year-over-year growth 2023-2028 (%)
- Data Table on North America - Year-over-year growth 2023-2028 (%)
- 11.5 Asia - Market size and forecast 2023-2028
- Chart on Asia - Market size and forecast 2023-2028 ($ million)
- Data Table on Asia - Market size and forecast 2023-2028 ($ million)
- Chart on Asia - Year-over-year growth 2023-2028 (%)
- Data Table on Asia - Year-over-year growth 2023-2028 (%)
- 11.6 Rest of World (ROW) - Market size and forecast 2023-2028
- Chart on Rest of World (ROW) - Market size and forecast 2023-2028 ($ million)
- Data Table on Rest of World (ROW) - Market size and forecast 2023-2028 ($ million)
- Chart on Rest of World (ROW) - Year-over-year growth 2023-2028 (%)
- Data Table on Rest of World (ROW) - Year-over-year growth 2023-2028 (%)
- 11.7 US - Market size and forecast 2023-2028
- Chart on US - Market size and forecast 2023-2028 ($ million)
- Data Table on US - Market size and forecast 2023-2028 ($ million)
- Chart on US - Year-over-year growth 2023-2028 (%)
- Data Table on US - Year-over-year growth 2023-2028 (%)
- 11.8 China - Market size and forecast 2023-2028
- Chart on China - Market size and forecast 2023-2028 ($ million)
- Data Table on China - Market size and forecast 2023-2028 ($ million)
- Chart on China - Year-over-year growth 2023-2028 (%)
- Data Table on China - Year-over-year growth 2023-2028 (%)
- 11.9 Germany - Market size and forecast 2023-2028
- Chart on Germany - Market size and forecast 2023-2028 ($ million)
- Data Table on Germany - Market size and forecast 2023-2028 ($ million)
- Chart on Germany - Year-over-year growth 2023-2028 (%)
- Data Table on Germany - Year-over-year growth 2023-2028 (%)
- 11.10 UK - Market size and forecast 2023-2028
- Chart on UK - Market size and forecast 2023-2028 ($ million)
- Data Table on UK - Market size and forecast 2023-2028 ($ million)
- Chart on UK - Year-over-year growth 2023-2028 (%)
- Data Table on UK - Year-over-year growth 2023-2028 (%)
- 11.11 Japan - Market size and forecast 2023-2028
- Chart on Japan - Market size and forecast 2023-2028 ($ million)
- Data Table on Japan - Market size and forecast 2023-2028 ($ million)
- Chart on Japan - Year-over-year growth 2023-2028 (%)
- Data Table on Japan - Year-over-year growth 2023-2028 (%)
- 11.12 France - Market size and forecast 2023-2028
- Chart on France - Market size and forecast 2023-2028 ($ million)
- Data Table on France - Market size and forecast 2023-2028 ($ million)
- Chart on France - Year-over-year growth 2023-2028 (%)
- Data Table on France - Year-over-year growth 2023-2028 (%)
- 11.13 Italy - Market size and forecast 2023-2028
- Chart on Italy - Market size and forecast 2023-2028 ($ million)
- Data Table on Italy - Market size and forecast 2023-2028 ($ million)
- Chart on Italy - Year-over-year growth 2023-2028 (%)
- Data Table on Italy - Year-over-year growth 2023-2028 (%)
- 11.14 India - Market size and forecast 2023-2028
- Chart on India - Market size and forecast 2023-2028 ($ million)
- Data Table on India - Market size and forecast 2023-2028 ($ million)
- Chart on India - Year-over-year growth 2023-2028 (%)
- Data Table on India - Year-over-year growth 2023-2028 (%)
- 11.15 Canada - Market size and forecast 2023-2028
- Chart on Canada - Market size and forecast 2023-2028 ($ million)
- Data Table on Canada - Market size and forecast 2023-2028 ($ million)
- Chart on Canada - Year-over-year growth 2023-2028 (%)
- Data Table on Canada - Year-over-year growth 2023-2028 (%)
- 11.16 Singapore - Market size and forecast 2023-2028
- Chart on Singapore - Market size and forecast 2023-2028 ($ million)
- Data Table on Singapore - Market size and forecast 2023-2028 ($ million)
- Chart on Singapore - Year-over-year growth 2023-2028 (%)
- Data Table on Singapore - Year-over-year growth 2023-2028 (%)
- 11.17 Market opportunity By Geographical Landscape
- Market opportunity By Geographical Landscape ($ million)
- Data Tables on Market opportunity By Geographical Landscape ($ million)
12 Drivers, Challenges, and Opportunity/Restraints
- 12.1 Market drivers
- 12.2 Market challenges
- 12.3 Impact of drivers and challenges
- Impact of drivers and challenges in 2023 and 2028
- 12.4 Market opportunities/restraints
13 Competitive Landscape
- 13.1 Overview
- 13.2 Competitive Landscape
- Overview on criticality of inputs and factors of differentiation
- 13.3 Landscape disruption
- Overview on factors of disruption
- 13.4 Industry risks
- Impact of key risks on business
14 Competitive Analysis
- 14.1 Companies profiled
- Companies covered
- 14.2 Company ranking index
- Company ranking index
- 14.3 Market positioning of companies
- Matrix on companies position and classification
- 14.4 Alnylam Pharmaceuticals Inc.
- Alnylam Pharmaceuticals Inc. - Overview
- Alnylam Pharmaceuticals Inc. - Product / Service
- Alnylam Pharmaceuticals Inc. - Key offerings
- SWOT
- 14.5 Arbutus Biopharma Corp.
- Arbutus Biopharma Corp. - Overview
- Arbutus Biopharma Corp. - Product / Service
- Arbutus Biopharma Corp. - Key offerings
- SWOT
- 14.6 Arcturus Therapeutics Holdings Inc.
- Arcturus Therapeutics Holdings Inc. - Overview
- Arcturus Therapeutics Holdings Inc. - Product / Service
- Arcturus Therapeutics Holdings Inc. - Key offerings
- SWOT
- 14.7 Arrowhead Pharmaceuticals Inc.
- Arrowhead Pharmaceuticals Inc. - Overview
- Arrowhead Pharmaceuticals Inc. - Product / Service
- Arrowhead Pharmaceuticals Inc. - Key offerings
- SWOT
- 14.8 AstraZeneca Plc
- AstraZeneca Plc - Overview
- AstraZeneca Plc - Product / Service
- AstraZeneca Plc - Key news
- AstraZeneca Plc - Key offerings
- SWOT
- 14.9 Benitec Biopharma Inc.
- Benitec Biopharma Inc. - Overview
- Benitec Biopharma Inc. - Product / Service
- Benitec Biopharma Inc. - Key offerings
- SWOT
- 14.10 Biogen Inc.
- Biogen Inc. - Overview
- Biogen Inc. - Product / Service
- Biogen Inc. - Key news
- Biogen Inc. - Key offerings
- SWOT
- 14.11 BioNTech SE
- BioNTech SE - Overview
- BioNTech SE - Product / Service
- BioNTech SE - Key offerings
- SWOT
- 14.12 CureVac AG
- CureVac AG - Overview
- CureVac AG - Product / Service
- CureVac AG - Key offerings
- SWOT
- 14.13 Gennova Biopharmaceuticals Ltd
- Gennova Biopharmaceuticals Ltd - Overview
- Gennova Biopharmaceuticals Ltd - Product / Service
- Gennova Biopharmaceuticals Ltd - Key offerings
- SWOT
- 14.14 Ionis Pharmaceuticals Inc.
- Ionis Pharmaceuticals Inc. - Overview
- Ionis Pharmaceuticals Inc. - Product / Service
- Ionis Pharmaceuticals Inc. - Key news
- Ionis Pharmaceuticals Inc. - Key offerings
- SWOT
- 14.15 Moderna Inc.
- Moderna Inc. - Overview
- Moderna Inc. - Product / Service
- Moderna Inc. - Key offerings
- SWOT
- 14.16 Novo Nordisk AS
- Novo Nordisk AS - Overview
- Novo Nordisk AS - Business segments
- Novo Nordisk AS - Key news
- Novo Nordisk AS - Key offerings
- Novo Nordisk AS - Segment focus
- SWOT
- 14.17 Sarepta Therapeutics Inc.
- Sarepta Therapeutics Inc. - Overview
- Sarepta Therapeutics Inc. - Product / Service
- Sarepta Therapeutics Inc. - Key offerings
- SWOT
- 14.18 Silence Therapeutics plc
- Silence Therapeutics plc - Overview
- Silence Therapeutics plc - Product / Service
- Silence Therapeutics plc - Key offerings
- SWOT
15 Appendix
- 15.1 Scope of the report
- 15.2 Inclusions and exclusions checklist
- Inclusions checklist
- Exclusions checklist
- 15.3 Currency conversion rates for US$
- Currency conversion rates for US$
- 15.4 Research methodology
- Research methodology
- 15.5 Data procurement
- Information sources
- 15.6 Data validation
- Data validation
- 15.7 Validation techniques employed for market sizing
- Validation techniques employed for market sizing
- 15.8 Data synthesis
- Data synthesis
- 15.9 360 degree market analysis
- 360 degree market analysis
- 15.10 List of abbreviations
- List of abbreviations

