|
|
市場調査レポート
商品コード
1559435
家庭用血液検査機器の世界市場、2024~2028年Global Home Blood Testing Devices Market 2024-2028 |
||||||
|
|||||||
カスタマイズ可能
|
|||||||

| 家庭用血液検査機器の世界市場、2024~2028年 |
|
出版日: 2024年08月27日
発行: TechNavio
ページ情報: 英文 206 Pages
納期: 即納可能
|

全表示
- 概要
- 図表
- 目次
家庭用血液検査機器市場は2023~2028年に29億5,910万米ドル、予測期間中のCAGRは4.66%で成長すると予測されます。
当レポートでは、家庭用血液検査機器市場の全体的な分析、市場規模・予測、動向、成長促進要因、課題、約25のベンダーを網羅したベンダー分析などを掲載しています。
現在の市場シナリオ、最新動向と促進要因、市場環境全体に関する最新分析を提供しています。市場は、伝染病発生の増加、利便性の高い血液検査ソリューションへの需要の高まり、慢性疾患の有病率の上昇によって牽引されています。
| 市場範囲 | |
|---|---|
| 基準年 | 2024年 |
| 終了年 | 2028年 |
| 予測期間 | 2024~2028年 |
| 成長モメンタム | 加速 |
| 前年比[2024年] | 3.94% |
| CAGR | 4.66% |
| 増分額 | 29億5,910万米ドル |
本調査では、家庭用血液検査機器の技術的進歩が、今後数年間の家庭用血液検査機器市場成長を促進する主要要因の1つであると分析しています。また、家庭用血液検査機器におけるデータ分析の統合や、ベンダーによる革新的なマーケティング戦略も、市場の大きな需要につながると考えられます。
目次
第1章 エグゼクティブサマリー
- 市場概要
第2章 Technavio分析
- 価格・ライフサイクル・顧客購入バスケット・採用率・購入基準の分析
- インプットの重要性と差別化の要因
- 混乱の要因
- 促進要因と課題の影響
第3章 市場情勢
- 市場エコシステム
- 市場の特徴
- バリューチェーン分析
第4章 市場規模の評価
- 市場の定義
- 市場セグメント分析
- 市場規模 2023年
- 市場の展望 2023~2028年
第5章 市場規模実績
- 家庭用血液検査機器の世界市場 2018~2022年
- 流通チャネル別セグメント分析 2018~2022年
- 製品タイプ別セグメント分析 2018~2022年
- 地域別セグメント分析 2018~2022年
- 国別セグメント分析 2018~2022年
第6章 定性分析
- AIの影響-家庭用血液検査機器の世界市場
第7章 ファイブフォース分析
- ファイブフォースの要約
- 買い手の交渉力
- 供給企業の交渉力
- 新規参入業者の脅威
- 代替品の脅威
- 競争の脅威
- 市況
第8章 市場セグメンテーション:流通チャネル別
- 市場セグメンテーション
- 比較:流通チャネル別
- 病院薬局:市場規模と予測 2023~2028年
- オンライン:市場規模と予測 2023~2028年
- ドラッグストア:市場規模と予測 2023~2028年
- 市場機会:流通チャネル別
第9章 市場セグメンテーション:製品タイプ別
- 市場セグメンテーション
- 比較:製品タイプ別
- 血糖値モニター:市場規模と予測 2023~2028年
- コレステロールキット:市場規模と予測 2023~2028年
- 凝固検査キット:市場規模と予測 2023~2028年
- その他:市場規模と予測 2023~2028年
- 市場機会:製品タイプ別
第10章 顧客情勢
- 顧客情勢概要
第11章 地域別情勢
- 地域別セグメンテーション
- 比較:地域別
- 北米:市場規模と予測 2023~2028年
- 欧州:市場規模と予測 2023~2028年
- アジア:市場規模と予測 2023~2028年
- その他:市場規模と予測 2023~2028年
- 米国:市場規模と予測 2023~2028年
- ドイツ:市場規模と予測 2023~2028年
- 英国:市場規模と予測 2023~2028年
- カナダ:市場規模と予測 2023~2028年
- 中国:市場規模と予測 2023~2028年
- 日本:市場規模と予測 2023~2028年
- オーストラリア:市場規模と予測 2023~2028年
- フランス:市場規模と予測 2023~2028年
- 韓国:市場規模と予測 2023~2028年
- イタリア:市場規模と予測 2023~2028年
- 市場機会:地域情勢別
第12章 促進要因・課題・機会・抑制要因
- 市場促進要因
- 市場課題
- 促進要因と課題の影響
- 市場の機会・抑制要因
第13章 競合情勢
- 概要
- 競合情勢
- 混乱の状況
- 業界のリスク
第14章 競合分析
- 企業プロファイル
- 企業ランキング指数
- 企業の市場ポジショニング
- Abbott Laboratories
- Becton Dickinson and Co.
- Bio Rad Laboratories Inc.
- BioMerieux SA
- Bionime Corp.
- Danaher Corp.
- F. Hoffmann La Roche Ltd.
- i-SENS, Inc.
- Medaval Ltd
- Minaris Medical America, Inc.
- Nova Biomedical Corp.
- PixCell Medical Technologies Ltd.
- Thermo Fisher Scientific Inc.
- Trajan Scientific Australia Pty Ltd.
- Truvian Sciences Inc.
第15章 付録
Exhibits:
- Exhibits1: Executive Summary - Chart on Market Overview
- Exhibits2: Executive Summary - Data Table on Market Overview
- Exhibits3: Executive Summary - Chart on Global Market Characteristics
- Exhibits4: Executive Summary - Chart on Market By Geographical Landscape
- Exhibits5: Executive Summary - Chart on Market Segmentation by Distribution Channel
- Exhibits6: Executive Summary - Chart on Market Segmentation by Product Type
- Exhibits7: Executive Summary - Chart on Incremental Growth
- Exhibits8: Executive Summary - Data Table on Incremental Growth
- Exhibits9: Executive Summary - Chart on Company Market Positioning
- Exhibits10: Analysis of price sensitivity, lifecycle, customer purchase basket, adoption rates, and purchase criteria
- Exhibits11: Overview on criticality of inputs and factors of differentiation
- Exhibits12: Overview on factors of disruption
- Exhibits13: Impact of drivers and challenges in 2023 and 2028
- Exhibits14: Parent Market
- Exhibits15: Data Table on - Parent Market
- Exhibits16: Market characteristics analysis
- Exhibits17: Value Chain Analysis
- Exhibits18: Offerings of companies included in the market definition
- Exhibits19: Market segments
- Exhibits20: Chart on Global - Market size and forecast 2023-2028 ($ million)
- Exhibits21: Data Table on Global - Market size and forecast 2023-2028 ($ million)
- Exhibits22: Chart on Global Market: Year-over-year growth 2023-2028 (%)
- Exhibits23: Data Table on Global Market: Year-over-year growth 2023-2028 (%)
- Exhibits24: Historic Market Size - Data Table on Global Home Blood Testing Devices Market 2018 - 2022 ($ million)
- Exhibits25: Historic Market Size - Distribution Channel Segment 2018 - 2022 ($ million)
- Exhibits26: Historic Market Size - Product Type Segment 2018 - 2022 ($ million)
- Exhibits27: Historic Market Size - Geography Segment 2018 - 2022 ($ million)
- Exhibits28: Historic Market Size - Country Segment 2018 - 2022 ($ million)
- Exhibits29: Five forces analysis - Comparison between 2023 and 2028
- Exhibits30: Bargaining power of buyers - Impact of key factors 2023 and 2028
- Exhibits31: Bargaining power of suppliers - Impact of key factors in 2023 and 2028
- Exhibits32: Threat of new entrants - Impact of key factors in 2023 and 2028
- Exhibits33: Threat of substitutes - Impact of key factors in 2023 and 2028
- Exhibits34: Threat of rivalry - Impact of key factors in 2023 and 2028
- Exhibits35: Chart on Market condition - Five forces 2023 and 2028
- Exhibits36: Chart on Distribution Channel - Market share 2023-2028 (%)
- Exhibits37: Data Table on Distribution Channel - Market share 2023-2028 (%)
- Exhibits38: Chart on Comparison by Distribution Channel
- Exhibits39: Data Table on Comparison by Distribution Channel
- Exhibits40: Chart on Hospital pharmacies - Market size and forecast 2023-2028 ($ million)
- Exhibits41: Data Table on Hospital pharmacies - Market size and forecast 2023-2028 ($ million)
- Exhibits42: Chart on Hospital pharmacies - Year-over-year growth 2023-2028 (%)
- Exhibits43: Data Table on Hospital pharmacies - Year-over-year growth 2023-2028 (%)
- Exhibits44: Chart on Online - Market size and forecast 2023-2028 ($ million)
- Exhibits45: Data Table on Online - Market size and forecast 2023-2028 ($ million)
- Exhibits46: Chart on Online - Year-over-year growth 2023-2028 (%)
- Exhibits47: Data Table on Online - Year-over-year growth 2023-2028 (%)
- Exhibits48: Chart on Drug stores - Market size and forecast 2023-2028 ($ million)
- Exhibits49: Data Table on Drug stores - Market size and forecast 2023-2028 ($ million)
- Exhibits50: Chart on Drug stores - Year-over-year growth 2023-2028 (%)
- Exhibits51: Data Table on Drug stores - Year-over-year growth 2023-2028 (%)
- Exhibits52: Market opportunity by Distribution Channel ($ million)
- Exhibits53: Data Table on Market opportunity by Distribution Channel ($ million)
- Exhibits54: Chart on Product Type - Market share 2023-2028 (%)
- Exhibits55: Data Table on Product Type - Market share 2023-2028 (%)
- Exhibits56: Chart on Comparison by Product Type
- Exhibits57: Data Table on Comparison by Product Type
- Exhibits58: Chart on Glucose monitors - Market size and forecast 2023-2028 ($ million)
- Exhibits59: Data Table on Glucose monitors - Market size and forecast 2023-2028 ($ million)
- Exhibits60: Chart on Glucose monitors - Year-over-year growth 2023-2028 (%)
- Exhibits61: Data Table on Glucose monitors - Year-over-year growth 2023-2028 (%)
- Exhibits62: Chart on Cholestrol kits - Market size and forecast 2023-2028 ($ million)
- Exhibits63: Data Table on Cholestrol kits - Market size and forecast 2023-2028 ($ million)
- Exhibits64: Chart on Cholestrol kits - Year-over-year growth 2023-2028 (%)
- Exhibits65: Data Table on Cholestrol kits - Year-over-year growth 2023-2028 (%)
- Exhibits66: Chart on Coagulation test kits - Market size and forecast 2023-2028 ($ million)
- Exhibits67: Data Table on Coagulation test kits - Market size and forecast 2023-2028 ($ million)
- Exhibits68: Chart on Coagulation test kits - Year-over-year growth 2023-2028 (%)
- Exhibits69: Data Table on Coagulation test kits - Year-over-year growth 2023-2028 (%)
- Exhibits70: Chart on Others - Market size and forecast 2023-2028 ($ million)
- Exhibits71: Data Table on Others - Market size and forecast 2023-2028 ($ million)
- Exhibits72: Chart on Others - Year-over-year growth 2023-2028 (%)
- Exhibits73: Data Table on Others - Year-over-year growth 2023-2028 (%)
- Exhibits74: Market opportunity by Product Type ($ million)
- Exhibits75: Data Table on Market opportunity by Product Type ($ million)
- Exhibits76: Analysis of price sensitivity, lifecycle, customer purchase basket, adoption rates, and purchase criteria
- Exhibits77: Chart on Market share By Geographical Landscape 2023-2028 (%)
- Exhibits78: Data Table on Market share By Geographical Landscape 2023-2028 (%)
- Exhibits79: Chart on Geographic comparison
- Exhibits80: Data Table on Geographic comparison
- Exhibits81: Chart on North America - Market size and forecast 2023-2028 ($ million)
- Exhibits82: Data Table on North America - Market size and forecast 2023-2028 ($ million)
- Exhibits83: Chart on North America - Year-over-year growth 2023-2028 (%)
- Exhibits84: Data Table on North America - Year-over-year growth 2023-2028 (%)
- Exhibits85: Chart on Europe - Market size and forecast 2023-2028 ($ million)
- Exhibits86: Data Table on Europe - Market size and forecast 2023-2028 ($ million)
- Exhibits87: Chart on Europe - Year-over-year growth 2023-2028 (%)
- Exhibits88: Data Table on Europe - Year-over-year growth 2023-2028 (%)
- Exhibits89: Chart on Asia - Market size and forecast 2023-2028 ($ million)
- Exhibits90: Data Table on Asia - Market size and forecast 2023-2028 ($ million)
- Exhibits91: Chart on Asia - Year-over-year growth 2023-2028 (%)
- Exhibits92: Data Table on Asia - Year-over-year growth 2023-2028 (%)
- Exhibits93: Chart on Rest of World (ROW) - Market size and forecast 2023-2028 ($ million)
- Exhibits94: Data Table on Rest of World (ROW) - Market size and forecast 2023-2028 ($ million)
- Exhibits95: Chart on Rest of World (ROW) - Year-over-year growth 2023-2028 (%)
- Exhibits96: Data Table on Rest of World (ROW) - Year-over-year growth 2023-2028 (%)
- Exhibits97: Chart on US - Market size and forecast 2023-2028 ($ million)
- Exhibits98: Data Table on US - Market size and forecast 2023-2028 ($ million)
- Exhibits99: Chart on US - Year-over-year growth 2023-2028 (%)
- Exhibits100: Data Table on US - Year-over-year growth 2023-2028 (%)
- Exhibits101: Chart on Germany - Market size and forecast 2023-2028 ($ million)
- Exhibits102: Data Table on Germany - Market size and forecast 2023-2028 ($ million)
- Exhibits103: Chart on Germany - Year-over-year growth 2023-2028 (%)
- Exhibits104: Data Table on Germany - Year-over-year growth 2023-2028 (%)
- Exhibits105: Chart on UK - Market size and forecast 2023-2028 ($ million)
- Exhibits106: Data Table on UK - Market size and forecast 2023-2028 ($ million)
- Exhibits107: Chart on UK - Year-over-year growth 2023-2028 (%)
- Exhibits108: Data Table on UK - Year-over-year growth 2023-2028 (%)
- Exhibits109: Chart on Canada - Market size and forecast 2023-2028 ($ million)
- Exhibits110: Data Table on Canada - Market size and forecast 2023-2028 ($ million)
- Exhibits111: Chart on Canada - Year-over-year growth 2023-2028 (%)
- Exhibits112: Data Table on Canada - Year-over-year growth 2023-2028 (%)
- Exhibits113: Chart on China - Market size and forecast 2023-2028 ($ million)
- Exhibits114: Data Table on China - Market size and forecast 2023-2028 ($ million)
- Exhibits115: Chart on China - Year-over-year growth 2023-2028 (%)
- Exhibits116: Data Table on China - Year-over-year growth 2023-2028 (%)
- Exhibits117: Chart on Japan - Market size and forecast 2023-2028 ($ million)
- Exhibits118: Data Table on Japan - Market size and forecast 2023-2028 ($ million)
- Exhibits119: Chart on Japan - Year-over-year growth 2023-2028 (%)
- Exhibits120: Data Table on Japan - Year-over-year growth 2023-2028 (%)
- Exhibits121: Chart on Australia - Market size and forecast 2023-2028 ($ million)
- Exhibits122: Data Table on Australia - Market size and forecast 2023-2028 ($ million)
- Exhibits123: Chart on Australia - Year-over-year growth 2023-2028 (%)
- Exhibits124: Data Table on Australia - Year-over-year growth 2023-2028 (%)
- Exhibits125: Chart on France - Market size and forecast 2023-2028 ($ million)
- Exhibits126: Data Table on France - Market size and forecast 2023-2028 ($ million)
- Exhibits127: Chart on France - Year-over-year growth 2023-2028 (%)
- Exhibits128: Data Table on France - Year-over-year growth 2023-2028 (%)
- Exhibits129: Chart on South Korea - Market size and forecast 2023-2028 ($ million)
- Exhibits130: Data Table on South Korea - Market size and forecast 2023-2028 ($ million)
- Exhibits131: Chart on South Korea - Year-over-year growth 2023-2028 (%)
- Exhibits132: Data Table on South Korea - Year-over-year growth 2023-2028 (%)
- Exhibits133: Chart on Italy - Market size and forecast 2023-2028 ($ million)
- Exhibits134: Data Table on Italy - Market size and forecast 2023-2028 ($ million)
- Exhibits135: Chart on Italy - Year-over-year growth 2023-2028 (%)
- Exhibits136: Data Table on Italy - Year-over-year growth 2023-2028 (%)
- Exhibits137: Market opportunity By Geographical Landscape ($ million)
- Exhibits138: Data Tables on Market opportunity By Geographical Landscape ($ million)
- Exhibits139: Impact of drivers and challenges in 2023 and 2028
- Exhibits140: Overview on criticality of inputs and factors of differentiation
- Exhibits141: Overview on factors of disruption
- Exhibits142: Impact of key risks on business
- Exhibits143: Companies covered
- Exhibits144: Company ranking index
- Exhibits145: Matrix on companies position and classification
- Exhibits146: Abbott Laboratories - Overview
- Exhibits147: Abbott Laboratories - Business segments
- Exhibits148: Abbott Laboratories - Key offerings
- Exhibits149: Abbott Laboratories - Segment focus
- Exhibits150: SWOT
- Exhibits151: Becton Dickinson and Co. - Overview
- Exhibits152: Becton Dickinson and Co. - Business segments
- Exhibits153: Becton Dickinson and Co. - Key news
- Exhibits154: Becton Dickinson and Co. - Key offerings
- Exhibits155: Becton Dickinson and Co. - Segment focus
- Exhibits156: SWOT
- Exhibits157: Bio Rad Laboratories Inc. - Overview
- Exhibits158: Bio Rad Laboratories Inc. - Business segments
- Exhibits159: Bio Rad Laboratories Inc. - Key news
- Exhibits160: Bio Rad Laboratories Inc. - Key offerings
- Exhibits161: Bio Rad Laboratories Inc. - Segment focus
- Exhibits162: SWOT
- Exhibits163: BioMerieux SA - Overview
- Exhibits164: BioMerieux SA - Product / Service
- Exhibits165: BioMerieux SA - Key news
- Exhibits166: BioMerieux SA - Key offerings
- Exhibits167: SWOT
- Exhibits168: Bionime Corp. - Overview
- Exhibits169: Bionime Corp. - Product / Service
- Exhibits170: Bionime Corp. - Key offerings
- Exhibits171: SWOT
- Exhibits172: Danaher Corp. - Overview
- Exhibits173: Danaher Corp. - Business segments
- Exhibits174: Danaher Corp. - Key news
- Exhibits175: Danaher Corp. - Key offerings
- Exhibits176: Danaher Corp. - Segment focus
- Exhibits177: SWOT
- Exhibits178: F. Hoffmann La Roche Ltd. - Overview
- Exhibits179: F. Hoffmann La Roche Ltd. - Business segments
- Exhibits180: F. Hoffmann La Roche Ltd. - Key news
- Exhibits181: F. Hoffmann La Roche Ltd. - Key offerings
- Exhibits182: F. Hoffmann La Roche Ltd. - Segment focus
- Exhibits183: SWOT
- Exhibits184: i-SENS, Inc. - Overview
- Exhibits185: i-SENS, Inc. - Product / Service
- Exhibits186: i-SENS, Inc. - Key offerings
- Exhibits187: SWOT
- Exhibits188: Medaval Ltd - Overview
- Exhibits189: Medaval Ltd - Product / Service
- Exhibits190: Medaval Ltd - Key offerings
- Exhibits191: SWOT
- Exhibits192: Minaris Medical America, Inc. - Overview
- Exhibits193: Minaris Medical America, Inc. - Product / Service
- Exhibits194: Minaris Medical America, Inc. - Key offerings
- Exhibits195: SWOT
- Exhibits196: Nova Biomedical Corp. - Overview
- Exhibits197: Nova Biomedical Corp. - Product / Service
- Exhibits198: Nova Biomedical Corp. - Key offerings
- Exhibits199: SWOT
- Exhibits200: PixCell Medical Technologies Ltd. - Overview
- Exhibits201: PixCell Medical Technologies Ltd. - Product / Service
- Exhibits202: PixCell Medical Technologies Ltd. - Key offerings
- Exhibits203: SWOT
- Exhibits204: Thermo Fisher Scientific Inc. - Overview
- Exhibits205: Thermo Fisher Scientific Inc. - Business segments
- Exhibits206: Thermo Fisher Scientific Inc. - Key news
- Exhibits207: Thermo Fisher Scientific Inc. - Key offerings
- Exhibits208: Thermo Fisher Scientific Inc. - Segment focus
- Exhibits209: SWOT
- Exhibits210: Trajan Scientific Australia Pty Ltd. - Overview
- Exhibits211: Trajan Scientific Australia Pty Ltd. - Key offerings
- Exhibits212: SWOT
- Exhibits213: Truvian Sciences Inc. - Overview
- Exhibits214: Truvian Sciences Inc. - Product / Service
- Exhibits215: Truvian Sciences Inc. - Key offerings
- Exhibits216: SWOT
- Exhibits217: Inclusions checklist
- Exhibits218: Exclusions checklist
- Exhibits219: Currency conversion rates for US$
- Exhibits220: Research methodology
- Exhibits221: Information sources
- Exhibits222: Data validation
- Exhibits223: Validation techniques employed for market sizing
- Exhibits224: Data synthesis
- Exhibits225: 360 degree market analysis
- Exhibits226: List of abbreviations
The home blood testing devices market is forecasted to grow by USD 2959.1 mn during 2023-2028, accelerating at a CAGR of 4.66% during the forecast period. The report on the home blood testing devices market provides a holistic analysis, market size and forecast, trends, growth drivers, and challenges, as well as vendor analysis covering around 25 vendors.
The report offers an up-to-date analysis regarding the current market scenario, the latest trends and drivers, and the overall market environment. The market is driven by increasing contagious disease outbreaks, growing demand for convenient blood testing solutions, and rising prevalence of chronic diseases.
Technavio's home blood testing devices market is segmented as below:
| Market Scope | |
|---|---|
| Base Year | 2024 |
| End Year | 2028 |
| Series Year | 2024-2028 |
| Growth Momentum | Accelerate |
| YOY 2024 | 3.94% |
| CAGR | 4.66% |
| Incremental Value | $2959.1 mn |
By Distribution Channel
- Hospital pharmacies
- Online
- Drug stores
By Product Type
- Glucose monitors
- Cholestrol kits
- Coagulation test kits
- Others
By Geographical Landscape
- North America
- Europe
- Asia
- Rest of World (ROW)
This study identifies the technological advancements in home blood testing devices as one of the prime reasons driving the home blood testing devices market growth during the next few years. Also, integration of data analytics in home blood testing devices and innovative marketing strategies adapted by vendors will lead to sizable demand in the market.
The report on the home blood testing devices market covers the following areas:
- Home blood testing devices market sizing
- Home blood testing devices market forecast
- Home blood testing devices market industry analysis
The robust vendor analysis is designed to help clients improve their market position, and in line with this, this report provides a detailed analysis of several leading home blood testing devices market vendors that include A and D HOLON Holdings Co. Ltd., Abbott Laboratories, ARKRAY Inc., Becton Dickinson and Co., Beurer India Pvt. Ltd., Bio Rad Laboratories Inc., BioMerieux SA, Bionime Corp., Danaher Corp., F. Hoffmann La Roche Ltd., i-SENS, Inc., LifeScan IP Holdings LLC, Medaval Ltd, Microgene Diagnostic Systems Pvt. Ltd., Minaris Medical America, Inc., Nova Biomedical Corp., PixCell Medical Technologies Ltd., Thermo Fisher Scientific Inc., Trajan Scientific Australia Pty Ltd., and Truvian Sciences Inc.. Also, the home blood testing devices market analysis report includes information on upcoming trends and challenges that will influence market growth. This is to help companies strategize and leverage all forthcoming growth opportunities.
The study was conducted using an objective combination of primary and secondary information including inputs from key participants in the industry. The report contains a comprehensive market and vendor landscape in addition to an analysis of the key vendors.
The publisher presents a detailed picture of the market by the way of study, synthesis, and summation of data from multiple sources by an analysis of key parameters such as profit, pricing, competition, and promotions. It presents various market facets by identifying the key industry influencers. The data presented is comprehensive, reliable, and a result of extensive research - both primary and secondary. The market research reports provide a complete competitive landscape and an in-depth vendor selection methodology and analysis using qualitative and quantitative research to forecast the accurate market growth.
Table of Contents
1 Executive Summary
- 1.1 Market overview
- Executive Summary - Chart on Market Overview
- Executive Summary - Data Table on Market Overview
- Executive Summary - Chart on Global Market Characteristics
- Executive Summary - Chart on Market By Geographical Landscape
- Executive Summary - Chart on Market Segmentation by Distribution Channel
- Executive Summary - Chart on Market Segmentation by Product Type
- Executive Summary - Chart on Incremental Growth
- Executive Summary - Data Table on Incremental Growth
- Executive Summary - Chart on Company Market Positioning
2 Technavio Analysis
- 2.1 Analysis of price sensitivity, lifecycle, customer purchase basket, adoption rates, and purchase criteria
- Analysis of price sensitivity, lifecycle, customer purchase basket, adoption rates, and purchase criteria
- 2.2 Criticality of inputs and Factors of differentiation
- Overview on criticality of inputs and factors of differentiation
- 2.3 Factors of disruption
- Overview on factors of disruption
- 2.4 Impact of drivers and challenges
- Impact of drivers and challenges in 2023 and 2028
3 Market Landscape
- 3.1 Market ecosystem
- Parent Market
- Data Table on - Parent Market
- 3.2 Market characteristics
- Market characteristics analysis
- 3.3 Value chain analysis
- Value Chain Analysis
4 Market Sizing
- 4.1 Market definition
- Offerings of companies included in the market definition
- 4.2 Market segment analysis
- Market segments
- 4.3 Market size 2023
- 4.4 Market outlook: Forecast for 2023-2028
- Chart on Global - Market size and forecast 2023-2028 ($ million)
- Data Table on Global - Market size and forecast 2023-2028 ($ million)
- Chart on Global Market: Year-over-year growth 2023-2028 (%)
- Data Table on Global Market: Year-over-year growth 2023-2028 (%)
5 Historic Market Size
- 5.1 Global Home Blood Testing Devices Market 2018 - 2022
- Historic Market Size - Data Table on Global Home Blood Testing Devices Market 2018 - 2022 ($ million)
- 5.2 Distribution Channel segment analysis 2018 - 2022
- Historic Market Size - Distribution Channel Segment 2018 - 2022 ($ million)
- 5.3 Product Type segment analysis 2018 - 2022
- Historic Market Size - Product Type Segment 2018 - 2022 ($ million)
- 5.4 Geography segment analysis 2018 - 2022
- Historic Market Size - Geography Segment 2018 - 2022 ($ million)
- 5.5 Country segment analysis 2018 - 2022
- Historic Market Size - Country Segment 2018 - 2022 ($ million)
6 Qualitative Analysis
- 6.1 Impact of AI on the Global Home Blood Testing Devices Market
7 Five Forces Analysis
- 7.1 Five forces summary
- Five forces analysis - Comparison between 2023 and 2028
- 7.2 Bargaining power of buyers
- Bargaining power of buyers - Impact of key factors 2023 and 2028
- 7.3 Bargaining power of suppliers
- Bargaining power of suppliers - Impact of key factors in 2023 and 2028
- 7.4 Threat of new entrants
- Threat of new entrants - Impact of key factors in 2023 and 2028
- 7.5 Threat of substitutes
- Threat of substitutes - Impact of key factors in 2023 and 2028
- 7.6 Threat of rivalry
- Threat of rivalry - Impact of key factors in 2023 and 2028
- 7.7 Market condition
- Chart on Market condition - Five forces 2023 and 2028
8 Market Segmentation by Distribution Channel
- 8.1 Market segments
- Chart on Distribution Channel - Market share 2023-2028 (%)
- Data Table on Distribution Channel - Market share 2023-2028 (%)
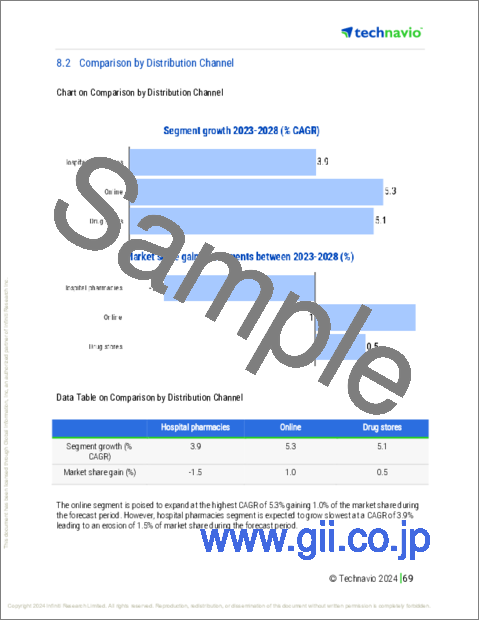
- 8.2 Comparison by Distribution Channel
- Chart on Comparison by Distribution Channel
- Data Table on Comparison by Distribution Channel
- 8.3 Hospital pharmacies - Market size and forecast 2023-2028
- Chart on Hospital pharmacies - Market size and forecast 2023-2028 ($ million)
- Data Table on Hospital pharmacies - Market size and forecast 2023-2028 ($ million)
- Chart on Hospital pharmacies - Year-over-year growth 2023-2028 (%)
- Data Table on Hospital pharmacies - Year-over-year growth 2023-2028 (%)
- 8.4 Online - Market size and forecast 2023-2028
- Chart on Online - Market size and forecast 2023-2028 ($ million)
- Data Table on Online - Market size and forecast 2023-2028 ($ million)
- Chart on Online - Year-over-year growth 2023-2028 (%)
- Data Table on Online - Year-over-year growth 2023-2028 (%)
- 8.5 Drug stores - Market size and forecast 2023-2028
- Chart on Drug stores - Market size and forecast 2023-2028 ($ million)
- Data Table on Drug stores - Market size and forecast 2023-2028 ($ million)
- Chart on Drug stores - Year-over-year growth 2023-2028 (%)
- Data Table on Drug stores - Year-over-year growth 2023-2028 (%)
- 8.6 Market opportunity by Distribution Channel
- Market opportunity by Distribution Channel ($ million)
- Data Table on Market opportunity by Distribution Channel ($ million)
9 Market Segmentation by Product Type
- 9.1 Market segments
- Chart on Product Type - Market share 2023-2028 (%)
- Data Table on Product Type - Market share 2023-2028 (%)
- 9.2 Comparison by Product Type
- Chart on Comparison by Product Type
- Data Table on Comparison by Product Type
- 9.3 Glucose monitors - Market size and forecast 2023-2028
- Chart on Glucose monitors - Market size and forecast 2023-2028 ($ million)
- Data Table on Glucose monitors - Market size and forecast 2023-2028 ($ million)
- Chart on Glucose monitors - Year-over-year growth 2023-2028 (%)
- Data Table on Glucose monitors - Year-over-year growth 2023-2028 (%)
- 9.4 Cholestrol kits - Market size and forecast 2023-2028
- Chart on Cholestrol kits - Market size and forecast 2023-2028 ($ million)
- Data Table on Cholestrol kits - Market size and forecast 2023-2028 ($ million)
- Chart on Cholestrol kits - Year-over-year growth 2023-2028 (%)
- Data Table on Cholestrol kits - Year-over-year growth 2023-2028 (%)
- 9.5 Coagulation test kits - Market size and forecast 2023-2028
- Chart on Coagulation test kits - Market size and forecast 2023-2028 ($ million)
- Data Table on Coagulation test kits - Market size and forecast 2023-2028 ($ million)
- Chart on Coagulation test kits - Year-over-year growth 2023-2028 (%)
- Data Table on Coagulation test kits - Year-over-year growth 2023-2028 (%)
- 9.6 Others - Market size and forecast 2023-2028
- Chart on Others - Market size and forecast 2023-2028 ($ million)
- Data Table on Others - Market size and forecast 2023-2028 ($ million)
- Chart on Others - Year-over-year growth 2023-2028 (%)
- Data Table on Others - Year-over-year growth 2023-2028 (%)
- 9.7 Market opportunity by Product Type
- Market opportunity by Product Type ($ million)
- Data Table on Market opportunity by Product Type ($ million)
10 Customer Landscape
- 10.1 Customer landscape overview
- Analysis of price sensitivity, lifecycle, customer purchase basket, adoption rates, and purchase criteria
11 Geographic Landscape
- 11.1 Geographic segmentation
- Chart on Market share By Geographical Landscape 2023-2028 (%)
- Data Table on Market share By Geographical Landscape 2023-2028 (%)
- 11.2 Geographic comparison
- Chart on Geographic comparison
- Data Table on Geographic comparison
- 11.3 North America - Market size and forecast 2023-2028
- Chart on North America - Market size and forecast 2023-2028 ($ million)
- Data Table on North America - Market size and forecast 2023-2028 ($ million)
- Chart on North America - Year-over-year growth 2023-2028 (%)
- Data Table on North America - Year-over-year growth 2023-2028 (%)
- 11.4 Europe - Market size and forecast 2023-2028
- Chart on Europe - Market size and forecast 2023-2028 ($ million)
- Data Table on Europe - Market size and forecast 2023-2028 ($ million)
- Chart on Europe - Year-over-year growth 2023-2028 (%)
- Data Table on Europe - Year-over-year growth 2023-2028 (%)
- 11.5 Asia - Market size and forecast 2023-2028
- Chart on Asia - Market size and forecast 2023-2028 ($ million)
- Data Table on Asia - Market size and forecast 2023-2028 ($ million)
- Chart on Asia - Year-over-year growth 2023-2028 (%)
- Data Table on Asia - Year-over-year growth 2023-2028 (%)
- 11.6 Rest of World (ROW) - Market size and forecast 2023-2028
- Chart on Rest of World (ROW) - Market size and forecast 2023-2028 ($ million)
- Data Table on Rest of World (ROW) - Market size and forecast 2023-2028 ($ million)
- Chart on Rest of World (ROW) - Year-over-year growth 2023-2028 (%)
- Data Table on Rest of World (ROW) - Year-over-year growth 2023-2028 (%)
- 11.7 US - Market size and forecast 2023-2028
- Chart on US - Market size and forecast 2023-2028 ($ million)
- Data Table on US - Market size and forecast 2023-2028 ($ million)
- Chart on US - Year-over-year growth 2023-2028 (%)
- Data Table on US - Year-over-year growth 2023-2028 (%)
- 11.8 Germany - Market size and forecast 2023-2028
- Chart on Germany - Market size and forecast 2023-2028 ($ million)
- Data Table on Germany - Market size and forecast 2023-2028 ($ million)
- Chart on Germany - Year-over-year growth 2023-2028 (%)
- Data Table on Germany - Year-over-year growth 2023-2028 (%)
- 11.9 UK - Market size and forecast 2023-2028
- Chart on UK - Market size and forecast 2023-2028 ($ million)
- Data Table on UK - Market size and forecast 2023-2028 ($ million)
- Chart on UK - Year-over-year growth 2023-2028 (%)
- Data Table on UK - Year-over-year growth 2023-2028 (%)
- 11.10 Canada - Market size and forecast 2023-2028
- Chart on Canada - Market size and forecast 2023-2028 ($ million)
- Data Table on Canada - Market size and forecast 2023-2028 ($ million)
- Chart on Canada - Year-over-year growth 2023-2028 (%)
- Data Table on Canada - Year-over-year growth 2023-2028 (%)
- 11.11 China - Market size and forecast 2023-2028
- Chart on China - Market size and forecast 2023-2028 ($ million)
- Data Table on China - Market size and forecast 2023-2028 ($ million)
- Chart on China - Year-over-year growth 2023-2028 (%)
- Data Table on China - Year-over-year growth 2023-2028 (%)
- 11.12 Japan - Market size and forecast 2023-2028
- Chart on Japan - Market size and forecast 2023-2028 ($ million)
- Data Table on Japan - Market size and forecast 2023-2028 ($ million)
- Chart on Japan - Year-over-year growth 2023-2028 (%)
- Data Table on Japan - Year-over-year growth 2023-2028 (%)
- 11.13 Australia - Market size and forecast 2023-2028
- Chart on Australia - Market size and forecast 2023-2028 ($ million)
- Data Table on Australia - Market size and forecast 2023-2028 ($ million)
- Chart on Australia - Year-over-year growth 2023-2028 (%)
- Data Table on Australia - Year-over-year growth 2023-2028 (%)
- 11.14 France - Market size and forecast 2023-2028
- Chart on France - Market size and forecast 2023-2028 ($ million)
- Data Table on France - Market size and forecast 2023-2028 ($ million)
- Chart on France - Year-over-year growth 2023-2028 (%)
- Data Table on France - Year-over-year growth 2023-2028 (%)
- 11.15 South Korea - Market size and forecast 2023-2028
- Chart on South Korea - Market size and forecast 2023-2028 ($ million)
- Data Table on South Korea - Market size and forecast 2023-2028 ($ million)
- Chart on South Korea - Year-over-year growth 2023-2028 (%)
- Data Table on South Korea - Year-over-year growth 2023-2028 (%)
- 11.16 Italy - Market size and forecast 2023-2028
- Chart on Italy - Market size and forecast 2023-2028 ($ million)
- Data Table on Italy - Market size and forecast 2023-2028 ($ million)
- Chart on Italy - Year-over-year growth 2023-2028 (%)
- Data Table on Italy - Year-over-year growth 2023-2028 (%)
- 11.17 Market opportunity By Geographical Landscape
- Market opportunity By Geographical Landscape ($ million)
- Data Tables on Market opportunity By Geographical Landscape ($ million)
12 Drivers, Challenges, and Opportunity/Restraints
- 12.1 Market drivers
- 12.2 Market challenges
- 12.3 Impact of drivers and challenges
- Impact of drivers and challenges in 2023 and 2028
- 12.4 Market opportunities/restraints
13 Competitive Landscape
- 13.1 Overview
- 13.2 Competitive Landscape
- Overview on criticality of inputs and factors of differentiation
- 13.3 Landscape disruption
- Overview on factors of disruption
- 13.4 Industry risks
- Impact of key risks on business
14 Competitive Analysis
- 14.1 Companies profiled
- Companies covered
- 14.2 Company ranking index
- Company ranking index
- 14.3 Market positioning of companies
- Matrix on companies position and classification
- 14.4 Abbott Laboratories
- Abbott Laboratories - Overview
- Abbott Laboratories - Business segments
- Abbott Laboratories - Key offerings
- Abbott Laboratories - Segment focus
- SWOT
- 14.5 Becton Dickinson and Co.
- Becton Dickinson and Co. - Overview
- Becton Dickinson and Co. - Business segments
- Becton Dickinson and Co. - Key news
- Becton Dickinson and Co. - Key offerings
- Becton Dickinson and Co. - Segment focus
- SWOT
- 14.6 Bio Rad Laboratories Inc.
- Bio Rad Laboratories Inc. - Overview
- Bio Rad Laboratories Inc. - Business segments
- Bio Rad Laboratories Inc. - Key news
- Bio Rad Laboratories Inc. - Key offerings
- Bio Rad Laboratories Inc. - Segment focus
- SWOT
- 14.7 BioMerieux SA
- BioMerieux SA - Overview
- BioMerieux SA - Product / Service
- BioMerieux SA - Key news
- BioMerieux SA - Key offerings
- SWOT
- 14.8 Bionime Corp.
- Bionime Corp. - Overview
- Bionime Corp. - Product / Service
- Bionime Corp. - Key offerings
- SWOT
- 14.9 Danaher Corp.
- Danaher Corp. - Overview
- Danaher Corp. - Business segments
- Danaher Corp. - Key news
- Danaher Corp. - Key offerings
- Danaher Corp. - Segment focus
- SWOT
- 14.10 F. Hoffmann La Roche Ltd.
- F. Hoffmann La Roche Ltd. - Overview
- F. Hoffmann La Roche Ltd. - Business segments
- F. Hoffmann La Roche Ltd. - Key news
- F. Hoffmann La Roche Ltd. - Key offerings
- F. Hoffmann La Roche Ltd. - Segment focus
- SWOT
- 14.11 i-SENS, Inc.
- i-SENS, Inc. - Overview
- i-SENS, Inc. - Product / Service
- i-SENS, Inc. - Key offerings
- SWOT
- 14.12 Medaval Ltd
- Medaval Ltd - Overview
- Medaval Ltd - Product / Service
- Medaval Ltd - Key offerings
- SWOT
- 14.13 Minaris Medical America, Inc.
- Minaris Medical America, Inc. - Overview
- Minaris Medical America, Inc. - Product / Service
- Minaris Medical America, Inc. - Key offerings
- SWOT
- 14.14 Nova Biomedical Corp.
- Nova Biomedical Corp. - Overview
- Nova Biomedical Corp. - Product / Service
- Nova Biomedical Corp. - Key offerings
- SWOT
- 14.15 PixCell Medical Technologies Ltd.
- PixCell Medical Technologies Ltd. - Overview
- PixCell Medical Technologies Ltd. - Product / Service
- PixCell Medical Technologies Ltd. - Key offerings
- SWOT
- 14.16 Thermo Fisher Scientific Inc.
- Thermo Fisher Scientific Inc. - Overview
- Thermo Fisher Scientific Inc. - Business segments
- Thermo Fisher Scientific Inc. - Key news
- Thermo Fisher Scientific Inc. - Key offerings
- Thermo Fisher Scientific Inc. - Segment focus
- SWOT
- 14.17 Trajan Scientific Australia Pty Ltd.
- Trajan Scientific Australia Pty Ltd. - Overview
- Trajan Scientific Australia Pty Ltd. - Key offerings
- SWOT
- 14.18 Truvian Sciences Inc.
- Truvian Sciences Inc. - Overview
- Truvian Sciences Inc. - Product / Service
- Truvian Sciences Inc. - Key offerings
- SWOT
15 Appendix
- 15.1 Scope of the report
- 15.2 Inclusions and exclusions checklist
- Inclusions checklist
- Exclusions checklist
- 15.3 Currency conversion rates for US$
- Currency conversion rates for US$
- 15.4 Research methodology
- Research methodology
- 15.5 Data procurement
- Information sources
- 15.6 Data validation
- Data validation
- 15.7 Validation techniques employed for market sizing
- Validation techniques employed for market sizing
- 15.8 Data synthesis
- Data synthesis
- 15.9 360 degree market analysis
- 360 degree market analysis
- 15.10 List of abbreviations
- List of abbreviations

