|
|
市場調査レポート
商品コード
1911256
エクソソーム治療薬の世界市場、2026年~2030年Global Exosome Therapeutics Market 2026-2030 |
||||||
|
|||||||
カスタマイズ可能
|
|||||||

| エクソソーム治療薬の世界市場、2026年~2030年 |
|
出版日: 2026年01月14日
発行: TechNavio
ページ情報: 英文 286 Pages
納期: 即納可能
|

概要
世界のエクソソーム治療薬市場は、2025年から2030年の間に4億862万800米ドルの成長が見込まれ、予測期間中のCAGRは19.6%と予測されています。
本レポートでは、世界のエクソソーム治療薬市場に関する包括的な分析、市場規模と予測、動向、成長要因、課題に加え、約25社のベンダー分析を提供しています。
本レポートは、現在の市場状況、最新の動向と促進要因、市場環境全般に関する最新の分析を提供します。市場は、高度化・拡張性を備えた製造技術、拡大する臨床パイプラインと治療応用範囲の拡大、増加する投資、進化する規制枠組みによって牽引されています。
本調査は、業界の主要関係者からの情報を含む一次情報と二次情報を客観的に組み合わせて実施されました。本レポートには、主要企業の分析に加え、包括的な市場規模データ、地域別分析を伴うセグメント、ベンダー情勢が含まれています。レポートには過去データと予測データが掲載されています。
| 市場範囲 | |
|---|---|
| 基準年 | 2026年 |
| 終了年 | 2030年 |
| 予測期間 | 2026年~2030年 |
| 成長モメンタム | 加速 |
| 前年比2026年 | 17% |
| CAGR | 19.6% |
| 増分額 | 4億862万800米ドル |
本調査では、今後数年間における世界のエクソソーム治療薬市場の成長を牽引する主要な要因の一つとして、ドラッグデリバリーシステムとしてのエクソソームの拡大を挙げています。また、企業とヘルスケア機関との提携・協力関係の増加、ならびにトランスレーショナル・ナノメディシン向け人工エクソソームの開発が進むことで、市場において相当な需要が見込まれます。
目次
第1章 エグゼクティブサマリー
- 市場概要
第2章 Technavio分析
- 価格反応性・ライフサイクル・顧客購入バスケット・採用率・購入基準の分析
- インプットの重要性と差別化の要因
- 混乱の要因
- 促進要因と課題の影響
第3章 市場情勢
- 市場エコシステム
- 市場の特徴
- バリューチェーン分析
第4章 市場規模
- 市場の定義
- 市場セグメント分析
- 市場規模、2025年
- 市場の見通し、2025年~2030年
第5章 市場規模実績
- 世界のエクソソーム治療薬市場、2020年~2024年
- 用途別セグメント分析、2020年~2024年
- 流通チャネルセグメント分析、2020年~2024年
- タイプセグメント分析、2020年~2024年
- 地域別セグメント分析、2020年~2024年
- 国別セグメント分析、2020年~2024年
第6章 定性分析
- 世界のエクソソーム治療薬市場へのAIの影響
第7章 ファイブフォース分析
- ファイブフォースの要約
- 買い手の交渉力
- 供給企業の交渉力
- 新規参入業者の脅威
- 代替品の脅威
- 競争の脅威
- 市況
第8章 市場セグメンテーション:用途別
- 市場セグメント
- 比較:用途別
- がん治療:市場規模と予測、2025年~2030年
- 自己免疫疾患:市場規模と予測、2025年~2030年
- 感染症:市場規模と予測、2025年~2030年
- その他:市場規模と予測、2025年~2030年
- 市場機会:用途別
第9章 市場セグメンテーション:流通チャネル別
- 市場セグメント
- 比較:流通チャネル別
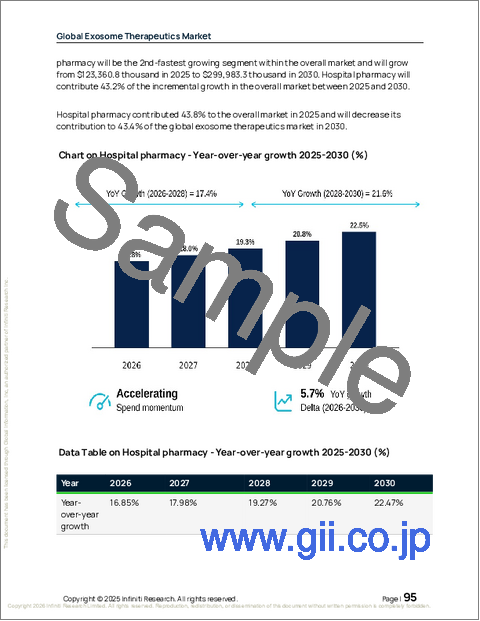
- 病院薬局:市場規模と予測、2025年~2030年
- 小売薬局:市場規模と予測、2025年~2030年
- オンライン薬局:市場規模と予測、2025年~2030年
- 市場機会:流通チャネル別
第10章 市場セグメンテーション:タイプ別
- 市場セグメント
- 比較:タイプ別
- 同種移植:市場規模と予測、2025年~2030年
- 自家移植:市場規模と予測、2025年~2030年
- 市場機会:タイプ別
第11章 顧客情勢
- 顧客情勢の概要
第12章 地域別情勢
- 地域別セグメンテーション
- 地域別比較
- 北米:市場規模と予測、2025年~2030年
- 欧州:市場規模と予測、2025年~2030年
- アジア:市場規模と予測、2025年~2030年
- 世界のその他の地域:市場規模と予測、2025年~2030年
- 市場機会:地域別
第13章 促進要因、課題、機会
- 市場促進要因
- 市場の課題
- 促進要因と課題の影響
- 市場機会
第14章 競合情勢
- 概要
- 競合情勢
- 混乱の状況
- 業界のリスク
第15章 競合分析
- 企業プロファイル
- 企業ランキング指標
- 企業の市場ポジショニング
- Aegle Therapeutics
- Aruna Bio Inc.
- Capricor Therapeutics Inc.
- CIloa SAS
- Creative Biolabs
- Cytiva
- Direct Biologics LLC
- Evox Therapeutics Ltd.
- ExoCoBio Inc.
- ILIAS Biologics Inc.
- Lonza Group Ltd.
- NanoFCM Co. Ltd
- ReNeuron Group plc
- Rion Inc.
- Thermo Fisher Scientific Inc.

