|
|
市場調査レポート
商品コード
1911154
世界の歯科技工所市場2026-2030年Global Dental Laboratory Market 2026-2030 |
||||||
|
|||||||
カスタマイズ可能
|
|||||||

| 世界の歯科技工所市場2026-2030年 |
|
出版日: 2026年01月14日
発行: TechNavio
ページ情報: 英文 303 Pages
納期: 即納可能
|

概要
世界の歯科ラボラトリー市場は、2025年から2030年にかけて152億9,590万米ドルの成長が見込まれ、予測期間中のCAGRは6.6%と予測されています。
本報告書では、世界の歯科ラボラトリー市場に関する包括的な分析、市場規模と予測、動向、成長要因、課題に加え、約25社のベンダー分析を提供しております。
本レポートは、現在の市場状況、最新の動向と促進要因、市場環境全般に関する最新の分析を提供します。市場の成長は、デジタル歯科と先進製造技術の普及、審美歯科・修復歯科に対する世界の需要の高まり、歯科疾患の増加、そして世界の高齢化によって牽引されています。
本調査は、業界の主要関係者からの情報を含む、一次情報と二次情報の客観的な組み合わせを用いて実施されました。本レポートには、主要企業の分析に加え、包括的な市場規模データ、地域別分析を伴うセグメント、ベンダー情勢が含まれています。レポートには過去データと予測データが掲載されています。
| 市場範囲 | |
|---|---|
| 基準年 | 2026年 |
| 終了年 | 2030年 |
| 予測期間 | 2026-2030 |
| 成長モメンタム | 加速 |
| 前年比2026年 | 6.2% |
| CAGR | 6.6% |
| 増分額 | 152億9,590万米ドル |
本調査では、包括的なデジタルワークフローの統合と自動化が、今後数年間における世界の歯科技工所市場成長を牽引する主要な要因の一つであると特定しております。また、設計および品質管理における人工知能の台頭、ならびに生体適合性と審美性に優れた材料における革新が、市場において相当な需要を生み出すものと見込まれます。
目次
第1章 エグゼクティブサマリー
- 市場概要
第2章 Technavio分析
- 価格・ライフサイクル・顧客購入バスケット・採用率・購入基準の分析
- インプットの重要性と差別化の要因
- 混乱の要因
- 促進要因と課題の影響
第3章 市場情勢
- 市場エコシステム
- 市場の特徴
- バリューチェーン分析
第4章 市場規模
- 市場の定義
- 市場セグメント分析
- 市場規模 2025
- 市場の見通し 2025-2030
第5章 市場規模実績
- 世界の歯科技工所市場 2020-2024
- 製品セグメント分析 2020-2024
- デバイスセグメント分析 2020-2024
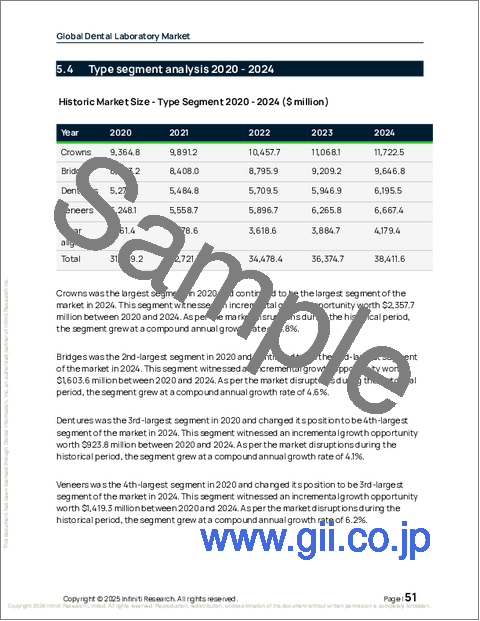
- タイプセグメント分析 2020-2024
- 地域別セグメント分析 2020-2024
- 国別セグメント分析 2020-2024
第6章 ファイブフォース分析
- ファイブフォースの要約
- 買い手の交渉力
- 供給企業の交渉力
- 新規参入業者の脅威
- 代替品の脅威
- 競争の脅威
- 市況
第7章 市場セグメンテーション:製品別
- 市場セグメント
- 比較:製品別
- 口腔ケア:市場規模と予測 2025-2030
- 修復歯科:市場規模と予測 2025-2030
- 歯内療法:市場規模と予測 2025-2030
- インプラント:市場規模と予測 2025-2030
- 矯正歯科:市場規模と予測 2025-2030
- 市場機会:製品別
第8章 市場セグメンテーション:デバイス別
- 市場セグメント
- 比較:デバイス別
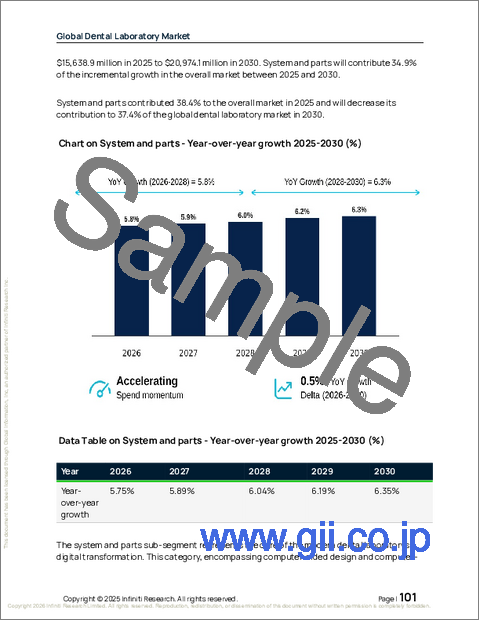
- システムおよび部品:市場規模と予測 2025-2030
- 歯科用放射線機器:市場規模と予測 2025-2030
- 歯科用レーザー:市場規模と予測 2025-2030
- その他:市場規模と予測 2025-2030
- 市場機会:デバイス別
第9章 市場セグメンテーション:タイプ別
- 市場セグメント
- 比較:タイプ別
- クラウン:市場規模と予測 2025-2030
- ブリッジ:市場規模と予測 2025-2030
- ベニア:市場規模と予測 2025-2030
- 義歯:市場規模と予測 2025-2030
- クリアアライナー:市場規模と予測 2025-2030
- 市場機会:タイプ別
第10章 顧客情勢
- 顧客情勢の概要
第11章 地域別情勢
- 地域別セグメンテーション
- 地域別比較
- 北米:市場規模と予測 2025-2030
- 欧州:市場規模と予測 2025-2030
- アジア:市場規模と予測 2025-2030
- 世界のその他の地域:市場規模と予測 2025-2030
- 市場機会:地域別
第12章 促進要因、課題、および機会
- 市場促進要因
- 市場の課題
- 促進要因と課題の影響
- 市場機会
第13章 競合情勢
- 概要
- 競合情勢
- 混乱の状況
- 業界のリスク
第14章 競合分析
- 企業プロファイル
- 企業ランキング指標
- 企業の市場ポジショニング
- 3M Co.
- Amann Girrbach AG
- BEGO GmbH and Co. KG
- Dentsply Sirona Inc.
- Envista Holdings Corp.
- GC Corp.
- Ivoclar Vivadent AG
- Micerium SpA
- Mitsui Chemicals Inc.
- Nakanishi Dental Laboratory Inc.
- Planmeca Oy
- Shofu Inc.
- Stratasys Ltd.
- VITA Zahnfabrik
- VOCO GmbH

