|
|
市場調査レポート
商品コード
1756598
ウランの世界市場 2025-2029Global Uranium Market 2025-2029 |
||||||

|
|||||||
カスタマイズ可能
|
|||||||

| ウランの世界市場 2025-2029 |
|
出版日: 2025年06月12日
発行: TechNavio
ページ情報: 英文 216 Pages
納期: 即納可能
|

全表示
- 概要
- 図表
- 目次
ウラン市場は2024-2029年に21億7,530万米ドル、予測期間中のCAGRは8.2%で成長すると予測されます。
当レポートでは、ウラン市場の全体的な分析、市場規模・予測、動向、成長促進要因、課題、約25のベンダーを網羅したベンダー分析などを掲載しています。
現在の市場シナリオ、最新動向と促進要因、市場環境全体に関する最新分析を提供しています。核兵器へのウラン採用の増加、原子力発電への依存度の増加、ウラン採掘プロジェクトの増加などが市場を牽引しています。
| 市場範囲 | |
|---|---|
| 基準年 | 2025 |
| 終了年 | 2029 |
| 予測期間 | 2025-2029 |
| 成長モメンタム | 加速 |
| 前年比 | 7.6% |
| CAGR | 8.2% |
| 増分額 | 21億7,530万米ドル |
本調査は、業界の主要参加者からのインプットを含め、一次情報と二次情報を客観的に組み合わせて実施しました。レポートには、主要企業の分析に加え、包括的な市場規模データ、地域別分析によるセグメント、ベンダー情勢が含まれています。レポートには過去データと予測データがあります。
本調査では、今後数年間のウラン市場の成長を促進する主な理由の1つとして、原子炉の採用増加を挙げています。また、ウラン採掘における自動化設備の採用増加、戦略的提携やM&Aの増加が、市場の大きな需要につながるでしょう。
目次
第1章 エグゼクティブサマリー
- 市場概要
第2章 Technavio分析
- 価格・ライフサイクル・顧客購入バスケット・採用率・購入基準の分析
- インプットの重要性と差別化の要因
- 混乱の要因
- 促進要因と課題の影響
第3章 市場情勢
- 市場エコシステム
- 市場の特徴
- バリューチェーン分析
第4章 市場規模
- 市場の定義
- 市場セグメント分析
- 市場規模 2024
- 市場の見通し 2024-2029
第5章 市場規模実績
- ウランの世界市場 2019-2023
- エンドユーザーセグメント分析 2019-2023
- ソースセグメント分析 2019-2023
- 用途別セグメント分析 2019-2023
- 地域別セグメント分析 2019-2023
- 国別セグメント分析 2019-2023
第6章 定性分析
- AIの影響:ウランの世界市場
第7章 ファイブフォース分析
- ファイブフォースの要約
- 買い手の交渉力
- 供給企業の交渉力
- 新規参入業者の脅威
- 代替品の脅威
- 競争の脅威
- 市況
第8章 市場セグメンテーション:エンドユーザー別
- 市場セグメント
- 比較:エンドユーザー別
- エネルギー:市場規模と予測 2024-2029
- 軍隊:市場規模と予測 2024-2029
- その他:市場規模と予測 2024-2029
- 市場機会:エンドユーザー別
第9章 市場セグメンテーション:ソース別
- 市場セグメント
- 比較:ソース別
- 主要な:市場規模と予測 2024-2029
- 二次:市場規模と予測 2024-2029
- 市場機会:ソース別
第10章 市場セグメンテーション:用途別
- 市場セグメント
- 比較:用途別
- 工業用カウンターウェイト:市場規模と予測 2024-2029
- 放射線遮蔽:市場規模と予測 2024-2029
- 医療用同位元素:市場規模と予測 2024-2029
- 市場機会:用途別
第11章 顧客情勢
- 顧客情勢の概要
第12章 地域別情勢
- 地域別セグメンテーション
- 地域別比較
- 北米:市場規模と予測 2024-2029
- 欧州:市場規模と予測 2024-2029
- アジア太平洋:市場規模と予測 2024-2029
- 中東・アフリカ:市場規模と予測 2024-2029
- 南米:市場規模と予測 2024-2029
- 米国:市場規模と予測 2024-2029
- カナダ:市場規模と予測 2024-2029
- カザフスタン:市場規模と予測 2024-2029
- ロシア:市場規模と予測 2024-2029
- ウクライナ:市場規模と予測 2024-2029
- オーストラリア:市場規模と予測 2024-2029
- 中国:市場規模と予測 2024-2029
- インド:市場規模と予測 2024-2029
- メキシコ:市場規模と予測 2024-2029
- ドイツ:市場規模と予測 2024-2029
- 市場機会:地域情勢別
第13章 促進要因・課題・機会・抑制要因
- 市場促進要因
- 市場の課題
- 促進要因と課題の影響
- 市場の機会・抑制要因
第14章 競合情勢
- 概要
- 競合情勢
- 混乱の状況
- 業界のリスク
第15章 競合分析
- 企業プロファイル
- 企業ランキング指数
- 企業の市場ポジショニング
- A Cap Energy Ltd.
- Aurora Energy Metals
- Berkeley Energia Ltd.
- Cameco Corp.
- CGN Mining Co. Ltd.
- China National Nuclear Corp.
- Deep Yellow Ltd.
- Denison Mines Corp.
- Energy Fuels Inc.
- NAC Kazatomprom JSC
- Orano
- Peninsula Energy Ltd.
- State Enterprise Eastern Mining and Processing Plant
- Sumitomo Corp.
- Uranium Energy Corp.
第16章 付録
Exhibits:
- Exhibits1: Executive Summary - Chart on Market Overview
- Exhibits2: Executive Summary - Data Table on Market Overview
- Exhibits3: Executive Summary - Chart on Global Market Characteristics
- Exhibits4: Executive Summary - Chart on Market By Geographical Landscape
- Exhibits5: Executive Summary - Chart on Market Segmentation by End-user
- Exhibits6: Executive Summary - Chart on Market Segmentation by Source
- Exhibits7: Executive Summary - Chart on Market Segmentation by Application
- Exhibits8: Executive Summary - Chart on Incremental Growth
- Exhibits9: Executive Summary - Data Table on Incremental Growth
- Exhibits10: Executive Summary - Chart on Company Market Positioning
- Exhibits11: Analysis of price sensitivity, lifecycle, customer purchase basket, adoption rates, and purchase criteria
- Exhibits12: Overview on criticality of inputs and factors of differentiation
- Exhibits13: Overview on factors of disruption
- Exhibits14: Impact of drivers and challenges in 2024 and 2029
- Exhibits15: Parent Market
- Exhibits16: Data Table on - Parent Market
- Exhibits17: Market characteristics analysis
- Exhibits18: Value chain analysis
- Exhibits19: Offerings of companies included in the market definition
- Exhibits20: Market segments
- Exhibits21: Chart on Global - Market size and forecast 2024-2029 ($ million)
- Exhibits22: Data Table on Global - Market size and forecast 2024-2029 ($ million)
- Exhibits23: Chart on Global Market: Year-over-year growth 2024-2029 (%)
- Exhibits24: Data Table on Global Market: Year-over-year growth 2024-2029 (%)
- Exhibits25: Historic Market Size - Data Table on Global Uranium Market 2019 - 2023 ($ million)
- Exhibits26: Historic Market Size - End-user Segment 2019 - 2023 ($ million)
- Exhibits27: Historic Market Size - Source Segment 2019 - 2023 ($ million)
- Exhibits28: Historic Market Size - Application Segment 2019 - 2023 ($ million)
- Exhibits29: Historic Market Size - Geography Segment 2019 - 2023 ($ million)
- Exhibits30: Historic Market Size - Country Segment 2019 - 2023 ($ million)
- Exhibits31: Five forces analysis - Comparison between 2024 and 2029
- Exhibits32: Bargaining power of buyers - Impact of key factors 2024 and 2029
- Exhibits33: Bargaining power of suppliers - Impact of key factors in 2024 and 2029
- Exhibits34: Threat of new entrants - Impact of key factors in 2024 and 2029
- Exhibits35: Threat of substitutes - Impact of key factors in 2024 and 2029
- Exhibits36: Threat of rivalry - Impact of key factors in 2024 and 2029
- Exhibits37: Chart on Market condition - Five forces 2024 and 2029
- Exhibits38: Chart on End-user - Market share 2024-2029 (%)
- Exhibits39: Data Table on End-user - Market share 2024-2029 (%)
- Exhibits40: Chart on Comparison by End-user
- Exhibits41: Data Table on Comparison by End-user
- Exhibits42: Chart on Energy - Market size and forecast 2024-2029 ($ million)
- Exhibits43: Data Table on Energy - Market size and forecast 2024-2029 ($ million)
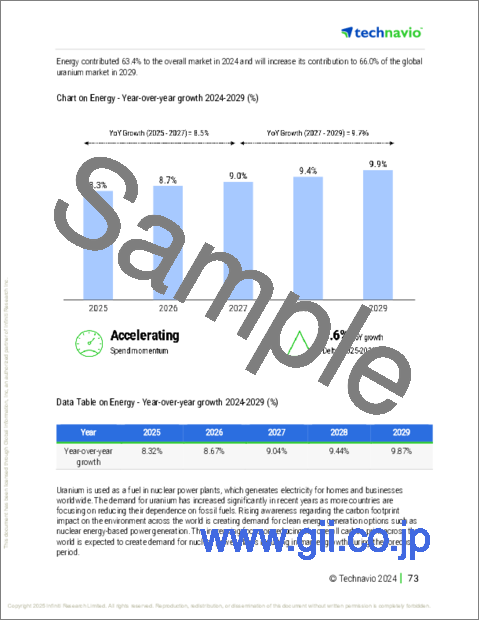
- Exhibits44: Chart on Energy - Year-over-year growth 2024-2029 (%)
- Exhibits45: Data Table on Energy - Year-over-year growth 2024-2029 (%)
- Exhibits46: Chart on Military - Market size and forecast 2024-2029 ($ million)
- Exhibits47: Data Table on Military - Market size and forecast 2024-2029 ($ million)
- Exhibits48: Chart on Military - Year-over-year growth 2024-2029 (%)
- Exhibits49: Data Table on Military - Year-over-year growth 2024-2029 (%)
- Exhibits50: Chart on Others - Market size and forecast 2024-2029 ($ million)
- Exhibits51: Data Table on Others - Market size and forecast 2024-2029 ($ million)
- Exhibits52: Chart on Others - Year-over-year growth 2024-2029 (%)
- Exhibits53: Data Table on Others - Year-over-year growth 2024-2029 (%)
- Exhibits54: Market opportunity by End-user ($ million)
- Exhibits55: Data Table on Market opportunity by End-user ($ million)
- Exhibits56: Chart on Source - Market share 2024-2029 (%)
- Exhibits57: Data Table on Source - Market share 2024-2029 (%)
- Exhibits58: Chart on Comparison by Source
- Exhibits59: Data Table on Comparison by Source
- Exhibits60: Chart on Primary - Market size and forecast 2024-2029 ($ million)
- Exhibits61: Data Table on Primary - Market size and forecast 2024-2029 ($ million)
- Exhibits62: Chart on Primary - Year-over-year growth 2024-2029 (%)
- Exhibits63: Data Table on Primary - Year-over-year growth 2024-2029 (%)
- Exhibits64: Chart on Secondary - Market size and forecast 2024-2029 ($ million)
- Exhibits65: Data Table on Secondary - Market size and forecast 2024-2029 ($ million)
- Exhibits66: Chart on Secondary - Year-over-year growth 2024-2029 (%)
- Exhibits67: Data Table on Secondary - Year-over-year growth 2024-2029 (%)
- Exhibits68: Market opportunity by Source ($ million)
- Exhibits69: Data Table on Market opportunity by Source ($ million)
- Exhibits70: Chart on Application - Market share 2024-2029 (%)
- Exhibits71: Data Table on Application - Market share 2024-2029 (%)
- Exhibits72: Chart on Comparison by Application
- Exhibits73: Data Table on Comparison by Application
- Exhibits74: Chart on Industrial counterweights - Market size and forecast 2024-2029 ($ million)
- Exhibits75: Data Table on Industrial counterweights - Market size and forecast 2024-2029 ($ million)
- Exhibits76: Chart on Industrial counterweights - Year-over-year growth 2024-2029 (%)
- Exhibits77: Data Table on Industrial counterweights - Year-over-year growth 2024-2029 (%)
- Exhibits78: Chart on Radiation shielding - Market size and forecast 2024-2029 ($ million)
- Exhibits79: Data Table on Radiation shielding - Market size and forecast 2024-2029 ($ million)
- Exhibits80: Chart on Radiation shielding - Year-over-year growth 2024-2029 (%)
- Exhibits81: Data Table on Radiation shielding - Year-over-year growth 2024-2029 (%)
- Exhibits82: Chart on Medical isotopes - Market size and forecast 2024-2029 ($ million)
- Exhibits83: Data Table on Medical isotopes - Market size and forecast 2024-2029 ($ million)
- Exhibits84: Chart on Medical isotopes - Year-over-year growth 2024-2029 (%)
- Exhibits85: Data Table on Medical isotopes - Year-over-year growth 2024-2029 (%)
- Exhibits86: Market opportunity by Application ($ million)
- Exhibits87: Data Table on Market opportunity by Application ($ million)
- Exhibits88: Analysis of price sensitivity, lifecycle, customer purchase basket, adoption rates, and purchase criteria
- Exhibits89: Chart on Market share By Geographical Landscape 2024-2029 (%)
- Exhibits90: Data Table on Market share By Geographical Landscape 2024-2029 (%)
- Exhibits91: Chart on Geographic comparison
- Exhibits92: Data Table on Geographic comparison
- Exhibits93: Chart on North America - Market size and forecast 2024-2029 ($ million)
- Exhibits94: Data Table on North America - Market size and forecast 2024-2029 ($ million)
- Exhibits95: Chart on North America - Year-over-year growth 2024-2029 (%)
- Exhibits96: Data Table on North America - Year-over-year growth 2024-2029 (%)
- Exhibits97: Chart on Europe - Market size and forecast 2024-2029 ($ million)
- Exhibits98: Data Table on Europe - Market size and forecast 2024-2029 ($ million)
- Exhibits99: Chart on Europe - Year-over-year growth 2024-2029 (%)
- Exhibits100: Data Table on Europe - Year-over-year growth 2024-2029 (%)
- Exhibits101: Chart on APAC - Market size and forecast 2024-2029 ($ million)
- Exhibits102: Data Table on APAC - Market size and forecast 2024-2029 ($ million)
- Exhibits103: Chart on APAC - Year-over-year growth 2024-2029 (%)
- Exhibits104: Data Table on APAC - Year-over-year growth 2024-2029 (%)
- Exhibits105: Chart on Middle East and Africa - Market size and forecast 2024-2029 ($ million)
- Exhibits106: Data Table on Middle East and Africa - Market size and forecast 2024-2029 ($ million)
- Exhibits107: Chart on Middle East and Africa - Year-over-year growth 2024-2029 (%)
- Exhibits108: Data Table on Middle East and Africa - Year-over-year growth 2024-2029 (%)
- Exhibits109: Chart on South America - Market size and forecast 2024-2029 ($ million)
- Exhibits110: Data Table on South America - Market size and forecast 2024-2029 ($ million)
- Exhibits111: Chart on South America - Year-over-year growth 2024-2029 (%)
- Exhibits112: Data Table on South America - Year-over-year growth 2024-2029 (%)
- Exhibits113: Chart on US - Market size and forecast 2024-2029 ($ million)
- Exhibits114: Data Table on US - Market size and forecast 2024-2029 ($ million)
- Exhibits115: Chart on US - Year-over-year growth 2024-2029 (%)
- Exhibits116: Data Table on US - Year-over-year growth 2024-2029 (%)
- Exhibits117: Chart on Canada - Market size and forecast 2024-2029 ($ million)
- Exhibits118: Data Table on Canada - Market size and forecast 2024-2029 ($ million)
- Exhibits119: Chart on Canada - Year-over-year growth 2024-2029 (%)
- Exhibits120: Data Table on Canada - Year-over-year growth 2024-2029 (%)
- Exhibits121: Chart on Kazakhstan - Market size and forecast 2024-2029 ($ million)
- Exhibits122: Data Table on Kazakhstan - Market size and forecast 2024-2029 ($ million)
- Exhibits123: Chart on Kazakhstan - Year-over-year growth 2024-2029 (%)
- Exhibits124: Data Table on Kazakhstan - Year-over-year growth 2024-2029 (%)
- Exhibits125: Chart on Russia - Market size and forecast 2024-2029 ($ million)
- Exhibits126: Data Table on Russia - Market size and forecast 2024-2029 ($ million)
- Exhibits127: Chart on Russia - Year-over-year growth 2024-2029 (%)
- Exhibits128: Data Table on Russia - Year-over-year growth 2024-2029 (%)
- Exhibits129: Chart on Ukraine - Market size and forecast 2024-2029 ($ million)
- Exhibits130: Data Table on Ukraine - Market size and forecast 2024-2029 ($ million)
- Exhibits131: Chart on Ukraine - Year-over-year growth 2024-2029 (%)
- Exhibits132: Data Table on Ukraine - Year-over-year growth 2024-2029 (%)
- Exhibits133: Chart on Australia - Market size and forecast 2024-2029 ($ million)
- Exhibits134: Data Table on Australia - Market size and forecast 2024-2029 ($ million)
- Exhibits135: Chart on Australia - Year-over-year growth 2024-2029 (%)
- Exhibits136: Data Table on Australia - Year-over-year growth 2024-2029 (%)
- Exhibits137: Chart on China - Market size and forecast 2024-2029 ($ million)
- Exhibits138: Data Table on China - Market size and forecast 2024-2029 ($ million)
- Exhibits139: Chart on China - Year-over-year growth 2024-2029 (%)
- Exhibits140: Data Table on China - Year-over-year growth 2024-2029 (%)
- Exhibits141: Chart on India - Market size and forecast 2024-2029 ($ million)
- Exhibits142: Data Table on India - Market size and forecast 2024-2029 ($ million)
- Exhibits143: Chart on India - Year-over-year growth 2024-2029 (%)
- Exhibits144: Data Table on India - Year-over-year growth 2024-2029 (%)
- Exhibits145: Chart on Mexico - Market size and forecast 2024-2029 ($ million)
- Exhibits146: Data Table on Mexico - Market size and forecast 2024-2029 ($ million)
- Exhibits147: Chart on Mexico - Year-over-year growth 2024-2029 (%)
- Exhibits148: Data Table on Mexico - Year-over-year growth 2024-2029 (%)
- Exhibits149: Chart on Germany - Market size and forecast 2024-2029 ($ million)
- Exhibits150: Data Table on Germany - Market size and forecast 2024-2029 ($ million)
- Exhibits151: Chart on Germany - Year-over-year growth 2024-2029 (%)
- Exhibits152: Data Table on Germany - Year-over-year growth 2024-2029 (%)
- Exhibits153: Market opportunity By Geographical Landscape ($ million)
- Exhibits154: Data Tables on Market opportunity By Geographical Landscape ($ million)
- Exhibits155: Impact of drivers and challenges in 2024 and 2029
- Exhibits156: Overview on criticality of inputs and factors of differentiation
- Exhibits157: Overview on factors of disruption
- Exhibits158: Impact of key risks on business
- Exhibits159: Companies covered
- Exhibits160: Company ranking index
- Exhibits161: Matrix on companies position and classification
- Exhibits162: A Cap Energy Ltd. - Overview
- Exhibits163: A Cap Energy Ltd. - Product / Service
- Exhibits164: A Cap Energy Ltd. - Key offerings
- Exhibits165: SWOT
- Exhibits166: Aurora Energy Metals - Overview
- Exhibits167: Aurora Energy Metals - Product / Service
- Exhibits168: Aurora Energy Metals - Key offerings
- Exhibits169: SWOT
- Exhibits170: Berkeley Energia Ltd. - Overview
- Exhibits171: Berkeley Energia Ltd. - Product / Service
- Exhibits172: Berkeley Energia Ltd. - Key offerings
- Exhibits173: SWOT
- Exhibits174: Cameco Corp. - Overview
- Exhibits175: Cameco Corp. - Business segments
- Exhibits176: Cameco Corp. - Key offerings
- Exhibits177: Cameco Corp. - Segment focus
- Exhibits178: SWOT
- Exhibits179: CGN Mining Co. Ltd. - Overview
- Exhibits180: CGN Mining Co. Ltd. - Business segments
- Exhibits181: CGN Mining Co. Ltd. - Key offerings
- Exhibits182: CGN Mining Co. Ltd. - Segment focus
- Exhibits183: SWOT
- Exhibits184: China National Nuclear Corp. - Overview
- Exhibits185: China National Nuclear Corp. - Product / Service
- Exhibits186: China National Nuclear Corp. - Key offerings
- Exhibits187: SWOT
- Exhibits188: Deep Yellow Ltd. - Overview
- Exhibits189: Deep Yellow Ltd. - Product / Service
- Exhibits190: Deep Yellow Ltd. - Key offerings
- Exhibits191: SWOT
- Exhibits192: Denison Mines Corp. - Overview
- Exhibits193: Denison Mines Corp. - Product / Service
- Exhibits194: Denison Mines Corp. - Key offerings
- Exhibits195: SWOT
- Exhibits196: Energy Fuels Inc. - Overview
- Exhibits197: Energy Fuels Inc. - Product / Service
- Exhibits198: Energy Fuels Inc. - Key offerings
- Exhibits199: SWOT
- Exhibits200: NAC Kazatomprom JSC - Overview
- Exhibits201: NAC Kazatomprom JSC - Business segments
- Exhibits202: NAC Kazatomprom JSC - Key offerings
- Exhibits203: NAC Kazatomprom JSC - Segment focus
- Exhibits204: SWOT
- Exhibits205: Orano - Overview
- Exhibits206: Orano - Business segments
- Exhibits207: Orano - Key offerings
- Exhibits208: Orano - Segment focus
- Exhibits209: SWOT
- Exhibits210: Peninsula Energy Ltd. - Overview
- Exhibits211: Peninsula Energy Ltd. - Product / Service
- Exhibits212: Peninsula Energy Ltd. - Key offerings
- Exhibits213: SWOT
- Exhibits214: State Enterprise Eastern Mining and Processing Plant - Overview
- Exhibits215: State Enterprise Eastern Mining and Processing Plant - Product / Service
- Exhibits216: State Enterprise Eastern Mining and Processing Plant - Key offerings
- Exhibits217: SWOT
- Exhibits218: Sumitomo Corp. - Overview
- Exhibits219: Sumitomo Corp. - Business segments
- Exhibits220: Sumitomo Corp. - Key offerings
- Exhibits221: Sumitomo Corp. - Segment focus
- Exhibits222: SWOT
- Exhibits223: Uranium Energy Corp. - Overview
- Exhibits224: Uranium Energy Corp. - Product / Service
- Exhibits225: Uranium Energy Corp. - Key offerings
- Exhibits226: SWOT
- Exhibits227: Inclusions checklist
- Exhibits228: Exclusions checklist
- Exhibits229: Currency conversion rates for US$
- Exhibits230: Research methodology
- Exhibits231: Information sources
- Exhibits232: Data validation
- Exhibits233: Validation techniques employed for market sizing
- Exhibits234: Data synthesis
- Exhibits235: 360 degree market analysis
- Exhibits236: List of abbreviations
The uranium market is forecasted to grow by USD 2,175.3 mn during 2024-2029, accelerating at a CAGR of 8.2% during the forecast period. The report on the uranium market provides a holistic analysis, market size and forecast, trends, growth drivers, and challenges, as well as vendor analysis covering around 25 vendors.
The report offers an up-to-date analysis regarding the current market scenario, the latest trends and drivers, and the overall market environment. The market is driven by rise in adoption of uranium in nuclear weapons, increase in dependency on nuclear power, and rise in number of uranium mining projects.
| Market Scope | |
|---|---|
| Base Year | 2025 |
| End Year | 2029 |
| Series Year | 2025-2029 |
| Growth Momentum | Accelerate |
| YOY 2025 | 7.6% |
| CAGR | 8.2% |
| Incremental Value | $2,175.3 mn |
The study was conducted using an objective combination of primary and secondary information including inputs from key participants in the industry. The report contains a comprehensive market size data, segment with regional analysis and vendor landscape in addition to an analysis of the key companies. Reports have historic and forecast data.
Technavio's uranium market is segmented as below:
By End-user
- Energy
- Military
- Others
By Source
- Primary
- Secondary
By Application
- Industrial counterweights
- Radiation shielding
- Medical isotopes
By Geographical Landscape
- North America
- Europe
- APAC
- Middle East and Africa
- South America
This study identifies the rise in adoption of nuclear reactors as one of the prime reasons driving the uranium market growth during the next few years. Also, increase in adoption of automation facilities in uranium mining and increase in strategic collaboration and mergers and acquisitions will lead to sizable demand in the market.
The report on the uranium market covers the following areas:
- Uranium Market sizing
- Uranium Market forecast
- Uranium Market industry analysis
The robust vendor analysis is designed to help clients improve their market position, and in line with this, this report provides a detailed analysis of several leading uranium market vendors that include A Cap Energy Ltd., Aurora Energy Metals, Berkeley Energia Ltd., Cameco Corp., CGN Mining Co. Ltd., China National Nuclear Corp., Deep Yellow Ltd., Denison Mines Corp., Energy Fuels Inc., NAC Kazatomprom JSC, Orano, Peninsula Energy Ltd., Rio Tinto Ltd., State Atomic Energy Corp. Rosatom, State Enterprise Eastern Mining and Processing Plant, Sumitomo Corp., and Uranium Energy Corp.. Also, the uranium market analysis report includes information on upcoming trends and challenges that will influence market growth. This is to help companies strategize and leverage all forthcoming growth opportunities.
The publisher presents a detailed picture of the market by the way of study, synthesis, and summation of data from multiple sources by an analysis of key parameters such as profit, pricing, competition, and promotions. It presents various market facets by identifying the key industry influencers. The data presented is comprehensive, reliable, and a result of extensive primary and secondary research. The market research reports provide a complete competitive landscape and an in-depth vendor selection methodology and analysis using qualitative and quantitative research to forecast accurate market growth.
Table of Contents
1 Executive Summary
- 1.1 Market overview
- Executive Summary - Chart on Market Overview
- Executive Summary - Data Table on Market Overview
- Executive Summary - Chart on Global Market Characteristics
- Executive Summary - Chart on Market By Geographical Landscape
- Executive Summary - Chart on Market Segmentation by End-user
- Executive Summary - Chart on Market Segmentation by Source
- Executive Summary - Chart on Market Segmentation by Application
- Executive Summary - Chart on Incremental Growth
- Executive Summary - Data Table on Incremental Growth
- Executive Summary - Chart on Company Market Positioning
2 Technavio Analysis
- 2.1 Analysis of price sensitivity, lifecycle, customer purchase basket, adoption rates, and purchase criteria
- Analysis of price sensitivity, lifecycle, customer purchase basket, adoption rates, and purchase criteria
- 2.2 Criticality of inputs and Factors of differentiation
- Overview on criticality of inputs and factors of differentiation
- 2.3 Factors of disruption
- Overview on factors of disruption
- 2.4 Impact of drivers and challenges
- Impact of drivers and challenges in 2024 and 2029
3 Market Landscape
- 3.1 Market ecosystem
- Parent Market
- Data Table on - Parent Market
- 3.2 Market characteristics
- Market characteristics analysis
- 3.3 Value chain analysis
- Value chain analysis
4 Market Sizing
- 4.1 Market definition
- Offerings of companies included in the market definition
- 4.2 Market segment analysis
- Market segments
- 4.3 Market size 2024
- 4.4 Market outlook: Forecast for 2024-2029
- Chart on Global - Market size and forecast 2024-2029 ($ million)
- Data Table on Global - Market size and forecast 2024-2029 ($ million)
- Chart on Global Market: Year-over-year growth 2024-2029 (%)
- Data Table on Global Market: Year-over-year growth 2024-2029 (%)
5 Historic Market Size
- 5.1 Global Uranium Market 2019 - 2023
- Historic Market Size - Data Table on Global Uranium Market 2019 - 2023 ($ million)
- 5.2 End-user segment analysis 2019 - 2023
- Historic Market Size - End-user Segment 2019 - 2023 ($ million)
- 5.3 Source segment analysis 2019 - 2023
- Historic Market Size - Source Segment 2019 - 2023 ($ million)
- 5.4 Application segment analysis 2019 - 2023
- Historic Market Size - Application Segment 2019 - 2023 ($ million)
- 5.5 Geography segment analysis 2019 - 2023
- Historic Market Size - Geography Segment 2019 - 2023 ($ million)
- 5.6 Country segment analysis 2019 - 2023
- Historic Market Size - Country Segment 2019 - 2023 ($ million)
6 Qualitative Analysis
- 6.1 The AI impact on global uranium market
7 Five Forces Analysis
- 7.1 Five forces summary
- Five forces analysis - Comparison between 2024 and 2029
- 7.2 Bargaining power of buyers
- Bargaining power of buyers - Impact of key factors 2024 and 2029
- 7.3 Bargaining power of suppliers
- Bargaining power of suppliers - Impact of key factors in 2024 and 2029
- 7.4 Threat of new entrants
- Threat of new entrants - Impact of key factors in 2024 and 2029
- 7.5 Threat of substitutes
- Threat of substitutes - Impact of key factors in 2024 and 2029
- 7.6 Threat of rivalry
- Threat of rivalry - Impact of key factors in 2024 and 2029
- 7.7 Market condition
- Chart on Market condition - Five forces 2024 and 2029
8 Market Segmentation by End-user
- 8.1 Market segments
- Chart on End-user - Market share 2024-2029 (%)
- Data Table on End-user - Market share 2024-2029 (%)
- 8.2 Comparison by End-user
- Chart on Comparison by End-user
- Data Table on Comparison by End-user
- 8.3 Energy - Market size and forecast 2024-2029
- Chart on Energy - Market size and forecast 2024-2029 ($ million)
- Data Table on Energy - Market size and forecast 2024-2029 ($ million)
- Chart on Energy - Year-over-year growth 2024-2029 (%)
- Data Table on Energy - Year-over-year growth 2024-2029 (%)
- 8.4 Military - Market size and forecast 2024-2029
- Chart on Military - Market size and forecast 2024-2029 ($ million)
- Data Table on Military - Market size and forecast 2024-2029 ($ million)
- Chart on Military - Year-over-year growth 2024-2029 (%)
- Data Table on Military - Year-over-year growth 2024-2029 (%)
- 8.5 Others - Market size and forecast 2024-2029
- Chart on Others - Market size and forecast 2024-2029 ($ million)
- Data Table on Others - Market size and forecast 2024-2029 ($ million)
- Chart on Others - Year-over-year growth 2024-2029 (%)
- Data Table on Others - Year-over-year growth 2024-2029 (%)
- 8.6 Market opportunity by End-user
- Market opportunity by End-user ($ million)
- Data Table on Market opportunity by End-user ($ million)
9 Market Segmentation by Source
- 9.1 Market segments
- Chart on Source - Market share 2024-2029 (%)
- Data Table on Source - Market share 2024-2029 (%)
- 9.2 Comparison by Source
- Chart on Comparison by Source
- Data Table on Comparison by Source
- 9.3 Primary - Market size and forecast 2024-2029
- Chart on Primary - Market size and forecast 2024-2029 ($ million)
- Data Table on Primary - Market size and forecast 2024-2029 ($ million)
- Chart on Primary - Year-over-year growth 2024-2029 (%)
- Data Table on Primary - Year-over-year growth 2024-2029 (%)
- 9.4 Secondary - Market size and forecast 2024-2029
- Chart on Secondary - Market size and forecast 2024-2029 ($ million)
- Data Table on Secondary - Market size and forecast 2024-2029 ($ million)
- Chart on Secondary - Year-over-year growth 2024-2029 (%)
- Data Table on Secondary - Year-over-year growth 2024-2029 (%)
- 9.5 Market opportunity by Source
- Market opportunity by Source ($ million)
- Data Table on Market opportunity by Source ($ million)
10 Market Segmentation by Application
- 10.1 Market segments
- Chart on Application - Market share 2024-2029 (%)
- Data Table on Application - Market share 2024-2029 (%)
- 10.2 Comparison by Application
- Chart on Comparison by Application
- Data Table on Comparison by Application
- 10.3 Industrial counterweights - Market size and forecast 2024-2029
- Chart on Industrial counterweights - Market size and forecast 2024-2029 ($ million)
- Data Table on Industrial counterweights - Market size and forecast 2024-2029 ($ million)
- Chart on Industrial counterweights - Year-over-year growth 2024-2029 (%)
- Data Table on Industrial counterweights - Year-over-year growth 2024-2029 (%)
- 10.4 Radiation shielding - Market size and forecast 2024-2029
- Chart on Radiation shielding - Market size and forecast 2024-2029 ($ million)
- Data Table on Radiation shielding - Market size and forecast 2024-2029 ($ million)
- Chart on Radiation shielding - Year-over-year growth 2024-2029 (%)
- Data Table on Radiation shielding - Year-over-year growth 2024-2029 (%)
- 10.5 Medical isotopes - Market size and forecast 2024-2029
- Chart on Medical isotopes - Market size and forecast 2024-2029 ($ million)
- Data Table on Medical isotopes - Market size and forecast 2024-2029 ($ million)
- Chart on Medical isotopes - Year-over-year growth 2024-2029 (%)
- Data Table on Medical isotopes - Year-over-year growth 2024-2029 (%)
- 10.6 Market opportunity by Application
- Market opportunity by Application ($ million)
- Data Table on Market opportunity by Application ($ million)
11 Customer Landscape
- 11.1 Customer landscape overview
- Analysis of price sensitivity, lifecycle, customer purchase basket, adoption rates, and purchase criteria
12 Geographic Landscape
- 12.1 Geographic segmentation
- Chart on Market share By Geographical Landscape 2024-2029 (%)
- Data Table on Market share By Geographical Landscape 2024-2029 (%)
- 12.2 Geographic comparison
- Chart on Geographic comparison
- Data Table on Geographic comparison
- 12.3 North America - Market size and forecast 2024-2029
- Chart on North America - Market size and forecast 2024-2029 ($ million)
- Data Table on North America - Market size and forecast 2024-2029 ($ million)
- Chart on North America - Year-over-year growth 2024-2029 (%)
- Data Table on North America - Year-over-year growth 2024-2029 (%)
- 12.4 Europe - Market size and forecast 2024-2029
- Chart on Europe - Market size and forecast 2024-2029 ($ million)
- Data Table on Europe - Market size and forecast 2024-2029 ($ million)
- Chart on Europe - Year-over-year growth 2024-2029 (%)
- Data Table on Europe - Year-over-year growth 2024-2029 (%)
- 12.5 APAC - Market size and forecast 2024-2029
- Chart on APAC - Market size and forecast 2024-2029 ($ million)
- Data Table on APAC - Market size and forecast 2024-2029 ($ million)
- Chart on APAC - Year-over-year growth 2024-2029 (%)
- Data Table on APAC - Year-over-year growth 2024-2029 (%)
- 12.6 Middle East and Africa - Market size and forecast 2024-2029
- Chart on Middle East and Africa - Market size and forecast 2024-2029 ($ million)
- Data Table on Middle East and Africa - Market size and forecast 2024-2029 ($ million)
- Chart on Middle East and Africa - Year-over-year growth 2024-2029 (%)
- Data Table on Middle East and Africa - Year-over-year growth 2024-2029 (%)
- 12.7 South America - Market size and forecast 2024-2029
- Chart on South America - Market size and forecast 2024-2029 ($ million)
- Data Table on South America - Market size and forecast 2024-2029 ($ million)
- Chart on South America - Year-over-year growth 2024-2029 (%)
- Data Table on South America - Year-over-year growth 2024-2029 (%)
- 12.8 US - Market size and forecast 2024-2029
- Chart on US - Market size and forecast 2024-2029 ($ million)
- Data Table on US - Market size and forecast 2024-2029 ($ million)
- Chart on US - Year-over-year growth 2024-2029 (%)
- Data Table on US - Year-over-year growth 2024-2029 (%)
- 12.9 Canada - Market size and forecast 2024-2029
- Chart on Canada - Market size and forecast 2024-2029 ($ million)
- Data Table on Canada - Market size and forecast 2024-2029 ($ million)
- Chart on Canada - Year-over-year growth 2024-2029 (%)
- Data Table on Canada - Year-over-year growth 2024-2029 (%)
- 12.10 Kazakhstan - Market size and forecast 2024-2029
- Chart on Kazakhstan - Market size and forecast 2024-2029 ($ million)
- Data Table on Kazakhstan - Market size and forecast 2024-2029 ($ million)
- Chart on Kazakhstan - Year-over-year growth 2024-2029 (%)
- Data Table on Kazakhstan - Year-over-year growth 2024-2029 (%)
- 12.11 Russia - Market size and forecast 2024-2029
- Chart on Russia - Market size and forecast 2024-2029 ($ million)
- Data Table on Russia - Market size and forecast 2024-2029 ($ million)
- Chart on Russia - Year-over-year growth 2024-2029 (%)
- Data Table on Russia - Year-over-year growth 2024-2029 (%)
- 12.12 Ukraine - Market size and forecast 2024-2029
- Chart on Ukraine - Market size and forecast 2024-2029 ($ million)
- Data Table on Ukraine - Market size and forecast 2024-2029 ($ million)
- Chart on Ukraine - Year-over-year growth 2024-2029 (%)
- Data Table on Ukraine - Year-over-year growth 2024-2029 (%)
- 12.13 Australia - Market size and forecast 2024-2029
- Chart on Australia - Market size and forecast 2024-2029 ($ million)
- Data Table on Australia - Market size and forecast 2024-2029 ($ million)
- Chart on Australia - Year-over-year growth 2024-2029 (%)
- Data Table on Australia - Year-over-year growth 2024-2029 (%)
- 12.14 China - Market size and forecast 2024-2029
- Chart on China - Market size and forecast 2024-2029 ($ million)
- Data Table on China - Market size and forecast 2024-2029 ($ million)
- Chart on China - Year-over-year growth 2024-2029 (%)
- Data Table on China - Year-over-year growth 2024-2029 (%)
- 12.15 India - Market size and forecast 2024-2029
- Chart on India - Market size and forecast 2024-2029 ($ million)
- Data Table on India - Market size and forecast 2024-2029 ($ million)
- Chart on India - Year-over-year growth 2024-2029 (%)
- Data Table on India - Year-over-year growth 2024-2029 (%)
- 12.16 Mexico - Market size and forecast 2024-2029
- Chart on Mexico - Market size and forecast 2024-2029 ($ million)
- Data Table on Mexico - Market size and forecast 2024-2029 ($ million)
- Chart on Mexico - Year-over-year growth 2024-2029 (%)
- Data Table on Mexico - Year-over-year growth 2024-2029 (%)
- 12.17 Germany - Market size and forecast 2024-2029
- Chart on Germany - Market size and forecast 2024-2029 ($ million)
- Data Table on Germany - Market size and forecast 2024-2029 ($ million)
- Chart on Germany - Year-over-year growth 2024-2029 (%)
- Data Table on Germany - Year-over-year growth 2024-2029 (%)
- 12.18 Market opportunity By Geographical Landscape
- Market opportunity By Geographical Landscape ($ million)
- Data Tables on Market opportunity By Geographical Landscape ($ million)
13 Drivers, Challenges, and Opportunity/Restraints
- 13.1 Market drivers
- 13.2 Market challenges
- 13.3 Impact of drivers and challenges
- Impact of drivers and challenges in 2024 and 2029
- 13.4 Market opportunities/restraints
14 Competitive Landscape
- 14.1 Overview
- 14.2 Competitive Landscape
- Overview on criticality of inputs and factors of differentiation
- 14.3 Landscape disruption
- Overview on factors of disruption
- 14.4 Industry risks
- Impact of key risks on business
15 Competitive Analysis
- 15.1 Companies profiled
- Companies covered
- 15.2 Company ranking index
- Company ranking index
- 15.3 Market positioning of companies
- Matrix on companies position and classification
- 15.4 A Cap Energy Ltd.
- A Cap Energy Ltd. - Overview
- A Cap Energy Ltd. - Product / Service
- A Cap Energy Ltd. - Key offerings
- SWOT
- 15.5 Aurora Energy Metals
- Aurora Energy Metals - Overview
- Aurora Energy Metals - Product / Service
- Aurora Energy Metals - Key offerings
- SWOT
- 15.6 Berkeley Energia Ltd.
- Berkeley Energia Ltd. - Overview
- Berkeley Energia Ltd. - Product / Service
- Berkeley Energia Ltd. - Key offerings
- SWOT
- 15.7 Cameco Corp.
- Cameco Corp. - Overview
- Cameco Corp. - Business segments
- Cameco Corp. - Key offerings
- Cameco Corp. - Segment focus
- SWOT
- 15.8 CGN Mining Co. Ltd.
- CGN Mining Co. Ltd. - Overview
- CGN Mining Co. Ltd. - Business segments
- CGN Mining Co. Ltd. - Key offerings
- CGN Mining Co. Ltd. - Segment focus
- SWOT
- 15.9 China National Nuclear Corp.
- China National Nuclear Corp. - Overview
- China National Nuclear Corp. - Product / Service
- China National Nuclear Corp. - Key offerings
- SWOT
- 15.10 Deep Yellow Ltd.
- Deep Yellow Ltd. - Overview
- Deep Yellow Ltd. - Product / Service
- Deep Yellow Ltd. - Key offerings
- SWOT
- 15.11 Denison Mines Corp.
- Denison Mines Corp. - Overview
- Denison Mines Corp. - Product / Service
- Denison Mines Corp. - Key offerings
- SWOT
- 15.12 Energy Fuels Inc.
- Energy Fuels Inc. - Overview
- Energy Fuels Inc. - Product / Service
- Energy Fuels Inc. - Key offerings
- SWOT
- 15.13 NAC Kazatomprom JSC
- NAC Kazatomprom JSC - Overview
- NAC Kazatomprom JSC - Business segments
- NAC Kazatomprom JSC - Key offerings
- NAC Kazatomprom JSC - Segment focus
- SWOT
- 15.14 Orano
- Orano - Overview
- Orano - Business segments
- Orano - Key offerings
- Orano - Segment focus
- SWOT
- 15.15 Peninsula Energy Ltd.
- Peninsula Energy Ltd. - Overview
- Peninsula Energy Ltd. - Product / Service
- Peninsula Energy Ltd. - Key offerings
- SWOT
- 15.16 State Enterprise Eastern Mining and Processing Plant
- State Enterprise Eastern Mining and Processing Plant - Overview
- State Enterprise Eastern Mining and Processing Plant - Product / Service
- State Enterprise Eastern Mining and Processing Plant - Key offerings
- SWOT
- 15.17 Sumitomo Corp.
- Sumitomo Corp. - Overview
- Sumitomo Corp. - Business segments
- Sumitomo Corp. - Key offerings
- Sumitomo Corp. - Segment focus
- SWOT
- 15.18 Uranium Energy Corp.
- Uranium Energy Corp. - Overview
- Uranium Energy Corp. - Product / Service
- Uranium Energy Corp. - Key offerings
- SWOT
16 Appendix
- 16.1 Scope of the report
- 16.2 Inclusions and exclusions checklist
- Inclusions checklist
- Exclusions checklist
- 16.3 Currency conversion rates for US$
- Currency conversion rates for US$
- 16.4 Research methodology
- Research methodology
- 16.5 Data procurement
- Information sources
- 16.6 Data validation
- Data validation
- 16.7 Validation techniques employed for market sizing
- Validation techniques employed for market sizing
- 16.8 Data synthesis
- Data synthesis
- 16.9 360 degree market analysis
- 360 degree market analysis
- 16.10 List of abbreviations
- List of abbreviations

