|
|
市場調査レポート
商品コード
1557737
ダンネージ包装の世界市場 2024-2028Global Dunnage Packaging Market 2024-2028 |
||||||
|
|||||||
カスタマイズ可能
|
|||||||

| ダンネージ包装の世界市場 2024-2028 |
|
出版日: 2024年08月02日
発行: TechNavio
ページ情報: 英文 208 Pages
納期: 即納可能
|

全表示
- 概要
- 図表
- 目次
ダンネージ包装市場は2023-2028年に9億8,010万米ドル、予測期間中のCAGRは5.32%で成長すると予測されます。
当レポートでは、ダンネージ包装市場の全体的な分析、市場規模・予測、動向、成長促進要因、課題、約25のベンダーを網羅したベンダー分析などを掲載しています。
現在の市場シナリオ、最新動向と促進要因、市場環境全体に関する最新分析を提供しています。eコマース産業の成長、世界のエンドユーザー産業の拡大、ダンネージ包装の利点に関する認知度の向上が市場を牽引しています。
| 市場範囲 | |
|---|---|
| 基準年 | 2024 |
| 終了年 | 2028 |
| 予測期間 | 2024-2028 |
| 成長モメンタム | 加速 |
| 前年比2024年 | 5.14% |
| CAGR | 5.32% |
| 増分額 | 9億8,010万米ドル |
本調査では、今後数年間のダンネージ包装市場成長を牽引する主な要因として、国際貿易の増加を挙げています。また、環境に優しくリサイクル可能な材料を使用した包装へのシフトや、カスタマイズされたダンネージ包装ソリューションの利用可能性が、市場の大きな需要につながります。
目次
第1章 エグゼクティブサマリー
- 市場概要
第2章 Technavio別分析
- 価格・ライフサイクル・顧客購入バスケット・採用率・購入基準の分析
- インプットの重要性と差別化の要因
- 混乱の要因
- 促進要因と課題の影響
第3章 市場情勢
- 市場エコシステム
- 市場の特徴
- バリューチェーン分析
第4章 市場規模の評価
- 市場の定義
- 市場セグメント分析
- 市場規模 2023
- 市場の見通し 2023-2028
第5章 市場規模実績
- ダンネージ包装の世界市場 2018-2022
- 材料別セグメント分析 2018-2022
- 用途別セグメント分析 2018-2022
- 地域別セグメント分析 2018-2022
- 国別セグメント分析 2018-2022
第6章 付加価値/数量データ
- ダンネージ包装の世界市場:国別2023-2028
第7章 ファイブフォース分析
- ファイブフォースの要約
- 買い手の交渉力
- 供給企業の交渉力
- 新規参入業者の脅威
- 代替品の脅威
- 競争の脅威
- 市況
第8章 市場セグメンテーション:材料別
- 市場セグメンテーション
- 比較:材料別
- プラスチック:市場規模と予測 2023-2028
- 紙:市場規模と予測 2023-2028
- 発泡材:市場規模と予測 2023-2028
- 木材:市場規模と予測 2023-2028
- その他:市場規模と予測 2023-2028
- 市場機会:材料別
第9章 市場セグメンテーション:用途別
- 市場セグメンテーション
- 比較:用途別
- 自動車:市場規模と予測 2023-2028
- 食品および飲料:市場規模と予測 2023-2028
- エレクトロニクス:市場規模と予測 2023-2028
- 消費財:市場規模と予測 2023-2028
- その他:市場規模と予測 2023-2028
- 市場機会:用途別
第10章 顧客情勢
- 顧客情勢の概要
第11章 地域別情勢
- 地域別セグメンテーション
- 地域別比較
- アジア太平洋:市場規模と予測 2023-2028
- 北米:市場規模と予測 2023-2028
- 欧州:市場規模と予測 2023-2028
- 中東・アフリカ:市場規模と予測 2023-2028
- 南米:市場規模と予測 2023-2028
- 米国:市場規模と予測 2023-2028
- 中国:市場規模と予測 2023-2028
- インド:市場規模と予測 2023-2028
- ドイツ:市場規模と予測 2023-2028
- 日本:市場規模と予測 2023-2028
- 英国:市場規模と予測 2023-2028
- 市場機会:地域別
第12章 促進要因・課題・機会・抑制要因
- 市場促進要因
- 市場の課題
- 促進要因と課題の影響
- 市場の機会・抑制要因
第13章 競合情勢
- 概要
- 競合情勢
- 混乱の状況
- 業界のリスク
第14章 競合分析
- 企業プロファイル
- 企業ランキング指数
- 企業の市場ポジショニング
- ALLPACK PACKAGING LTD
- Amatech Inc.
- Corplex
- Dordan Manufacturing Co.
- GWP Group Ltd.
- IPS Packaging and Automation
- MJSolpac Ltd
- NEFAB GROUP
- ORBIS Corp.
- Packaging Corp. of America
- Reusable Transport Packaging
- Salco Engineering Manufacturing Co.
- Signode Industrial Group LLC
- Sonoco Products Co.
- UFP Industries Inc.
第15章 付録
Exhibits:
- Exhibits1: Executive Summary - Chart on Market Overview
- Exhibits2: Executive Summary - Data Table on Market Overview
- Exhibits3: Executive Summary - Chart on Global Market Characteristics
- Exhibits4: Executive Summary - Chart on Market by Geography
- Exhibits5: Executive Summary - Chart on Market Segmentation by Material
- Exhibits6: Executive Summary - Chart on Market Segmentation by Application
- Exhibits7: Executive Summary - Chart on Incremental Growth
- Exhibits8: Executive Summary - Data Table on Incremental Growth
- Exhibits9: Executive Summary - Chart on Company Market Positioning
- Exhibits10: Analysis of price sensitivity, lifecycle, customer purchase basket, adoption rates, and purchase criteria
- Exhibits11: Overview on criticality of inputs and factors of differentiation
- Exhibits12: Overview on factors of disruption
- Exhibits13: Impact of drivers and challenges in 2023 and 2028
- Exhibits14: Parent Market
- Exhibits15: Data Table on - Parent Market
- Exhibits16: Market characteristics analysis
- Exhibits17: Value Chain Analysis
- Exhibits18: Offerings of companies included in the market definition
- Exhibits19: Market segments
- Exhibits20: Chart on Global - Market size and forecast 2023-2028 ($ million)
- Exhibits21: Data Table on Global - Market size and forecast 2023-2028 ($ million)
- Exhibits22: Chart on Global Market: Year-over-year growth 2023-2028 (%)
- Exhibits23: Data Table on Global Market: Year-over-year growth 2023-2028 (%)
- Exhibits24: Historic Market Size - Data Table on Global Dunnage Packaging Market 2018 - 2022 ($ million)
- Exhibits25: Historic Market Size - Material Segment 2018 - 2022 ($ million)
- Exhibits26: Historic Market Size - Application Segment 2018 - 2022 ($ million)
- Exhibits27: Historic Market Size - Geography Segment 2018 - 2022 ($ million)
- Exhibits28: Historic Market Size - Country Segment 2018 - 2022 ($ million)
- Exhibits29: Market Size (value) - Data Table on Global dunnage packaging market by Country 2023 - 2028 ($ million)
- Exhibits30: Five forces analysis - Comparison between 2023 and 2028
- Exhibits31: Bargaining power of buyers - Impact of key factors 2023 and 2028
- Exhibits32: Bargaining power of suppliers - Impact of key factors in 2023 and 2028
- Exhibits33: Threat of new entrants - Impact of key factors in 2023 and 2028
- Exhibits34: Threat of substitutes - Impact of key factors in 2023 and 2028
- Exhibits35: Threat of rivalry - Impact of key factors in 2023 and 2028
- Exhibits36: Chart on Market condition - Five forces 2023 and 2028
- Exhibits37: Chart on Material - Market share 2023-2028 (%)
- Exhibits38: Data Table on Material - Market share 2023-2028 (%)
- Exhibits39: Chart on Comparison by Material
- Exhibits40: Data Table on Comparison by Material
- Exhibits41: Chart on Plastic - Market size and forecast 2023-2028 ($ million)
- Exhibits42: Data Table on Plastic - Market size and forecast 2023-2028 ($ million)
- Exhibits43: Chart on Plastic - Year-over-year growth 2023-2028 (%)
- Exhibits44: Data Table on Plastic - Year-over-year growth 2023-2028 (%)
- Exhibits45: Chart on Paper - Market size and forecast 2023-2028 ($ million)
- Exhibits46: Data Table on Paper - Market size and forecast 2023-2028 ($ million)
- Exhibits47: Chart on Paper - Year-over-year growth 2023-2028 (%)
- Exhibits48: Data Table on Paper - Year-over-year growth 2023-2028 (%)
- Exhibits49: Chart on Foam - Market size and forecast 2023-2028 ($ million)
- Exhibits50: Data Table on Foam - Market size and forecast 2023-2028 ($ million)
- Exhibits51: Chart on Foam - Year-over-year growth 2023-2028 (%)
- Exhibits52: Data Table on Foam - Year-over-year growth 2023-2028 (%)
- Exhibits53: Chart on Wood - Market size and forecast 2023-2028 ($ million)
- Exhibits54: Data Table on Wood - Market size and forecast 2023-2028 ($ million)
- Exhibits55: Chart on Wood - Year-over-year growth 2023-2028 (%)
- Exhibits56: Data Table on Wood - Year-over-year growth 2023-2028 (%)
- Exhibits57: Chart on Others - Market size and forecast 2023-2028 ($ million)
- Exhibits58: Data Table on Others - Market size and forecast 2023-2028 ($ million)
- Exhibits59: Chart on Others - Year-over-year growth 2023-2028 (%)
- Exhibits60: Data Table on Others - Year-over-year growth 2023-2028 (%)
- Exhibits61: Market opportunity by Material ($ million)
- Exhibits62: Data Table on Market opportunity by Material ($ million)
- Exhibits63: Chart on Application - Market share 2023-2028 (%)
- Exhibits64: Data Table on Application - Market share 2023-2028 (%)
- Exhibits65: Chart on Comparison by Application
- Exhibits66: Data Table on Comparison by Application
- Exhibits67: Chart on Automotive - Market size and forecast 2023-2028 ($ million)
- Exhibits68: Data Table on Automotive - Market size and forecast 2023-2028 ($ million)
- Exhibits69: Chart on Automotive - Year-over-year growth 2023-2028 (%)
- Exhibits70: Data Table on Automotive - Year-over-year growth 2023-2028 (%)
- Exhibits71: Chart on Food and beverage - Market size and forecast 2023-2028 ($ million)
- Exhibits72: Data Table on Food and beverage - Market size and forecast 2023-2028 ($ million)
- Exhibits73: Chart on Food and beverage - Year-over-year growth 2023-2028 (%)
- Exhibits74: Data Table on Food and beverage - Year-over-year growth 2023-2028 (%)
- Exhibits75: Chart on Electronics - Market size and forecast 2023-2028 ($ million)
- Exhibits76: Data Table on Electronics - Market size and forecast 2023-2028 ($ million)
- Exhibits77: Chart on Electronics - Year-over-year growth 2023-2028 (%)
- Exhibits78: Data Table on Electronics - Year-over-year growth 2023-2028 (%)
- Exhibits79: Chart on Consumer goods - Market size and forecast 2023-2028 ($ million)
- Exhibits80: Data Table on Consumer goods - Market size and forecast 2023-2028 ($ million)
- Exhibits81: Chart on Consumer goods - Year-over-year growth 2023-2028 (%)
- Exhibits82: Data Table on Consumer goods - Year-over-year growth 2023-2028 (%)
- Exhibits83: Chart on Others - Market size and forecast 2023-2028 ($ million)
- Exhibits84: Data Table on Others - Market size and forecast 2023-2028 ($ million)
- Exhibits85: Chart on Others - Year-over-year growth 2023-2028 (%)
- Exhibits86: Data Table on Others - Year-over-year growth 2023-2028 (%)
- Exhibits87: Market opportunity by Application ($ million)
- Exhibits88: Data Table on Market opportunity by Application ($ million)
- Exhibits89: Analysis of price sensitivity, lifecycle, customer purchase basket, adoption rates, and purchase criteria
- Exhibits90: Chart on Market share by geography 2023-2028 (%)
- Exhibits91: Data Table on Market share by geography 2023-2028 (%)
- Exhibits92: Chart on Geographic comparison
- Exhibits93: Data Table on Geographic comparison
- Exhibits94: Chart on APAC - Market size and forecast 2023-2028 ($ million)
- Exhibits95: Data Table on APAC - Market size and forecast 2023-2028 ($ million)
- Exhibits96: Chart on APAC - Year-over-year growth 2023-2028 (%)
- Exhibits97: Data Table on APAC - Year-over-year growth 2023-2028 (%)
- Exhibits98: Chart on North America - Market size and forecast 2023-2028 ($ million)
- Exhibits99: Data Table on North America - Market size and forecast 2023-2028 ($ million)
- Exhibits100: Chart on North America - Year-over-year growth 2023-2028 (%)
- Exhibits101: Data Table on North America - Year-over-year growth 2023-2028 (%)
- Exhibits102: Chart on Europe - Market size and forecast 2023-2028 ($ million)
- Exhibits103: Data Table on Europe - Market size and forecast 2023-2028 ($ million)
- Exhibits104: Chart on Europe - Year-over-year growth 2023-2028 (%)
- Exhibits105: Data Table on Europe - Year-over-year growth 2023-2028 (%)
- Exhibits106: Chart on Middle East and Africa - Market size and forecast 2023-2028 ($ million)
- Exhibits107: Data Table on Middle East and Africa - Market size and forecast 2023-2028 ($ million)
- Exhibits108: Chart on Middle East and Africa - Year-over-year growth 2023-2028 (%)
- Exhibits109: Data Table on Middle East and Africa - Year-over-year growth 2023-2028 (%)
- Exhibits110: Chart on South America - Market size and forecast 2023-2028 ($ million)
- Exhibits111: Data Table on South America - Market size and forecast 2023-2028 ($ million)
- Exhibits112: Chart on South America - Year-over-year growth 2023-2028 (%)
- Exhibits113: Data Table on South America - Year-over-year growth 2023-2028 (%)
- Exhibits114: Chart on US - Market size and forecast 2023-2028 ($ million)
- Exhibits115: Data Table on US - Market size and forecast 2023-2028 ($ million)
- Exhibits116: Chart on US - Year-over-year growth 2023-2028 (%)
- Exhibits117: Data Table on US - Year-over-year growth 2023-2028 (%)
- Exhibits118: Chart on China - Market size and forecast 2023-2028 ($ million)
- Exhibits119: Data Table on China - Market size and forecast 2023-2028 ($ million)
- Exhibits120: Chart on China - Year-over-year growth 2023-2028 (%)
- Exhibits121: Data Table on China - Year-over-year growth 2023-2028 (%)
- Exhibits122: Chart on India - Market size and forecast 2023-2028 ($ million)
- Exhibits123: Data Table on India - Market size and forecast 2023-2028 ($ million)
- Exhibits124: Chart on India - Year-over-year growth 2023-2028 (%)
- Exhibits125: Data Table on India - Year-over-year growth 2023-2028 (%)
- Exhibits126: Chart on Germany - Market size and forecast 2023-2028 ($ million)
- Exhibits127: Data Table on Germany - Market size and forecast 2023-2028 ($ million)
- Exhibits128: Chart on Germany - Year-over-year growth 2023-2028 (%)
- Exhibits129: Data Table on Germany - Year-over-year growth 2023-2028 (%)
- Exhibits130: Chart on Japan - Market size and forecast 2023-2028 ($ million)
- Exhibits131: Data Table on Japan - Market size and forecast 2023-2028 ($ million)
- Exhibits132: Chart on Japan - Year-over-year growth 2023-2028 (%)
- Exhibits133: Data Table on Japan - Year-over-year growth 2023-2028 (%)
- Exhibits134: Chart on UK - Market size and forecast 2023-2028 ($ million)
- Exhibits135: Data Table on UK - Market size and forecast 2023-2028 ($ million)
- Exhibits136: Chart on UK - Year-over-year growth 2023-2028 (%)
- Exhibits137: Data Table on UK - Year-over-year growth 2023-2028 (%)
- Exhibits138: Market opportunity by geography ($ million)
- Exhibits139: Data Tables on Market opportunity by geography ($ million)
- Exhibits140: Impact of drivers and challenges in 2023 and 2028
- Exhibits141: Overview on criticality of inputs and factors of differentiation
- Exhibits142: Overview on factors of disruption
- Exhibits143: Impact of key risks on business
- Exhibits144: Companies covered
- Exhibits145: Company ranking index
- Exhibits146: Matrix on companies position and classification
- Exhibits147: ALLPACK PACKAGING LTD - Overview
- Exhibits148: ALLPACK PACKAGING LTD - Product / Service
- Exhibits149: ALLPACK PACKAGING LTD - Key offerings
- Exhibits150: SWOT
- Exhibits151: Amatech Inc. - Overview
- Exhibits152: Amatech Inc. - Product / Service
- Exhibits153: Amatech Inc. - Key offerings
- Exhibits154: SWOT
- Exhibits155: Corplex - Overview
- Exhibits156: Corplex - Product / Service
- Exhibits157: Corplex - Key offerings
- Exhibits158: SWOT
- Exhibits159: Dordan Manufacturing Co. - Overview
- Exhibits160: Dordan Manufacturing Co. - Product / Service
- Exhibits161: Dordan Manufacturing Co. - Key offerings
- Exhibits162: SWOT
- Exhibits163: GWP Group Ltd. - Overview
- Exhibits164: GWP Group Ltd. - Product / Service
- Exhibits165: GWP Group Ltd. - Key offerings
- Exhibits166: SWOT
- Exhibits167: IPS Packaging and Automation - Overview
- Exhibits168: IPS Packaging and Automation - Product / Service
- Exhibits169: IPS Packaging and Automation - Key offerings
- Exhibits170: SWOT
- Exhibits171: MJSolpac Ltd - Overview
- Exhibits172: MJSolpac Ltd - Product / Service
- Exhibits173: MJSolpac Ltd - Key offerings
- Exhibits174: SWOT
- Exhibits175: NEFAB GROUP - Overview
- Exhibits176: NEFAB GROUP - Product / Service
- Exhibits177: NEFAB GROUP - Key offerings
- Exhibits178: SWOT
- Exhibits179: ORBIS Corp. - Overview
- Exhibits180: ORBIS Corp. - Product / Service
- Exhibits181: ORBIS Corp. - Key offerings
- Exhibits182: SWOT
- Exhibits183: Packaging Corp. of America - Overview
- Exhibits184: Packaging Corp. of America - Business segments
- Exhibits185: Packaging Corp. of America - Key offerings
- Exhibits186: Packaging Corp. of America - Segment focus
- Exhibits187: SWOT
- Exhibits188: Reusable Transport Packaging - Overview
- Exhibits189: Reusable Transport Packaging - Product / Service
- Exhibits190: Reusable Transport Packaging - Key offerings
- Exhibits191: SWOT
- Exhibits192: Salco Engineering & Manufacturing Co. - Overview
- Exhibits193: Salco Engineering & Manufacturing Co. - Product / Service
- Exhibits194: Salco Engineering & Manufacturing Co. - Key offerings
- Exhibits195: SWOT
- Exhibits196: Signode Industrial Group LLC - Overview
- Exhibits197: Signode Industrial Group LLC - Product / Service
- Exhibits198: Signode Industrial Group LLC - Key offerings
- Exhibits199: SWOT
- Exhibits200: Sonoco Products Co. - Overview
- Exhibits201: Sonoco Products Co. - Business segments
- Exhibits202: Sonoco Products Co. - Key news
- Exhibits203: Sonoco Products Co. - Key offerings
- Exhibits204: Sonoco Products Co. - Segment focus
- Exhibits205: SWOT
- Exhibits206: UFP Industries Inc. - Overview
- Exhibits207: UFP Industries Inc. - Business segments
- Exhibits208: UFP Industries Inc. - Key offerings
- Exhibits209: UFP Industries Inc. - Segment focus
- Exhibits210: SWOT
- Exhibits211: Inclusions checklist
- Exhibits212: Exclusions checklist
- Exhibits213: Currency conversion rates for US$
- Exhibits214: Research methodology
- Exhibits215: Information sources
- Exhibits216: Data validation
- Exhibits217: Validation techniques employed for market sizing
- Exhibits218: Data synthesis
- Exhibits219: 360 degree market analysis
- Exhibits220: List of abbreviations
The dunnage packaging market is forecasted to grow by USD 980.1 mn during 2023-2028, accelerating at a CAGR of 5.32% during the forecast period. The report on the dunnage packaging market provides a holistic analysis, market size and forecast, trends, growth drivers, and challenges, as well as vendor analysis covering around 25 vendors.
The report offers an up-to-date analysis regarding the current market scenario, the latest trends and drivers, and the overall market environment. The market is driven by growth in e-commerce industry, expanding end-user industries globally, and increased awareness about benefits of dunnage packaging.
Technavio's dunnage packaging market is segmented as below:
| Market Scope | |
|---|---|
| Base Year | 2024 |
| End Year | 2028 |
| Series Year | 2024-2028 |
| Growth Momentum | Accelerate |
| YOY 2024 | 5.14% |
| CAGR | 5.32% |
| Incremental Value | $980.1mn |
By Material
- Plastic
- Paper
- Foam
- Wood
- Others
By Application
- Automotive
- Food and beverage
- Electronics
- Consumer goods
- Others
By Geography
- APAC
- North America
- Europe
- Middle East and Africa
- South America
This study identifies the rising international trade as one of the prime reasons driving the dunnage packaging market growth during the next few years. Also, shift towards using eco-friendly and recyclable materials in packaging and availability of customized dunnage packaging solutions will lead to sizable demand in the market.
The report on the dunnage packaging market covers the following areas:
- Dunnage packaging market sizing
- Dunnage packaging market forecast
- Dunnage packaging market industry analysis
The robust vendor analysis is designed to help clients improve their market position, and in line with this, this report provides a detailed analysis of several leading dunnage packaging market vendors that include ALLPACK PACKAGING LTD, Amatech Inc., Buckhorn Inc., Corplex, Dordan Manufacturing Co., Flex Container., GWP Group Ltd., IPS Packaging and Automation, JIDA Industrial Solutions, MJSolpac Ltd, NEFAB GROUP, ORBIS Corp., Packaging Corp. of America, PolyFlex Pro, Reusable Transport Packaging, Salco Engineering & Manufacturing Co., Schoeller Allibert, Signode Industrial Group LLC, Sonoco Products Co., TriEnda Holdings LLC, and UFP Industries Inc.. Also, the dunnage packaging market analysis report includes information on upcoming trends and challenges that will influence market growth. This is to help companies strategize and leverage all forthcoming growth opportunities.
The study was conducted using an objective combination of primary and secondary information including inputs from key participants in the industry. The report contains a comprehensive market and vendor landscape in addition to an analysis of the key vendors.
The publisher presents a detailed picture of the market by the way of study, synthesis, and summation of data from multiple sources by an analysis of key parameters such as profit, pricing, competition, and promotions. It presents various market facets by identifying the key industry influencers. The data presented is comprehensive, reliable, and a result of extensive research - both primary and secondary. The market research reports provide a complete competitive landscape and an in-depth vendor selection methodology and analysis using qualitative and quantitative research to forecast the accurate market growth.
Table of Contents
1 Executive Summary
- 1.1 Market overview
- Executive Summary - Chart on Market Overview
- Executive Summary - Data Table on Market Overview
- Executive Summary - Chart on Global Market Characteristics
- Executive Summary - Chart on Market by Geography
- Executive Summary - Chart on Market Segmentation by Material
- Executive Summary - Chart on Market Segmentation by Application
- Executive Summary - Chart on Incremental Growth
- Executive Summary - Data Table on Incremental Growth
- Executive Summary - Chart on Company Market Positioning
2 Technavio Analysis
- 2.1 Analysis of price sensitivity, lifecycle, customer purchase basket, adoption rates, and purchase criteria
- Analysis of price sensitivity, lifecycle, customer purchase basket, adoption rates, and purchase criteria
- 2.2 Criticality of inputs and Factors of differentiation
- Overview on criticality of inputs and factors of differentiation
- 2.3 Factors of disruption
- Overview on factors of disruption
- 2.4 Impact of drivers and challenges
- Impact of drivers and challenges in 2023 and 2028
3 Market Landscape
- 3.1 Market ecosystem
- Parent Market
- Data Table on - Parent Market
- 3.2 Market characteristics
- Market characteristics analysis
- 3.3 Value chain analysis
- Value Chain Analysis
4 Market Sizing
- 4.1 Market definition
- Offerings of companies included in the market definition
- 4.2 Market segment analysis
- Market segments
- 4.3 Market size 2023
- 4.4 Market outlook: Forecast for 2023-2028
- Chart on Global - Market size and forecast 2023-2028 ($ million)
- Data Table on Global - Market size and forecast 2023-2028 ($ million)
- Chart on Global Market: Year-over-year growth 2023-2028 (%)
- Data Table on Global Market: Year-over-year growth 2023-2028 (%)
5 Historic Market Size
- 5.1 Global Dunnage Packaging Market 2018 - 2022
- Historic Market Size - Data Table on Global Dunnage Packaging Market 2018 - 2022 ($ million)
- 5.2 Material segment analysis 2018 - 2022
- Historic Market Size - Material Segment 2018 - 2022 ($ million)
- 5.3 Application segment analysis 2018 - 2022
- Historic Market Size - Application Segment 2018 - 2022 ($ million)
- 5.4 Geography segment analysis 2018 - 2022
- Historic Market Size - Geography Segment 2018 - 2022 ($ million)
- 5.5 Country segment analysis 2018 - 2022
- Historic Market Size - Country Segment 2018 - 2022 ($ million)
6 Additional Value/Volume Data
- 6.1 Global dunnage packaging market by country 2023 - 2028 ($ million)
- Market Size (value) - Data Table on Global dunnage packaging market by Country 2023 - 2028 ($ million)
7 Five Forces Analysis
- 7.1 Five forces summary
- Five forces analysis - Comparison between 2023 and 2028
- 7.2 Bargaining power of buyers
- Bargaining power of buyers - Impact of key factors 2023 and 2028
- 7.3 Bargaining power of suppliers
- Bargaining power of suppliers - Impact of key factors in 2023 and 2028
- 7.4 Threat of new entrants
- Threat of new entrants - Impact of key factors in 2023 and 2028
- 7.5 Threat of substitutes
- Threat of substitutes - Impact of key factors in 2023 and 2028
- 7.6 Threat of rivalry
- Threat of rivalry - Impact of key factors in 2023 and 2028
- 7.7 Market condition
- Chart on Market condition - Five forces 2023 and 2028
8 Market Segmentation by Material
- 8.1 Market segments
- Chart on Material - Market share 2023-2028 (%)
- Data Table on Material - Market share 2023-2028 (%)
- 8.2 Comparison by Material
- Chart on Comparison by Material
- Data Table on Comparison by Material
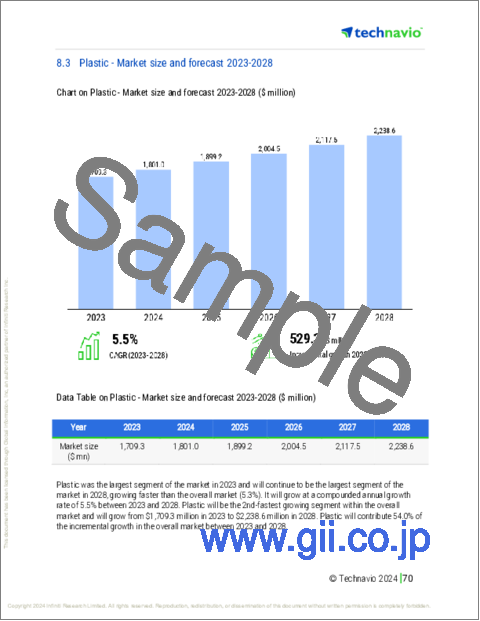
- 8.3 Plastic - Market size and forecast 2023-2028
- Chart on Plastic - Market size and forecast 2023-2028 ($ million)
- Data Table on Plastic - Market size and forecast 2023-2028 ($ million)
- Chart on Plastic - Year-over-year growth 2023-2028 (%)
- Data Table on Plastic - Year-over-year growth 2023-2028 (%)
- 8.4 Paper - Market size and forecast 2023-2028
- Chart on Paper - Market size and forecast 2023-2028 ($ million)
- Data Table on Paper - Market size and forecast 2023-2028 ($ million)
- Chart on Paper - Year-over-year growth 2023-2028 (%)
- Data Table on Paper - Year-over-year growth 2023-2028 (%)
- 8.5 Foam - Market size and forecast 2023-2028
- Chart on Foam - Market size and forecast 2023-2028 ($ million)
- Data Table on Foam - Market size and forecast 2023-2028 ($ million)
- Chart on Foam - Year-over-year growth 2023-2028 (%)
- Data Table on Foam - Year-over-year growth 2023-2028 (%)
- 8.6 Wood - Market size and forecast 2023-2028
- Chart on Wood - Market size and forecast 2023-2028 ($ million)
- Data Table on Wood - Market size and forecast 2023-2028 ($ million)
- Chart on Wood - Year-over-year growth 2023-2028 (%)
- Data Table on Wood - Year-over-year growth 2023-2028 (%)
- 8.7 Others - Market size and forecast 2023-2028
- Chart on Others - Market size and forecast 2023-2028 ($ million)
- Data Table on Others - Market size and forecast 2023-2028 ($ million)
- Chart on Others - Year-over-year growth 2023-2028 (%)
- Data Table on Others - Year-over-year growth 2023-2028 (%)
- 8.8 Market opportunity by Material
- Market opportunity by Material ($ million)
- Data Table on Market opportunity by Material ($ million)
9 Market Segmentation by Application
- 9.1 Market segments
- Chart on Application - Market share 2023-2028 (%)
- Data Table on Application - Market share 2023-2028 (%)
- 9.2 Comparison by Application
- Chart on Comparison by Application
- Data Table on Comparison by Application
- 9.3 Automotive - Market size and forecast 2023-2028
- Chart on Automotive - Market size and forecast 2023-2028 ($ million)
- Data Table on Automotive - Market size and forecast 2023-2028 ($ million)
- Chart on Automotive - Year-over-year growth 2023-2028 (%)
- Data Table on Automotive - Year-over-year growth 2023-2028 (%)
- 9.4 Food and beverage - Market size and forecast 2023-2028
- Chart on Food and beverage - Market size and forecast 2023-2028 ($ million)
- Data Table on Food and beverage - Market size and forecast 2023-2028 ($ million)
- Chart on Food and beverage - Year-over-year growth 2023-2028 (%)
- Data Table on Food and beverage - Year-over-year growth 2023-2028 (%)
- 9.5 Electronics - Market size and forecast 2023-2028
- Chart on Electronics - Market size and forecast 2023-2028 ($ million)
- Data Table on Electronics - Market size and forecast 2023-2028 ($ million)
- Chart on Electronics - Year-over-year growth 2023-2028 (%)
- Data Table on Electronics - Year-over-year growth 2023-2028 (%)
- 9.6 Consumer goods - Market size and forecast 2023-2028
- Chart on Consumer goods - Market size and forecast 2023-2028 ($ million)
- Data Table on Consumer goods - Market size and forecast 2023-2028 ($ million)
- Chart on Consumer goods - Year-over-year growth 2023-2028 (%)
- Data Table on Consumer goods - Year-over-year growth 2023-2028 (%)
- 9.7 Others - Market size and forecast 2023-2028
- Chart on Others - Market size and forecast 2023-2028 ($ million)
- Data Table on Others - Market size and forecast 2023-2028 ($ million)
- Chart on Others - Year-over-year growth 2023-2028 (%)
- Data Table on Others - Year-over-year growth 2023-2028 (%)
- 9.8 Market opportunity by Application
- Market opportunity by Application ($ million)
- Data Table on Market opportunity by Application ($ million)
10 Customer Landscape
- 10.1 Customer landscape overview
- Analysis of price sensitivity, lifecycle, customer purchase basket, adoption rates, and purchase criteria
11 Geographic Landscape
- 11.1 Geographic segmentation
- Chart on Market share by geography 2023-2028 (%)
- Data Table on Market share by geography 2023-2028 (%)
- 11.2 Geographic comparison
- Chart on Geographic comparison
- Data Table on Geographic comparison
- 11.3 APAC - Market size and forecast 2023-2028
- Chart on APAC - Market size and forecast 2023-2028 ($ million)
- Data Table on APAC - Market size and forecast 2023-2028 ($ million)
- Chart on APAC - Year-over-year growth 2023-2028 (%)
- Data Table on APAC - Year-over-year growth 2023-2028 (%)
- 11.4 North America - Market size and forecast 2023-2028
- Chart on North America - Market size and forecast 2023-2028 ($ million)
- Data Table on North America - Market size and forecast 2023-2028 ($ million)
- Chart on North America - Year-over-year growth 2023-2028 (%)
- Data Table on North America - Year-over-year growth 2023-2028 (%)
- 11.5 Europe - Market size and forecast 2023-2028
- Chart on Europe - Market size and forecast 2023-2028 ($ million)
- Data Table on Europe - Market size and forecast 2023-2028 ($ million)
- Chart on Europe - Year-over-year growth 2023-2028 (%)
- Data Table on Europe - Year-over-year growth 2023-2028 (%)
- 11.6 Middle East and Africa - Market size and forecast 2023-2028
- Chart on Middle East and Africa - Market size and forecast 2023-2028 ($ million)
- Data Table on Middle East and Africa - Market size and forecast 2023-2028 ($ million)
- Chart on Middle East and Africa - Year-over-year growth 2023-2028 (%)
- Data Table on Middle East and Africa - Year-over-year growth 2023-2028 (%)
- 11.7 South America - Market size and forecast 2023-2028
- Chart on South America - Market size and forecast 2023-2028 ($ million)
- Data Table on South America - Market size and forecast 2023-2028 ($ million)
- Chart on South America - Year-over-year growth 2023-2028 (%)
- Data Table on South America - Year-over-year growth 2023-2028 (%)
- 11.8 US - Market size and forecast 2023-2028
- Chart on US - Market size and forecast 2023-2028 ($ million)
- Data Table on US - Market size and forecast 2023-2028 ($ million)
- Chart on US - Year-over-year growth 2023-2028 (%)
- Data Table on US - Year-over-year growth 2023-2028 (%)
- 11.9 China - Market size and forecast 2023-2028
- Chart on China - Market size and forecast 2023-2028 ($ million)
- Data Table on China - Market size and forecast 2023-2028 ($ million)
- Chart on China - Year-over-year growth 2023-2028 (%)
- Data Table on China - Year-over-year growth 2023-2028 (%)
- 11.10 India - Market size and forecast 2023-2028
- Chart on India - Market size and forecast 2023-2028 ($ million)
- Data Table on India - Market size and forecast 2023-2028 ($ million)
- Chart on India - Year-over-year growth 2023-2028 (%)
- Data Table on India - Year-over-year growth 2023-2028 (%)
- 11.11 Germany - Market size and forecast 2023-2028
- Chart on Germany - Market size and forecast 2023-2028 ($ million)
- Data Table on Germany - Market size and forecast 2023-2028 ($ million)
- Chart on Germany - Year-over-year growth 2023-2028 (%)
- Data Table on Germany - Year-over-year growth 2023-2028 (%)
- 11.12 Japan - Market size and forecast 2023-2028
- Chart on Japan - Market size and forecast 2023-2028 ($ million)
- Data Table on Japan - Market size and forecast 2023-2028 ($ million)
- Chart on Japan - Year-over-year growth 2023-2028 (%)
- Data Table on Japan - Year-over-year growth 2023-2028 (%)
- 11.13 UK - Market size and forecast 2023-2028
- Chart on UK - Market size and forecast 2023-2028 ($ million)
- Data Table on UK - Market size and forecast 2023-2028 ($ million)
- Chart on UK - Year-over-year growth 2023-2028 (%)
- Data Table on UK - Year-over-year growth 2023-2028 (%)
- 11.14 Market opportunity by geography
- Market opportunity by geography ($ million)
- Data Tables on Market opportunity by geography ($ million)
12 Drivers, Challenges, and Opportunity/Restraints
- 12.1 Market drivers
- 12.2 Market challenges
- 12.3 Impact of drivers and challenges
- Impact of drivers and challenges in 2023 and 2028
- 12.4 Market opportunities/restraints
13 Competitive Landscape
- 13.1 Overview
- 13.2 Competitive Landscape
- Overview on criticality of inputs and factors of differentiation
- 13.3 Landscape disruption
- Overview on factors of disruption
- 13.4 Industry risks
- Impact of key risks on business
14 Competitive Analysis
- 14.1 Companies profiled
- Companies covered
- 14.2 Company ranking index
- Company ranking index
- 14.3 Market positioning of companies
- Matrix on companies position and classification
- 14.4 ALLPACK PACKAGING LTD
- ALLPACK PACKAGING LTD - Overview
- ALLPACK PACKAGING LTD - Product / Service
- ALLPACK PACKAGING LTD - Key offerings
- SWOT
- 14.5 Amatech Inc.
- Amatech Inc. - Overview
- Amatech Inc. - Product / Service
- Amatech Inc. - Key offerings
- SWOT
- 14.6 Corplex
- Corplex - Overview
- Corplex - Product / Service
- Corplex - Key offerings
- SWOT
- 14.7 Dordan Manufacturing Co.
- Dordan Manufacturing Co. - Overview
- Dordan Manufacturing Co. - Product / Service
- Dordan Manufacturing Co. - Key offerings
- SWOT
- 14.8 GWP Group Ltd.
- GWP Group Ltd. - Overview
- GWP Group Ltd. - Product / Service
- GWP Group Ltd. - Key offerings
- SWOT
- 14.9 IPS Packaging and Automation
- IPS Packaging and Automation - Overview
- IPS Packaging and Automation - Product / Service
- IPS Packaging and Automation - Key offerings
- SWOT
- 14.10 MJSolpac Ltd
- MJSolpac Ltd - Overview
- MJSolpac Ltd - Product / Service
- MJSolpac Ltd - Key offerings
- SWOT
- 14.11 NEFAB GROUP
- NEFAB GROUP - Overview
- NEFAB GROUP - Product / Service
- NEFAB GROUP - Key offerings
- SWOT
- 14.12 ORBIS Corp.
- ORBIS Corp. - Overview
- ORBIS Corp. - Product / Service
- ORBIS Corp. - Key offerings
- SWOT
- 14.13 Packaging Corp. of America
- Packaging Corp. of America - Overview
- Packaging Corp. of America - Business segments
- Packaging Corp. of America - Key offerings
- Packaging Corp. of America - Segment focus
- SWOT
- 14.14 Reusable Transport Packaging
- Reusable Transport Packaging - Overview
- Reusable Transport Packaging - Product / Service
- Reusable Transport Packaging - Key offerings
- SWOT
- 14.15 Salco Engineering Manufacturing Co.
- Salco Engineering Manufacturing Co. - Overview
- Salco Engineering Manufacturing Co. - Product / Service
- Salco Engineering Manufacturing Co. - Key offerings
- SWOT
- 14.16 Signode Industrial Group LLC
- Signode Industrial Group LLC - Overview
- Signode Industrial Group LLC - Product / Service
- Signode Industrial Group LLC - Key offerings
- SWOT
- 14.17 Sonoco Products Co.
- Sonoco Products Co. - Overview
- Sonoco Products Co. - Business segments
- Sonoco Products Co. - Key news
- Sonoco Products Co. - Key offerings
- Sonoco Products Co. - Segment focus
- SWOT
- 14.18 UFP Industries Inc.
- UFP Industries Inc. - Overview
- UFP Industries Inc. - Business segments
- UFP Industries Inc. - Key offerings
- UFP Industries Inc. - Segment focus
- SWOT
15 Appendix
- 15.1 Scope of the report
- 15.2 Inclusions and exclusions checklist
- Inclusions checklist
- Exclusions checklist
- 15.3 Currency conversion rates for US$
- Currency conversion rates for US$
- 15.4 Research methodology
- Research methodology
- 15.5 Data procurement
- Information sources
- 15.6 Data validation
- Data validation
- 15.7 Validation techniques employed for market sizing
- Validation techniques employed for market sizing
- 15.8 Data synthesis
- Data synthesis
- 15.9 360 degree market analysis
- 360 degree market analysis
- 15.10 List of abbreviations
- List of abbreviations
