|
|
市場調査レポート
商品コード
1557736
バイオ炭製造機の世界市場 2024-2028Global Biochar Machine Market 2024-2028 |
||||||
|
|||||||
カスタマイズ可能
|
|||||||


| バイオ炭製造機の世界市場 2024-2028 |
|
出版日: 2024年08月02日
発行: TechNavio
ページ情報: 英文 200 Pages
納期: 即納可能
|

全表示
- 概要
- 図表
- 目次
バイオ炭製造機市場は2023-2028年に2億6,660万米ドル、予測期間中のCAGRは11.53%で成長すると予測されます。
当レポートでは、バイオ炭製造機市場の全体的な分析、市場規模・予測、動向、成長促進要因、課題、約25のベンダーを網羅したベンダー分析などを掲載しています。
現在の市場シナリオ、最新動向と促進要因、市場環境全体に関する最新分析を提供しています。バイオ炭市場は、農業におけるバイオ炭の需要増加、バイオ炭の導入を支援する政府の支援や規制、熱分解技術の高い採用率などが市場を牽引しています。
| 市場範囲 | |
|---|---|
| 基準年 | 2024 |
| 終了年 | 2028 |
| 予測期間 | 2024-2028 |
| 成長モメンタム | 加速 |
| 前年比2024年 | 10.67% |
| CAGR | 11.53% |
| 増分額 | 2億6,660万米ドル |
本調査では、今後数年間のバイオ炭製造機市場成長を牽引する主な要因の一つとして、気候に優しいバイオ炭プラントを挙げています。また、バイオ炭製造機の需要を押し上げるオーガニック製品の採用増加や、ポータブルバイオ炭製造機の人気上昇も市場の大きな需要につながります。
目次
第1章 エグゼクティブサマリー
- 市場概要
第2章 Technavio別分析
- 価格・ライフサイクル・顧客購入バスケット・採用率・購入基準の分析
- インプットの重要性と差別化の要因
- 混乱の要因
- 促進要因と課題の影響
第3章 市場情勢
- 市場エコシステム
- 市場の特徴
- バリューチェーン分析
第4章 市場規模の評価
- 市場の定義
- 市場セグメント分析
- 市場規模 2023
- 市場の見通し 2023-2028
第5章 市場規模実績
- バイオ炭製造機の世界市場 2018-2022
- 原料別セグメント分析 2018-2022
- タイプ別セグメント分析 2018-2022
- 地域別セグメント分析 2018-2022
- 国別セグメント分析 2018-2022
第6章 付加価値/数量データ
- バイオ炭製造機の世界市場:国別 2023-2028
第7章 ファイブフォース分析
- ファイブフォースの要約
- 買い手の交渉力
- 供給企業の交渉力
- 新規参入業者の脅威
- 代替品の脅威
- 競争の脅威
- 市況
第8章 市場セグメンテーション:原料別
- 市場セグメンテーション
- 比較:原料別
- 農業残渣:市場規模と予測 2023-2028
- 木材チップ:市場規模と予測 2023-2028
- スラリー:市場規模と予測 2023-2028
- 肥料:市場規模と予測 2023-2028
- おがくず:市場規模と予測 2023-2028
- 市場機会:原料別
第9章 市場セグメンテーション:タイプ別
- 市場セグメンテーション
- 比較:タイプ別
- バッチ反応器:市場規模と予測 2023-2028
- 連続反応器:市場規模と予測 2023-2028
- ポータブル反応器:市場規模と予測 2023-2028
- 流動床反応器:市場規模と予測 2023-2028
- 市場機会:タイプ別
第10章 顧客情勢
- 顧客情勢の概要
第11章 地域別情勢
- 地域別セグメンテーション
- 地域別比較
- 北米:市場規模と予測 2023-2028
- 欧州:市場規模と予測 2023-2028
- アジア太平洋:市場規模と予測 2023-2028
- 南米:市場規模と予測 2023-2028
- 中東・アフリカ:市場規模と予測 2023-2028
- 米国:市場規模と予測 2023-2028
- カナダ:市場規模と予測 2023-2028
- ドイツ:市場規模と予測 2023-2028
- 中国:市場規模と予測 2023-2028
- 英国:市場規模と予測 2023-2028
- オーストラリア:市場規模と予測 2023-2028
- 市場機会:地域別
第12章 促進要因・課題・機会・抑制要因
- 市場促進要因
- 市場の課題
- 促進要因と課題の影響
- 市場の機会・抑制要因
第13章 競合情勢
- 概要
- 競合情勢
- 混乱の状況
- 業界のリスク
第14章 競合分析
- 企業プロファイル
- 企業ランキング指数
- 企業の市場ポジショニング
- AGICO Cement International Engineering Co., Ltd.
- ARTi
- BESTON GROUP CO., LTD.
- Biochar Solutions Inc.
- Bioforcetech Corp.
- FEECO International Inc.
- Henan Sunrishe Biochar Machine Co. Ltd.
- Kerone Engineering Solutions LTD.,
- Kingtiger Shanghai Environmental Technology Co., Ltd.
- Klean Industries Inc.
- MashMakes inc.
- PYREG GmbH
- Pyrotech Energy Pty Ltd
- WasteX Pte. Ltd.
- West Salem Machinery
第15章 付録
Exhibits:
- Exhibits1: Executive Summary - Chart on Market Overview
- Exhibits2: Executive Summary - Data Table on Market Overview
- Exhibits3: Executive Summary - Chart on Global Market Characteristics
- Exhibits4: Executive Summary - Chart on Market by Geography
- Exhibits5: Executive Summary - Chart on Market Segmentation by Feedstock
- Exhibits6: Executive Summary - Chart on Market Segmentation by Type
- Exhibits7: Executive Summary - Chart on Incremental Growth
- Exhibits8: Executive Summary - Data Table on Incremental Growth
- Exhibits9: Executive Summary - Chart on Company Market Positioning
- Exhibits10: Analysis of price sensitivity, lifecycle, customer purchase basket, adoption rates, and purchase criteria
- Exhibits11: Overview on criticality of inputs and factors of differentiation
- Exhibits12: Overview on factors of disruption
- Exhibits13: Impact of drivers and challenges in 2023 and 2028
- Exhibits14: Parent Market
- Exhibits15: Data Table on - Parent Market
- Exhibits16: Market characteristics analysis
- Exhibits17: Value Chain Analysis
- Exhibits18: Offerings of companies included in the market definition
- Exhibits19: Market segments
- Exhibits20: Chart on Global - Market size and forecast 2023-2028 ($ million)
- Exhibits21: Data Table on Global - Market size and forecast 2023-2028 ($ million)
- Exhibits22: Chart on Global Market: Year-over-year growth 2023-2028 (%)
- Exhibits23: Data Table on Global Market: Year-over-year growth 2023-2028 (%)
- Exhibits24: Historic Market Size - Data Table on Global Biochar Machine Market 2018 - 2022 ($ million)
- Exhibits25: Historic Market Size - Feedstock Segment 2018 - 2022 ($ million)
- Exhibits26: Historic Market Size - Type Segment 2018 - 2022 ($ million)
- Exhibits27: Historic Market Size - Geography Segment 2018 - 2022 ($ million)
- Exhibits28: Historic Market Size - Country Segment 2018 - 2022 ($ million)
- Exhibits29: Market Size (value) - Data Table on Global biochar machine market by Country 2023 - 2028 ($ million)
- Exhibits30: Five forces analysis - Comparison between 2023 and 2028
- Exhibits31: Bargaining power of buyers - Impact of key factors 2023 and 2028
- Exhibits32: Bargaining power of suppliers - Impact of key factors in 2023 and 2028
- Exhibits33: Threat of new entrants - Impact of key factors in 2023 and 2028
- Exhibits34: Threat of substitutes - Impact of key factors in 2023 and 2028
- Exhibits35: Threat of rivalry - Impact of key factors in 2023 and 2028
- Exhibits36: Chart on Market condition - Five forces 2023 and 2028
- Exhibits37: Chart on Feedstock - Market share 2023-2028 (%)
- Exhibits38: Data Table on Feedstock - Market share 2023-2028 (%)
- Exhibits39: Chart on Comparison by Feedstock
- Exhibits40: Data Table on Comparison by Feedstock
- Exhibits41: Chart on Agricultural residue - Market size and forecast 2023-2028 ($ million)
- Exhibits42: Data Table on Agricultural residue - Market size and forecast 2023-2028 ($ million)
- Exhibits43: Chart on Agricultural residue - Year-over-year growth 2023-2028 (%)
- Exhibits44: Data Table on Agricultural residue - Year-over-year growth 2023-2028 (%)
- Exhibits45: Chart on Wood chips - Market size and forecast 2023-2028 ($ million)
- Exhibits46: Data Table on Wood chips - Market size and forecast 2023-2028 ($ million)
- Exhibits47: Chart on Wood chips - Year-over-year growth 2023-2028 (%)
- Exhibits48: Data Table on Wood chips - Year-over-year growth 2023-2028 (%)
- Exhibits49: Chart on Slurry - Market size and forecast 2023-2028 ($ million)
- Exhibits50: Data Table on Slurry - Market size and forecast 2023-2028 ($ million)
- Exhibits51: Chart on Slurry - Year-over-year growth 2023-2028 (%)
- Exhibits52: Data Table on Slurry - Year-over-year growth 2023-2028 (%)
- Exhibits53: Chart on Manure - Market size and forecast 2023-2028 ($ million)
- Exhibits54: Data Table on Manure - Market size and forecast 2023-2028 ($ million)
- Exhibits55: Chart on Manure - Year-over-year growth 2023-2028 (%)
- Exhibits56: Data Table on Manure - Year-over-year growth 2023-2028 (%)
- Exhibits57: Chart on Sawdust - Market size and forecast 2023-2028 ($ million)
- Exhibits58: Data Table on Sawdust - Market size and forecast 2023-2028 ($ million)
- Exhibits59: Chart on Sawdust - Year-over-year growth 2023-2028 (%)
- Exhibits60: Data Table on Sawdust - Year-over-year growth 2023-2028 (%)
- Exhibits61: Market opportunity by Feedstock ($ million)
- Exhibits62: Data Table on Market opportunity by Feedstock ($ million)
- Exhibits63: Chart on Type - Market share 2023-2028 (%)
- Exhibits64: Data Table on Type - Market share 2023-2028 (%)
- Exhibits65: Chart on Comparison by Type
- Exhibits66: Data Table on Comparison by Type
- Exhibits67: Chart on Batch reactors - Market size and forecast 2023-2028 ($ million)
- Exhibits68: Data Table on Batch reactors - Market size and forecast 2023-2028 ($ million)
- Exhibits69: Chart on Batch reactors - Year-over-year growth 2023-2028 (%)
- Exhibits70: Data Table on Batch reactors - Year-over-year growth 2023-2028 (%)
- Exhibits71: Chart on Continuous reactors - Market size and forecast 2023-2028 ($ million)
- Exhibits72: Data Table on Continuous reactors - Market size and forecast 2023-2028 ($ million)
- Exhibits73: Chart on Continuous reactors - Year-over-year growth 2023-2028 (%)
- Exhibits74: Data Table on Continuous reactors - Year-over-year growth 2023-2028 (%)
- Exhibits75: Chart on Portable reactors - Market size and forecast 2023-2028 ($ million)
- Exhibits76: Data Table on Portable reactors - Market size and forecast 2023-2028 ($ million)
- Exhibits77: Chart on Portable reactors - Year-over-year growth 2023-2028 (%)
- Exhibits78: Data Table on Portable reactors - Year-over-year growth 2023-2028 (%)
- Exhibits79: Chart on Fluidized bed reactors - Market size and forecast 2023-2028 ($ million)
- Exhibits80: Data Table on Fluidized bed reactors - Market size and forecast 2023-2028 ($ million)
- Exhibits81: Chart on Fluidized bed reactors - Year-over-year growth 2023-2028 (%)
- Exhibits82: Data Table on Fluidized bed reactors - Year-over-year growth 2023-2028 (%)
- Exhibits83: Market opportunity by Type ($ million)
- Exhibits84: Data Table on Market opportunity by Type ($ million)
- Exhibits85: Analysis of price sensitivity, lifecycle, customer purchase basket, adoption rates, and purchase criteria
- Exhibits86: Chart on Market share by geography 2023-2028 (%)
- Exhibits87: Data Table on Market share by geography 2023-2028 (%)
- Exhibits88: Chart on Geographic comparison
- Exhibits89: Data Table on Geographic comparison
- Exhibits90: Chart on North America - Market size and forecast 2023-2028 ($ million)
- Exhibits91: Data Table on North America - Market size and forecast 2023-2028 ($ million)
- Exhibits92: Chart on North America - Year-over-year growth 2023-2028 (%)
- Exhibits93: Data Table on North America - Year-over-year growth 2023-2028 (%)
- Exhibits94: Chart on Europe - Market size and forecast 2023-2028 ($ million)
- Exhibits95: Data Table on Europe - Market size and forecast 2023-2028 ($ million)
- Exhibits96: Chart on Europe - Year-over-year growth 2023-2028 (%)
- Exhibits97: Data Table on Europe - Year-over-year growth 2023-2028 (%)
- Exhibits98: Chart on APAC - Market size and forecast 2023-2028 ($ million)
- Exhibits99: Data Table on APAC - Market size and forecast 2023-2028 ($ million)
- Exhibits100: Chart on APAC - Year-over-year growth 2023-2028 (%)
- Exhibits101: Data Table on APAC - Year-over-year growth 2023-2028 (%)
- Exhibits102: Chart on South America - Market size and forecast 2023-2028 ($ million)
- Exhibits103: Data Table on South America - Market size and forecast 2023-2028 ($ million)
- Exhibits104: Chart on South America - Year-over-year growth 2023-2028 (%)
- Exhibits105: Data Table on South America - Year-over-year growth 2023-2028 (%)
- Exhibits106: Chart on Middle East and Africa - Market size and forecast 2023-2028 ($ million)
- Exhibits107: Data Table on Middle East and Africa - Market size and forecast 2023-2028 ($ million)
- Exhibits108: Chart on Middle East and Africa - Year-over-year growth 2023-2028 (%)
- Exhibits109: Data Table on Middle East and Africa - Year-over-year growth 2023-2028 (%)
- Exhibits110: Chart on US - Market size and forecast 2023-2028 ($ million)
- Exhibits111: Data Table on US - Market size and forecast 2023-2028 ($ million)
- Exhibits112: Chart on US - Year-over-year growth 2023-2028 (%)
- Exhibits113: Data Table on US - Year-over-year growth 2023-2028 (%)
- Exhibits114: Chart on Canada - Market size and forecast 2023-2028 ($ million)
- Exhibits115: Data Table on Canada - Market size and forecast 2023-2028 ($ million)
- Exhibits116: Chart on Canada - Year-over-year growth 2023-2028 (%)
- Exhibits117: Data Table on Canada - Year-over-year growth 2023-2028 (%)
- Exhibits118: Chart on Germany - Market size and forecast 2023-2028 ($ million)
- Exhibits119: Data Table on Germany - Market size and forecast 2023-2028 ($ million)
- Exhibits120: Chart on Germany - Year-over-year growth 2023-2028 (%)
- Exhibits121: Data Table on Germany - Year-over-year growth 2023-2028 (%)
- Exhibits122: Chart on China - Market size and forecast 2023-2028 ($ million)
- Exhibits123: Data Table on China - Market size and forecast 2023-2028 ($ million)
- Exhibits124: Chart on China - Year-over-year growth 2023-2028 (%)
- Exhibits125: Data Table on China - Year-over-year growth 2023-2028 (%)
- Exhibits126: Chart on UK - Market size and forecast 2023-2028 ($ million)
- Exhibits127: Data Table on UK - Market size and forecast 2023-2028 ($ million)
- Exhibits128: Chart on UK - Year-over-year growth 2023-2028 (%)
- Exhibits129: Data Table on UK - Year-over-year growth 2023-2028 (%)
- Exhibits130: Chart on Australia - Market size and forecast 2023-2028 ($ million)
- Exhibits131: Data Table on Australia - Market size and forecast 2023-2028 ($ million)
- Exhibits132: Chart on Australia - Year-over-year growth 2023-2028 (%)
- Exhibits133: Data Table on Australia - Year-over-year growth 2023-2028 (%)
- Exhibits134: Market opportunity by geography ($ million)
- Exhibits135: Data Tables on Market opportunity by geography ($ million)
- Exhibits136: Impact of drivers and challenges in 2023 and 2028
- Exhibits137: Overview on criticality of inputs and factors of differentiation
- Exhibits138: Overview on factors of disruption
- Exhibits139: Impact of key risks on business
- Exhibits140: Companies covered
- Exhibits141: Company ranking index
- Exhibits142: Matrix on companies position and classification
- Exhibits143: AGICO Cement International Engineering Co., Ltd. - Overview
- Exhibits144: AGICO Cement International Engineering Co., Ltd. - Product / Service
- Exhibits145: AGICO Cement International Engineering Co., Ltd. - Key offerings
- Exhibits146: SWOT
- Exhibits147: ARTi - Overview
- Exhibits148: ARTi - Product / Service
- Exhibits149: ARTi - Key offerings
- Exhibits150: SWOT
- Exhibits151: BESTON GROUP CO., LTD. - Overview
- Exhibits152: BESTON GROUP CO., LTD. - Product / Service
- Exhibits153: BESTON GROUP CO., LTD. - Key offerings
- Exhibits154: SWOT
- Exhibits155: Biochar Solutions Inc. - Overview
- Exhibits156: Biochar Solutions Inc. - Product / Service
- Exhibits157: Biochar Solutions Inc. - Key offerings
- Exhibits158: SWOT
- Exhibits159: Bioforcetech Corp. - Overview
- Exhibits160: Bioforcetech Corp. - Product / Service
- Exhibits161: Bioforcetech Corp. - Key offerings
- Exhibits162: SWOT
- Exhibits163: FEECO International Inc. - Overview
- Exhibits164: FEECO International Inc. - Product / Service
- Exhibits165: FEECO International Inc. - Key offerings
- Exhibits166: SWOT
- Exhibits167: Henan Sunrishe Biochar Machine Co. Ltd. - Overview
- Exhibits168: Henan Sunrishe Biochar Machine Co. Ltd. - Product / Service
- Exhibits169: Henan Sunrishe Biochar Machine Co. Ltd. - Key offerings
- Exhibits170: SWOT
- Exhibits171: Kerone Engineering Solutions LTD., - Overview
- Exhibits172: Kerone Engineering Solutions LTD., - Product / Service
- Exhibits173: Kerone Engineering Solutions LTD., - Key offerings
- Exhibits174: SWOT
- Exhibits175: Kingtiger Shanghai Environmental Technology Co., Ltd. - Overview
- Exhibits176: Kingtiger Shanghai Environmental Technology Co., Ltd. - Product / Service
- Exhibits177: Kingtiger Shanghai Environmental Technology Co., Ltd. - Key offerings
- Exhibits178: SWOT
- Exhibits179: Klean Industries Inc. - Overview
- Exhibits180: Klean Industries Inc. - Product / Service
- Exhibits181: Klean Industries Inc. - Key offerings
- Exhibits182: SWOT
- Exhibits183: MashMakes inc. - Overview
- Exhibits184: MashMakes inc. - Product / Service
- Exhibits185: MashMakes inc. - Key offerings
- Exhibits186: SWOT
- Exhibits187: PYREG GmbH - Overview
- Exhibits188: PYREG GmbH - Product / Service
- Exhibits189: PYREG GmbH - Key offerings
- Exhibits190: SWOT
- Exhibits191: Pyrotech Energy Pty Ltd - Overview
- Exhibits192: Pyrotech Energy Pty Ltd - Product / Service
- Exhibits193: Pyrotech Energy Pty Ltd - Key offerings
- Exhibits194: SWOT
- Exhibits195: WasteX Pte. Ltd. - Overview
- Exhibits196: WasteX Pte. Ltd. - Product / Service
- Exhibits197: WasteX Pte. Ltd. - Key offerings
- Exhibits198: SWOT
- Exhibits199: West Salem Machinery - Overview
- Exhibits200: West Salem Machinery - Product / Service
- Exhibits201: West Salem Machinery - Key offerings
- Exhibits202: SWOT
- Exhibits203: Inclusions checklist
- Exhibits204: Exclusions checklist
- Exhibits205: Currency conversion rates for US$
- Exhibits206: Research methodology
- Exhibits207: Information sources
- Exhibits208: Data validation
- Exhibits209: Validation techniques employed for market sizing
- Exhibits210: Data synthesis
- Exhibits211: 360 degree market analysis
- Exhibits212: List of abbreviations
The biochar machine market is forecasted to grow by USD 266.6 mn during 2023-2028, accelerating at a CAGR of 11.53% during the forecast period. The report on the biochar machine market provides a holistic analysis, market size and forecast, trends, growth drivers, and challenges, as well as vendor analysis covering around 25 vendors.
The report offers an up-to-date analysis regarding the current market scenario, the latest trends and drivers, and the overall market environment. The market is driven by increasing demand for biochar in agriculture, government support and regulations supporting biochar adoption, and high adoption of pyrolysis technology.
Technavio's biochar machine market is segmented as below:
| Market Scope | |
|---|---|
| Base Year | 2024 |
| End Year | 2028 |
| Series Year | 2024-2028 |
| Growth Momentum | Accelerate |
| YOY 2024 | 10.67% |
| CAGR | 11.53% |
| Incremental Value | $266.6mn |
By Feedstock
- Agricultural residue
- Wood chips
- Slurry
- Manure
- Sawdust
By Type
- Batch reactors
- Continuous reactors
- Portable reactors
- Fluidized bed reactors
By Geography
- North America
- Europe
- APAC
- South America
- Middle East and Africa
This study identifies the climate-friendly biochar plants as one of the prime reasons driving the biochar machine market growth during the next few years. Also, rising adoption of organic products boosting demand for biochar machines and rising popularity of portable biochar machine will lead to sizable demand in the market.
The report on the biochar machine market covers the following areas:
- Biochar machine market sizing
- Biochar machine market forecast
- Biochar machine market industry analysis
The robust vendor analysis is designed to help clients improve their market position, and in line with this, this report provides a detailed analysis of several leading biochar machine market vendors that include AGICO Cement International Engineering Co., Ltd., Agile Process Chemicals LLP., ARTi, BESTON GROUP CO., LTD., Biochar Solutions Inc., Bioforcetech Corp., Durga Technology Corp., FEECO International Inc., Goenvi Technologies Pvt Ltd., GreenPower , Henan Sunrishe Biochar Machine Co. Ltd., Kerone Engineering Solutions LTD.,, Kingtiger Shanghai Environmental Technology Co., Ltd., Klean Industries Inc., MashMakes inc., PYREG GmbH, Pyrotech Energy Pty Ltd, RMS Roller Grinder, WasteX Pte. Ltd., and West Salem Machinery. Also, the biochar machine market analysis report includes information on upcoming trends and challenges that will influence market growth. This is to help companies strategize and leverage all forthcoming growth opportunities.
The study was conducted using an objective combination of primary and secondary information including inputs from key participants in the industry. The report contains a comprehensive market and vendor landscape in addition to an analysis of the key vendors.
The publisher presents a detailed picture of the market by the way of study, synthesis, and summation of data from multiple sources by an analysis of key parameters such as profit, pricing, competition, and promotions. It presents various market facets by identifying the key industry influencers. The data presented is comprehensive, reliable, and a result of extensive research - both primary and secondary. The market research reports provide a complete competitive landscape and an in-depth vendor selection methodology and analysis using qualitative and quantitative research to forecast the accurate market growth.
Table of Contents
1 Executive Summary
- 1.1 Market overview
- Executive Summary - Chart on Market Overview
- Executive Summary - Data Table on Market Overview
- Executive Summary - Chart on Global Market Characteristics
- Executive Summary - Chart on Market by Geography
- Executive Summary - Chart on Market Segmentation by Feedstock
- Executive Summary - Chart on Market Segmentation by Type
- Executive Summary - Chart on Incremental Growth
- Executive Summary - Data Table on Incremental Growth
- Executive Summary - Chart on Company Market Positioning
2 Technavio Analysis
- 2.1 Analysis of price sensitivity, lifecycle, customer purchase basket, adoption rates, and purchase criteria
- Analysis of price sensitivity, lifecycle, customer purchase basket, adoption rates, and purchase criteria
- 2.2 Criticality of inputs and Factors of differentiation
- Overview on criticality of inputs and factors of differentiation
- 2.3 Factors of disruption
- Overview on factors of disruption
- 2.4 Impact of drivers and challenges
- Impact of drivers and challenges in 2023 and 2028
3 Market Landscape
- 3.1 Market ecosystem
- Parent Market
- Data Table on - Parent Market
- 3.2 Market characteristics
- Market characteristics analysis
- 3.3 Value chain analysis
- Value Chain Analysis
4 Market Sizing
- 4.1 Market definition
- Offerings of companies included in the market definition
- 4.2 Market segment analysis
- Market segments
- 4.3 Market size 2023
- 4.4 Market outlook: Forecast for 2023-2028
- Chart on Global - Market size and forecast 2023-2028 ($ million)
- Data Table on Global - Market size and forecast 2023-2028 ($ million)
- Chart on Global Market: Year-over-year growth 2023-2028 (%)
- Data Table on Global Market: Year-over-year growth 2023-2028 (%)
5 Historic Market Size
- 5.1 Global Biochar Machine Market 2018 - 2022
- Historic Market Size - Data Table on Global Biochar Machine Market 2018 - 2022 ($ million)
- 5.2 Feedstock segment analysis 2018 - 2022
- Historic Market Size - Feedstock Segment 2018 - 2022 ($ million)
- 5.3 Type segment analysis 2018 - 2022
- Historic Market Size - Type Segment 2018 - 2022 ($ million)
- 5.4 Geography segment analysis 2018 - 2022
- Historic Market Size - Geography Segment 2018 - 2022 ($ million)
- 5.5 Country segment analysis 2018 - 2022
- Historic Market Size - Country Segment 2018 - 2022 ($ million)
6 Additional Value/Volume Data
- 6.1 Global biochar machine market by country 2023 - 2028 ($ million)
- Market Size (value) - Data Table on Global biochar machine market by Country 2023 - 2028 ($ million)
7 Five Forces Analysis
- 7.1 Five forces summary
- Five forces analysis - Comparison between 2023 and 2028
- 7.2 Bargaining power of buyers
- Bargaining power of buyers - Impact of key factors 2023 and 2028
- 7.3 Bargaining power of suppliers
- Bargaining power of suppliers - Impact of key factors in 2023 and 2028
- 7.4 Threat of new entrants
- Threat of new entrants - Impact of key factors in 2023 and 2028
- 7.5 Threat of substitutes
- Threat of substitutes - Impact of key factors in 2023 and 2028
- 7.6 Threat of rivalry
- Threat of rivalry - Impact of key factors in 2023 and 2028
- 7.7 Market condition
- Chart on Market condition - Five forces 2023 and 2028
8 Market Segmentation by Feedstock
- 8.1 Market segments
- Chart on Feedstock - Market share 2023-2028 (%)
- Data Table on Feedstock - Market share 2023-2028 (%)
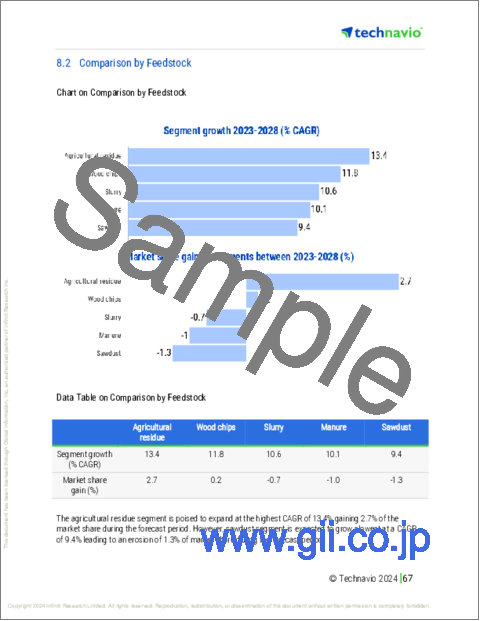
- 8.2 Comparison by Feedstock
- Chart on Comparison by Feedstock
- Data Table on Comparison by Feedstock
- 8.3 Agricultural residue - Market size and forecast 2023-2028
- Chart on Agricultural residue - Market size and forecast 2023-2028 ($ million)
- Data Table on Agricultural residue - Market size and forecast 2023-2028 ($ million)
- Chart on Agricultural residue - Year-over-year growth 2023-2028 (%)
- Data Table on Agricultural residue - Year-over-year growth 2023-2028 (%)
- 8.4 Wood chips - Market size and forecast 2023-2028
- Chart on Wood chips - Market size and forecast 2023-2028 ($ million)
- Data Table on Wood chips - Market size and forecast 2023-2028 ($ million)
- Chart on Wood chips - Year-over-year growth 2023-2028 (%)
- Data Table on Wood chips - Year-over-year growth 2023-2028 (%)
- 8.5 Slurry - Market size and forecast 2023-2028
- Chart on Slurry - Market size and forecast 2023-2028 ($ million)
- Data Table on Slurry - Market size and forecast 2023-2028 ($ million)
- Chart on Slurry - Year-over-year growth 2023-2028 (%)
- Data Table on Slurry - Year-over-year growth 2023-2028 (%)
- 8.6 Manure - Market size and forecast 2023-2028
- Chart on Manure - Market size and forecast 2023-2028 ($ million)
- Data Table on Manure - Market size and forecast 2023-2028 ($ million)
- Chart on Manure - Year-over-year growth 2023-2028 (%)
- Data Table on Manure - Year-over-year growth 2023-2028 (%)
- 8.7 Sawdust - Market size and forecast 2023-2028
- Chart on Sawdust - Market size and forecast 2023-2028 ($ million)
- Data Table on Sawdust - Market size and forecast 2023-2028 ($ million)
- Chart on Sawdust - Year-over-year growth 2023-2028 (%)
- Data Table on Sawdust - Year-over-year growth 2023-2028 (%)
- 8.8 Market opportunity by Feedstock
- Market opportunity by Feedstock ($ million)
- Data Table on Market opportunity by Feedstock ($ million)
9 Market Segmentation by Type
- 9.1 Market segments
- Chart on Type - Market share 2023-2028 (%)
- Data Table on Type - Market share 2023-2028 (%)
- 9.2 Comparison by Type
- Chart on Comparison by Type
- Data Table on Comparison by Type
- 9.3 Batch reactors - Market size and forecast 2023-2028
- Chart on Batch reactors - Market size and forecast 2023-2028 ($ million)
- Data Table on Batch reactors - Market size and forecast 2023-2028 ($ million)
- Chart on Batch reactors - Year-over-year growth 2023-2028 (%)
- Data Table on Batch reactors - Year-over-year growth 2023-2028 (%)
- 9.4 Continuous reactors - Market size and forecast 2023-2028
- Chart on Continuous reactors - Market size and forecast 2023-2028 ($ million)
- Data Table on Continuous reactors - Market size and forecast 2023-2028 ($ million)
- Chart on Continuous reactors - Year-over-year growth 2023-2028 (%)
- Data Table on Continuous reactors - Year-over-year growth 2023-2028 (%)
- 9.5 Portable reactors - Market size and forecast 2023-2028
- Chart on Portable reactors - Market size and forecast 2023-2028 ($ million)
- Data Table on Portable reactors - Market size and forecast 2023-2028 ($ million)
- Chart on Portable reactors - Year-over-year growth 2023-2028 (%)
- Data Table on Portable reactors - Year-over-year growth 2023-2028 (%)
- 9.6 Fluidized bed reactors - Market size and forecast 2023-2028
- Chart on Fluidized bed reactors - Market size and forecast 2023-2028 ($ million)
- Data Table on Fluidized bed reactors - Market size and forecast 2023-2028 ($ million)
- Chart on Fluidized bed reactors - Year-over-year growth 2023-2028 (%)
- Data Table on Fluidized bed reactors - Year-over-year growth 2023-2028 (%)
- 9.7 Market opportunity by Type
- Market opportunity by Type ($ million)
- Data Table on Market opportunity by Type ($ million)
10 Customer Landscape
- 10.1 Customer landscape overview
- Analysis of price sensitivity, lifecycle, customer purchase basket, adoption rates, and purchase criteria
11 Geographic Landscape
- 11.1 Geographic segmentation
- Chart on Market share by geography 2023-2028 (%)
- Data Table on Market share by geography 2023-2028 (%)
- 11.2 Geographic comparison
- Chart on Geographic comparison
- Data Table on Geographic comparison
- 11.3 North America - Market size and forecast 2023-2028
- Chart on North America - Market size and forecast 2023-2028 ($ million)
- Data Table on North America - Market size and forecast 2023-2028 ($ million)
- Chart on North America - Year-over-year growth 2023-2028 (%)
- Data Table on North America - Year-over-year growth 2023-2028 (%)
- 11.4 Europe - Market size and forecast 2023-2028
- Chart on Europe - Market size and forecast 2023-2028 ($ million)
- Data Table on Europe - Market size and forecast 2023-2028 ($ million)
- Chart on Europe - Year-over-year growth 2023-2028 (%)
- Data Table on Europe - Year-over-year growth 2023-2028 (%)
- 11.5 APAC - Market size and forecast 2023-2028
- Chart on APAC - Market size and forecast 2023-2028 ($ million)
- Data Table on APAC - Market size and forecast 2023-2028 ($ million)
- Chart on APAC - Year-over-year growth 2023-2028 (%)
- Data Table on APAC - Year-over-year growth 2023-2028 (%)
- 11.6 South America - Market size and forecast 2023-2028
- Chart on South America - Market size and forecast 2023-2028 ($ million)
- Data Table on South America - Market size and forecast 2023-2028 ($ million)
- Chart on South America - Year-over-year growth 2023-2028 (%)
- Data Table on South America - Year-over-year growth 2023-2028 (%)
- 11.7 Middle East and Africa - Market size and forecast 2023-2028
- Chart on Middle East and Africa - Market size and forecast 2023-2028 ($ million)
- Data Table on Middle East and Africa - Market size and forecast 2023-2028 ($ million)
- Chart on Middle East and Africa - Year-over-year growth 2023-2028 (%)
- Data Table on Middle East and Africa - Year-over-year growth 2023-2028 (%)
- 11.8 US - Market size and forecast 2023-2028
- Chart on US - Market size and forecast 2023-2028 ($ million)
- Data Table on US - Market size and forecast 2023-2028 ($ million)
- Chart on US - Year-over-year growth 2023-2028 (%)
- Data Table on US - Year-over-year growth 2023-2028 (%)
- 11.9 Canada - Market size and forecast 2023-2028
- Chart on Canada - Market size and forecast 2023-2028 ($ million)
- Data Table on Canada - Market size and forecast 2023-2028 ($ million)
- Chart on Canada - Year-over-year growth 2023-2028 (%)
- Data Table on Canada - Year-over-year growth 2023-2028 (%)
- 11.10 Germany - Market size and forecast 2023-2028
- Chart on Germany - Market size and forecast 2023-2028 ($ million)
- Data Table on Germany - Market size and forecast 2023-2028 ($ million)
- Chart on Germany - Year-over-year growth 2023-2028 (%)
- Data Table on Germany - Year-over-year growth 2023-2028 (%)
- 11.11 China - Market size and forecast 2023-2028
- Chart on China - Market size and forecast 2023-2028 ($ million)
- Data Table on China - Market size and forecast 2023-2028 ($ million)
- Chart on China - Year-over-year growth 2023-2028 (%)
- Data Table on China - Year-over-year growth 2023-2028 (%)
- 11.12 UK - Market size and forecast 2023-2028
- Chart on UK - Market size and forecast 2023-2028 ($ million)
- Data Table on UK - Market size and forecast 2023-2028 ($ million)
- Chart on UK - Year-over-year growth 2023-2028 (%)
- Data Table on UK - Year-over-year growth 2023-2028 (%)
- 11.13 Australia - Market size and forecast 2023-2028
- Chart on Australia - Market size and forecast 2023-2028 ($ million)
- Data Table on Australia - Market size and forecast 2023-2028 ($ million)
- Chart on Australia - Year-over-year growth 2023-2028 (%)
- Data Table on Australia - Year-over-year growth 2023-2028 (%)
- 11.14 Market opportunity by geography
- Market opportunity by geography ($ million)
- Data Tables on Market opportunity by geography ($ million)
12 Drivers, Challenges, and Opportunity/Restraints
- 12.1 Market drivers
- 12.2 Market challenges
- 12.3 Impact of drivers and challenges
- Impact of drivers and challenges in 2023 and 2028
- 12.4 Market opportunities/restraints
13 Competitive Landscape
- 13.1 Overview
- 13.2 Competitive Landscape
- Overview on criticality of inputs and factors of differentiation
- 13.3 Landscape disruption
- Overview on factors of disruption
- 13.4 Industry risks
- Impact of key risks on business
14 Competitive Analysis
- 14.1 Companies profiled
- Companies covered
- 14.2 Company ranking index
- Company ranking index
- 14.3 Market positioning of companies
- Matrix on companies position and classification
- 14.4 AGICO Cement International Engineering Co., Ltd.
- AGICO Cement International Engineering Co., Ltd. - Overview
- AGICO Cement International Engineering Co., Ltd. - Product / Service
- AGICO Cement International Engineering Co., Ltd. - Key offerings
- SWOT
- 14.5 ARTi
- ARTi - Overview
- ARTi - Product / Service
- ARTi - Key offerings
- SWOT
- 14.6 BESTON GROUP CO., LTD.
- BESTON GROUP CO., LTD. - Overview
- BESTON GROUP CO., LTD. - Product / Service
- BESTON GROUP CO., LTD. - Key offerings
- SWOT
- 14.7 Biochar Solutions Inc.
- Biochar Solutions Inc. - Overview
- Biochar Solutions Inc. - Product / Service
- Biochar Solutions Inc. - Key offerings
- SWOT
- 14.8 Bioforcetech Corp.
- Bioforcetech Corp. - Overview
- Bioforcetech Corp. - Product / Service
- Bioforcetech Corp. - Key offerings
- SWOT
- 14.9 FEECO International Inc.
- FEECO International Inc. - Overview
- FEECO International Inc. - Product / Service
- FEECO International Inc. - Key offerings
- SWOT
- 14.10 Henan Sunrishe Biochar Machine Co. Ltd.
- Henan Sunrishe Biochar Machine Co. Ltd. - Overview
- Henan Sunrishe Biochar Machine Co. Ltd. - Product / Service
- Henan Sunrishe Biochar Machine Co. Ltd. - Key offerings
- SWOT
- 14.11 Kerone Engineering Solutions LTD.,
- Kerone Engineering Solutions LTD., - Overview
- Kerone Engineering Solutions LTD., - Product / Service
- Kerone Engineering Solutions LTD., - Key offerings
- SWOT
- 14.12 Kingtiger Shanghai Environmental Technology Co., Ltd.
- Kingtiger Shanghai Environmental Technology Co., Ltd. - Overview
- Kingtiger Shanghai Environmental Technology Co., Ltd. - Product / Service
- Kingtiger Shanghai Environmental Technology Co., Ltd. - Key offerings
- SWOT
- 14.13 Klean Industries Inc.
- Klean Industries Inc. - Overview
- Klean Industries Inc. - Product / Service
- Klean Industries Inc. - Key offerings
- SWOT
- 14.14 MashMakes inc.
- MashMakes inc. - Overview
- MashMakes inc. - Product / Service
- MashMakes inc. - Key offerings
- SWOT
- 14.15 PYREG GmbH
- PYREG GmbH - Overview
- PYREG GmbH - Product / Service
- PYREG GmbH - Key offerings
- SWOT
- 14.16 Pyrotech Energy Pty Ltd
- Pyrotech Energy Pty Ltd - Overview
- Pyrotech Energy Pty Ltd - Product / Service
- Pyrotech Energy Pty Ltd - Key offerings
- SWOT
- 14.17 WasteX Pte. Ltd.
- WasteX Pte. Ltd. - Overview
- WasteX Pte. Ltd. - Product / Service
- WasteX Pte. Ltd. - Key offerings
- SWOT
- 14.18 West Salem Machinery
- West Salem Machinery - Overview
- West Salem Machinery - Product / Service
- West Salem Machinery - Key offerings
- SWOT
15 Appendix
- 15.1 Scope of the report
- 15.2 Inclusions and exclusions checklist
- Inclusions checklist
- Exclusions checklist
- 15.3 Currency conversion rates for US$
- Currency conversion rates for US$
- 15.4 Research methodology
- Research methodology
- 15.5 Data procurement
- Information sources
- 15.6 Data validation
- Data validation
- 15.7 Validation techniques employed for market sizing
- Validation techniques employed for market sizing
- 15.8 Data synthesis
- Data synthesis
- 15.9 360 degree market analysis
- 360 degree market analysis
- 15.10 List of abbreviations
- List of abbreviations
