|
|
市場調査レポート
商品コード
1557690
校正サービスの世界市場、2024~2028年Global Calibration Services Market 2024-2028 |
||||||

|
|||||||
カスタマイズ可能
|
|||||||


| 校正サービスの世界市場、2024~2028年 |
|
出版日: 2024年08月03日
発行: TechNavio
ページ情報: 英文 210 Pages
納期: 即納可能
|

全表示
- 概要
- 図表
- 目次
校正サービス市場は2023~2028年に17億8,690万米ドル、予測期間中のCAGRは5.54%で成長すると予測されます。
当レポートでは、校正サービス市場の全体的な分析、市場規模・予測、動向、成長促進要因、課題、約25のベンダーを網羅したベンダー分析などを掲載しています。
現在の市場シナリオ、最新動向と促進要因、市場環境全体に関する最新分析を提供しています。市場は、製品の安全性、品質、コンプライアンスに関する厳しい規制、エンドユーザー産業による研究開発投資の増加、世界の工業化の進展によって牽引されています。
| 市場範囲 | |
|---|---|
| 基準年 | 2024年 |
| 終了年 | 2028年 |
| 予測期間 | 2024~2028年 |
| 成長モメンタム | 加速 |
| 前年比[2024年] | 5.36% |
| CAGR | 5.54% |
| 増分額 | 17億8,690万米ドル |
本調査では、今後数年間の校正サービス市場成長を牽引する主要要因として、ベンダーによる新しい校正ソリューションの立ち上げを挙げています。また、ベンダー間の戦略的提携の増加や、校正サービスと先進デジタルソリューションの統合も、市場の大きな需要につながると考えられます。
目次
第1章 エグゼクティブサマリー
- 市場概要
第2章 Technavio分析
- 価格・ライフサイクル・顧客購入バスケット・採用率・購入基準の分析
- インプットの重要性と差別化の要因
- 混乱の要因
- 促進要因と課題の影響
第3章 市場情勢
- 市場エコシステム
- 市場の特徴
- バリューチェーン分析
第4章 市場規模の評価
- 市場の定義
- 市場セグメント分析
- 市場規模 2023年
- 市場の展望 2023~2028年
第5章 市場規模実績
- 校正サービスの世界市場 2018~2022年
- サービスタイプ別セグメント分析 2018~2022年
- サービス別セグメント分析 2018~2022年
- 地域別セグメント分析 2018~2022年
- 国別セグメント分析 2018~2022年
第6章 付加価値/数量データ
- 校正サービスの世界市場:国別2023~2028年
第7章 ファイブフォース分析
- ファイブフォースの要約
- 買い手の交渉力
- 供給企業の交渉力
- 新規参入業者の脅威
- 代替品の脅威
- 競争の脅威
- 市況
第8章 市場セグメンテーション:サービスタイプ別
- 市場セグメンテーション
- 比較:サービスタイプ別
- 電気:市場規模と予測 2023~2028年
- 機械:市場規模と予測 2023~2028年
- 熱力学:市場規模と予測 2023~2028年
- 寸法/物理的:市場規模と予測 2023~2028年
- 市場機会:サービスタイプ別
第9章 市場セグメンテーション:サービス別
- 市場セグメンテーション
- 比較:サービス別
- サードパーティベンダー:市場規模と予測 2023~2028年
- 社内研究所:市場規模と予測 2023~2028年
- OEM:市場規模と予測 2023~2028年
- 市場機会:サービス別
第10章 顧客情勢
- 顧客情勢概要
第11章 地域別情勢
- 地域別セグメンテーション
- 比較:地域別
- アジア太平洋:市場規模と予測 2023~2028年
- 北米:市場規模と予測 2023~2028年
- 欧州:市場規模と予測 2023~2028年
- 中東・アフリカ:市場規模と予測 2023~2028年
- 南米:市場規模と予測 2023~2028年
- 米国:市場規模と予測 2023~2028年
- 中国:市場規模と予測 2023~2028年
- ドイツ:市場規模と予測 2023~2028年
- 英国:市場規模と予測 2023~2028年
- 日本:市場規模と予測 2023~2028年
- インド:市場規模と予測 2023~2028年
- 市場機会:地域別
第12章 促進要因・課題・機会・抑制要因
- 市場促進要因
- 市場課題
- 促進要因と課題の影響
- 市場の機会・抑制要因
第13章 競合情勢
- 概要
- 競合情勢
- 混乱の状況
- 業界のリスク
第14章 競合分析
- 企業プロファイル
- 企業ランキング指数
- 企業の市場ポジショニング
- ABB Ltd.
- Endress Hauser Group Services AG
- ESSCO Calibration Laboratory
- Hexagon AB
- Keysight Technologies Inc.
- Micro Precision Calibration
- National Instruments Corp.
- Omega Engineering Inc.
- Rohde and Schwarz GmbH and Co. KG
- Siemens AG
- SIMCO Electronics
- Tektronix Inc.
- Transcat Inc.
- Trescal International SAS
- Viavi Solutions Inc.
第15章 付録
Exhibits:
- Exhibits1: Executive Summary - Chart on Market Overview
- Exhibits2: Executive Summary - Data Table on Market Overview
- Exhibits3: Executive Summary - Chart on Global Market Characteristics
- Exhibits4: Executive Summary - Chart on Market by Geography
- Exhibits5: Executive Summary - Chart on Market Segmentation by Service Type
- Exhibits6: Executive Summary - Chart on Market Segmentation by Service
- Exhibits7: Executive Summary - Chart on Incremental Growth
- Exhibits8: Executive Summary - Data Table on Incremental Growth
- Exhibits9: Executive Summary - Chart on Company Market Positioning
- Exhibits10: Analysis of price sensitivity, lifecycle, customer purchase basket, adoption rates, and purchase criteria
- Exhibits11: Overview on criticality of inputs and factors of differentiation
- Exhibits12: Overview on factors of disruption
- Exhibits13: Impact of drivers and challenges in 2023 and 2028
- Exhibits14: Parent Market
- Exhibits15: Data Table on - Parent Market
- Exhibits16: Market characteristics analysis
- Exhibits17: Value Chain Analysis
- Exhibits18: Offerings of companies included in the market definition
- Exhibits19: Market segments
- Exhibits20: Chart on Global - Market size and forecast 2023-2028 ($ million)
- Exhibits21: Data Table on Global - Market size and forecast 2023-2028 ($ million)
- Exhibits22: Chart on Global Market: Year-over-year growth 2023-2028 (%)
- Exhibits23: Data Table on Global Market: Year-over-year growth 2023-2028 (%)
- Exhibits24: Historic Market Size - Data Table on Global Calibration Services Market 2018 - 2022 ($ million)
- Exhibits25: Historic Market Size - Service Type Segment 2018 - 2022 ($ million)
- Exhibits26: Historic Market Size - Service Segment 2018 - 2022 ($ million)
- Exhibits27: Historic Market Size - Geography Segment 2018 - 2022 ($ million)
- Exhibits28: Historic Market Size - Country Segment 2018 - 2022 ($ million)
- Exhibits29: Market Size (value) - Data Table on Global calibration services market by Country 2023 - 2028 ($ million)
- Exhibits30: Five forces analysis - Comparison between 2023 and 2028
- Exhibits31: Bargaining power of buyers - Impact of key factors 2023 and 2028
- Exhibits32: Bargaining power of suppliers - Impact of key factors in 2023 and 2028
- Exhibits33: Threat of new entrants - Impact of key factors in 2023 and 2028
- Exhibits34: Threat of substitutes - Impact of key factors in 2023 and 2028
- Exhibits35: Threat of rivalry - Impact of key factors in 2023 and 2028
- Exhibits36: Chart on Market condition - Five forces 2023 and 2028
- Exhibits37: Chart on Service Type - Market share 2023-2028 (%)
- Exhibits38: Data Table on Service Type - Market share 2023-2028 (%)
- Exhibits39: Chart on Comparison by Service Type
- Exhibits40: Data Table on Comparison by Service Type
- Exhibits41: Chart on Electrical - Market size and forecast 2023-2028 ($ million)
- Exhibits42: Data Table on Electrical - Market size and forecast 2023-2028 ($ million)
- Exhibits43: Chart on Electrical - Year-over-year growth 2023-2028 (%)
- Exhibits44: Data Table on Electrical - Year-over-year growth 2023-2028 (%)
- Exhibits45: Chart on Mechanical - Market size and forecast 2023-2028 ($ million)
- Exhibits46: Data Table on Mechanical - Market size and forecast 2023-2028 ($ million)
- Exhibits47: Chart on Mechanical - Year-over-year growth 2023-2028 (%)
- Exhibits48: Data Table on Mechanical - Year-over-year growth 2023-2028 (%)
- Exhibits49: Chart on Thermodynamic - Market size and forecast 2023-2028 ($ million)
- Exhibits50: Data Table on Thermodynamic - Market size and forecast 2023-2028 ($ million)
- Exhibits51: Chart on Thermodynamic - Year-over-year growth 2023-2028 (%)
- Exhibits52: Data Table on Thermodynamic - Year-over-year growth 2023-2028 (%)
- Exhibits53: Chart on Dimensional/physical - Market size and forecast 2023-2028 ($ million)
- Exhibits54: Data Table on Dimensional/physical - Market size and forecast 2023-2028 ($ million)
- Exhibits55: Chart on Dimensional/physical - Year-over-year growth 2023-2028 (%)
- Exhibits56: Data Table on Dimensional/physical - Year-over-year growth 2023-2028 (%)
- Exhibits57: Market opportunity by Service Type ($ million)
- Exhibits58: Data Table on Market opportunity by Service Type ($ million)
- Exhibits59: Chart on Service - Market share 2023-2028 (%)
- Exhibits60: Data Table on Service - Market share 2023-2028 (%)
- Exhibits61: Chart on Comparison by Service
- Exhibits62: Data Table on Comparison by Service
- Exhibits63: Chart on Third party vendors - Market size and forecast 2023-2028 ($ million)
- Exhibits64: Data Table on Third party vendors - Market size and forecast 2023-2028 ($ million)
- Exhibits65: Chart on Third party vendors - Year-over-year growth 2023-2028 (%)
- Exhibits66: Data Table on Third party vendors - Year-over-year growth 2023-2028 (%)
- Exhibits67: Chart on In-house laboratories - Market size and forecast 2023-2028 ($ million)
- Exhibits68: Data Table on In-house laboratories - Market size and forecast 2023-2028 ($ million)
- Exhibits69: Chart on In-house laboratories - Year-over-year growth 2023-2028 (%)
- Exhibits70: Data Table on In-house laboratories - Year-over-year growth 2023-2028 (%)
- Exhibits71: Chart on OEMs - Market size and forecast 2023-2028 ($ million)
- Exhibits72: Data Table on OEMs - Market size and forecast 2023-2028 ($ million)
- Exhibits73: Chart on OEMs - Year-over-year growth 2023-2028 (%)
- Exhibits74: Data Table on OEMs - Year-over-year growth 2023-2028 (%)
- Exhibits75: Market opportunity by Service ($ million)
- Exhibits76: Data Table on Market opportunity by Service ($ million)
- Exhibits77: Analysis of price sensitivity, lifecycle, customer purchase basket, adoption rates, and purchase criteria
- Exhibits78: Chart on Market share by geography 2023-2028 (%)
- Exhibits79: Data Table on Market share by geography 2023-2028 (%)
- Exhibits80: Chart on Geographic comparison
- Exhibits81: Data Table on Geographic comparison
- Exhibits82: Chart on APAC - Market size and forecast 2023-2028 ($ million)
- Exhibits83: Data Table on APAC - Market size and forecast 2023-2028 ($ million)
- Exhibits84: Chart on APAC - Year-over-year growth 2023-2028 (%)
- Exhibits85: Data Table on APAC - Year-over-year growth 2023-2028 (%)
- Exhibits86: Chart on North America - Market size and forecast 2023-2028 ($ million)
- Exhibits87: Data Table on North America - Market size and forecast 2023-2028 ($ million)
- Exhibits88: Chart on North America - Year-over-year growth 2023-2028 (%)
- Exhibits89: Data Table on North America - Year-over-year growth 2023-2028 (%)
- Exhibits90: Chart on Europe - Market size and forecast 2023-2028 ($ million)
- Exhibits91: Data Table on Europe - Market size and forecast 2023-2028 ($ million)
- Exhibits92: Chart on Europe - Year-over-year growth 2023-2028 (%)
- Exhibits93: Data Table on Europe - Year-over-year growth 2023-2028 (%)
- Exhibits94: Chart on Middle East and Africa - Market size and forecast 2023-2028 ($ million)
- Exhibits95: Data Table on Middle East and Africa - Market size and forecast 2023-2028 ($ million)
- Exhibits96: Chart on Middle East and Africa - Year-over-year growth 2023-2028 (%)
- Exhibits97: Data Table on Middle East and Africa - Year-over-year growth 2023-2028 (%)
- Exhibits98: Chart on South America - Market size and forecast 2023-2028 ($ million)
- Exhibits99: Data Table on South America - Market size and forecast 2023-2028 ($ million)
- Exhibits100: Chart on South America - Year-over-year growth 2023-2028 (%)
- Exhibits101: Data Table on South America - Year-over-year growth 2023-2028 (%)
- Exhibits102: Chart on US - Market size and forecast 2023-2028 ($ million)
- Exhibits103: Data Table on US - Market size and forecast 2023-2028 ($ million)
- Exhibits104: Chart on US - Year-over-year growth 2023-2028 (%)
- Exhibits105: Data Table on US - Year-over-year growth 2023-2028 (%)
- Exhibits106: Chart on China - Market size and forecast 2023-2028 ($ million)
- Exhibits107: Data Table on China - Market size and forecast 2023-2028 ($ million)
- Exhibits108: Chart on China - Year-over-year growth 2023-2028 (%)
- Exhibits109: Data Table on China - Year-over-year growth 2023-2028 (%)
- Exhibits110: Chart on Germany - Market size and forecast 2023-2028 ($ million)
- Exhibits111: Data Table on Germany - Market size and forecast 2023-2028 ($ million)
- Exhibits112: Chart on Germany - Year-over-year growth 2023-2028 (%)
- Exhibits113: Data Table on Germany - Year-over-year growth 2023-2028 (%)
- Exhibits114: Chart on UK - Market size and forecast 2023-2028 ($ million)
- Exhibits115: Data Table on UK - Market size and forecast 2023-2028 ($ million)
- Exhibits116: Chart on UK - Year-over-year growth 2023-2028 (%)
- Exhibits117: Data Table on UK - Year-over-year growth 2023-2028 (%)
- Exhibits118: Chart on Japan - Market size and forecast 2023-2028 ($ million)
- Exhibits119: Data Table on Japan - Market size and forecast 2023-2028 ($ million)
- Exhibits120: Chart on Japan - Year-over-year growth 2023-2028 (%)
- Exhibits121: Data Table on Japan - Year-over-year growth 2023-2028 (%)
- Exhibits122: Chart on India - Market size and forecast 2023-2028 ($ million)
- Exhibits123: Data Table on India - Market size and forecast 2023-2028 ($ million)
- Exhibits124: Chart on India - Year-over-year growth 2023-2028 (%)
- Exhibits125: Data Table on India - Year-over-year growth 2023-2028 (%)
- Exhibits126: Market opportunity by geography ($ million)
- Exhibits127: Data Tables on Market opportunity by geography ($ million)
- Exhibits128: Impact of drivers and challenges in 2023 and 2028
- Exhibits129: Overview on criticality of inputs and factors of differentiation
- Exhibits130: Overview on factors of disruption
- Exhibits131: Impact of key risks on business
- Exhibits132: Companies covered
- Exhibits133: Company ranking index
- Exhibits134: Matrix on companies position and classification
- Exhibits135: ABB Ltd. - Overview
- Exhibits136: ABB Ltd. - Business segments
- Exhibits137: ABB Ltd. - Key news
- Exhibits138: ABB Ltd. - Key offerings
- Exhibits139: ABB Ltd. - Segment focus
- Exhibits140: SWOT
- Exhibits141: Endress Hauser Group Services AG - Overview
- Exhibits142: Endress Hauser Group Services AG - Product / Service
- Exhibits143: Endress Hauser Group Services AG - Key news
- Exhibits144: Endress Hauser Group Services AG - Key offerings
- Exhibits145: SWOT
- Exhibits146: ESSCO Calibration Laboratory - Overview
- Exhibits147: ESSCO Calibration Laboratory - Product / Service
- Exhibits148: ESSCO Calibration Laboratory - Key offerings
- Exhibits149: SWOT
- Exhibits150: Hexagon AB - Overview
- Exhibits151: Hexagon AB - Business segments
- Exhibits152: Hexagon AB - Key offerings
- Exhibits153: Hexagon AB - Segment focus
- Exhibits154: SWOT
- Exhibits155: Keysight Technologies Inc. - Overview
- Exhibits156: Keysight Technologies Inc. - Business segments
- Exhibits157: Keysight Technologies Inc. - Key news
- Exhibits158: Keysight Technologies Inc. - Key offerings
- Exhibits159: Keysight Technologies Inc. - Segment focus
- Exhibits160: SWOT
- Exhibits161: Micro Precision Calibration - Overview
- Exhibits162: Micro Precision Calibration - Product / Service
- Exhibits163: Micro Precision Calibration - Key offerings
- Exhibits164: SWOT
- Exhibits165: National Instruments Corp. - Overview
- Exhibits166: National Instruments Corp. - Product / Service
- Exhibits167: National Instruments Corp. - Key offerings
- Exhibits168: SWOT
- Exhibits169: Omega Engineering Inc. - Overview
- Exhibits170: Omega Engineering Inc. - Product / Service
- Exhibits171: Omega Engineering Inc. - Key offerings
- Exhibits172: SWOT
- Exhibits173: Rohde and Schwarz GmbH and Co. KG - Overview
- Exhibits174: Rohde and Schwarz GmbH and Co. KG - Product / Service
- Exhibits175: Rohde and Schwarz GmbH and Co. KG - Key news
- Exhibits176: Rohde and Schwarz GmbH and Co. KG - Key offerings
- Exhibits177: SWOT
- Exhibits178: Siemens AG - Overview
- Exhibits179: Siemens AG - Business segments
- Exhibits180: Siemens AG - Key news
- Exhibits181: Siemens AG - Key offerings
- Exhibits182: Siemens AG - Segment focus
- Exhibits183: SWOT
- Exhibits184: SIMCO Electronics - Overview
- Exhibits185: SIMCO Electronics - Product / Service
- Exhibits186: SIMCO Electronics - Key offerings
- Exhibits187: SWOT
- Exhibits188: Tektronix Inc. - Overview
- Exhibits189: Tektronix Inc. - Product / Service
- Exhibits190: Tektronix Inc. - Key offerings
- Exhibits191: SWOT
- Exhibits192: Transcat Inc. - Overview
- Exhibits193: Transcat Inc. - Business segments
- Exhibits194: Transcat Inc. - Key offerings
- Exhibits195: Transcat Inc. - Segment focus
- Exhibits196: SWOT
- Exhibits197: Trescal International SAS - Overview
- Exhibits198: Trescal International SAS - Product / Service
- Exhibits199: Trescal International SAS - Key offerings
- Exhibits200: SWOT
- Exhibits201: Viavi Solutions Inc. - Overview
- Exhibits202: Viavi Solutions Inc. - Business segments
- Exhibits203: Viavi Solutions Inc. - Key news
- Exhibits204: Viavi Solutions Inc. - Key offerings
- Exhibits205: Viavi Solutions Inc. - Segment focus
- Exhibits206: SWOT
- Exhibits207: Inclusions checklist
- Exhibits208: Exclusions checklist
- Exhibits209: Currency conversion rates for US$
- Exhibits210: Research methodology
- Exhibits211: Information sources
- Exhibits212: Data validation
- Exhibits213: Validation techniques employed for market sizing
- Exhibits214: Data synthesis
- Exhibits215: 360 degree market analysis
- Exhibits216: List of abbreviations
The calibration services market is forecasted to grow by USD 1786.9 mn during 2023-2028, accelerating at a CAGR of 5.54% during the forecast period. The report on the calibration services market provides a holistic analysis, market size and forecast, trends, growth drivers, and challenges, as well as vendor analysis covering around 25 vendors.
The report offers an up-to-date analysis regarding the current market scenario, the latest trends and drivers, and the overall market environment. The market is driven by stringent regulations related to product safety, quality, and compliance, increased investment in research and development by end-user industries, and growing industrialization globally.
Technavio's calibration services market is segmented as below:
| Market Scope | |
|---|---|
| Base Year | 2024 |
| End Year | 2028 |
| Series Year | 2024-2028 |
| Growth Momentum | Accelerate |
| YOY 2024 | 5.36% |
| CAGR | 5.54% |
| Incremental Value | $1786.9mn |
By Service Type
- Electrical
- Mechanical
- Thermodynamic
- Dimensional/physical
By Service
- Third party vendors
- In-house laboratories
- OEMs
By Geography
- APAC
- North America
- Europe
- Middle East and Africa
- South America
This study identifies the launch of new calibration solutions by vendors as one of the prime reasons driving the calibration services market growth during the next few years. Also, increasing number of strategic alliances among vendors and integration of calibration services with advanced digital solutions will lead to sizable demand in the market.
The report on the calibration services market covers the following areas:
- Calibration services market sizing
- Calibration services market forecast
- Calibration services market industry analysis
The robust vendor analysis is designed to help clients improve their market position, and in line with this, this report provides a detailed analysis of several leading calibration services market vendors that include ABB Ltd., Beamex Oy AB, Bureau Veritas SA, Endress Hauser Group Services AG, ESSCO Calibration Laboratory, Eurofins Scientific SE, Fluke Corp., Hexagon AB, Intertek Group Plc, Keysight Technologies Inc., Micro Precision Calibration, Mitutoyo America Corp., National Instruments Corp., Omega Engineering Inc., Pratt and Whitney Measurement Systems, Inc., Rohde and Schwarz GmbH and Co. KG, SGS SA, Siemens AG, SIMCO Electronics, Tektronix Inc., Transcat Inc., Trescal International SAS, and Viavi Solutions Inc.. Also, the calibration services market analysis report includes information on upcoming trends and challenges that will influence market growth. This is to help companies strategize and leverage all forthcoming growth opportunities.
The study was conducted using an objective combination of primary and secondary information including inputs from key participants in the industry. The report contains a comprehensive market and vendor landscape in addition to an analysis of the key vendors.
The publisher presents a detailed picture of the market by the way of study, synthesis, and summation of data from multiple sources by an analysis of key parameters such as profit, pricing, competition, and promotions. It presents various market facets by identifying the key industry influencers. The data presented is comprehensive, reliable, and a result of extensive research - both primary and secondary. The market research reports provide a complete competitive landscape and an in-depth vendor selection methodology and analysis using qualitative and quantitative research to forecast the accurate market growth.
Table of Contents
1 Executive Summary
- 1.1 Market overview
- Executive Summary - Chart on Market Overview
- Executive Summary - Data Table on Market Overview
- Executive Summary - Chart on Global Market Characteristics
- Executive Summary - Chart on Market by Geography
- Executive Summary - Chart on Market Segmentation by Service Type
- Executive Summary - Chart on Market Segmentation by Service
- Executive Summary - Chart on Incremental Growth
- Executive Summary - Data Table on Incremental Growth
- Executive Summary - Chart on Company Market Positioning
2 Technavio Analysis
- 2.1 Analysis of price sensitivity, lifecycle, customer purchase basket, adoption rates, and purchase criteria
- Analysis of price sensitivity, lifecycle, customer purchase basket, adoption rates, and purchase criteria
- 2.2 Criticality of inputs and Factors of differentiation
- Overview on criticality of inputs and factors of differentiation
- 2.3 Factors of disruption
- Overview on factors of disruption
- 2.4 Impact of drivers and challenges
- Impact of drivers and challenges in 2023 and 2028
3 Market Landscape
- 3.1 Market ecosystem
- Parent Market
- Data Table on - Parent Market
- 3.2 Market characteristics
- Market characteristics analysis
- 3.3 Value chain analysis
- Value Chain Analysis
4 Market Sizing
- 4.1 Market definition
- Offerings of companies included in the market definition
- 4.2 Market segment analysis
- Market segments
- 4.3 Market size 2023
- 4.4 Market outlook: Forecast for 2023-2028
- Chart on Global - Market size and forecast 2023-2028 ($ million)
- Data Table on Global - Market size and forecast 2023-2028 ($ million)
- Chart on Global Market: Year-over-year growth 2023-2028 (%)
- Data Table on Global Market: Year-over-year growth 2023-2028 (%)
5 Historic Market Size
- 5.1 Global Calibration Services Market 2018 - 2022
- Historic Market Size - Data Table on Global Calibration Services Market 2018 - 2022 ($ million)
- 5.2 Service Type segment analysis 2018 - 2022
- Historic Market Size - Service Type Segment 2018 - 2022 ($ million)
- 5.3 Service segment analysis 2018 - 2022
- Historic Market Size - Service Segment 2018 - 2022 ($ million)
- 5.4 Geography segment analysis 2018 - 2022
- Historic Market Size - Geography Segment 2018 - 2022 ($ million)
- 5.5 Country segment analysis 2018 - 2022
- Historic Market Size - Country Segment 2018 - 2022 ($ million)
6 Additional Value/Volume Data
- 6.1 Global calibration services market by country 2023 - 2028 ($ million)
- Market Size (value) - Data Table on Global calibration services market by Country 2023 - 2028 ($ million)
7 Five Forces Analysis
- 7.1 Five forces summary
- Five forces analysis - Comparison between 2023 and 2028
- 7.2 Bargaining power of buyers
- Bargaining power of buyers - Impact of key factors 2023 and 2028
- 7.3 Bargaining power of suppliers
- Bargaining power of suppliers - Impact of key factors in 2023 and 2028
- 7.4 Threat of new entrants
- Threat of new entrants - Impact of key factors in 2023 and 2028
- 7.5 Threat of substitutes
- Threat of substitutes - Impact of key factors in 2023 and 2028
- 7.6 Threat of rivalry
- Threat of rivalry - Impact of key factors in 2023 and 2028
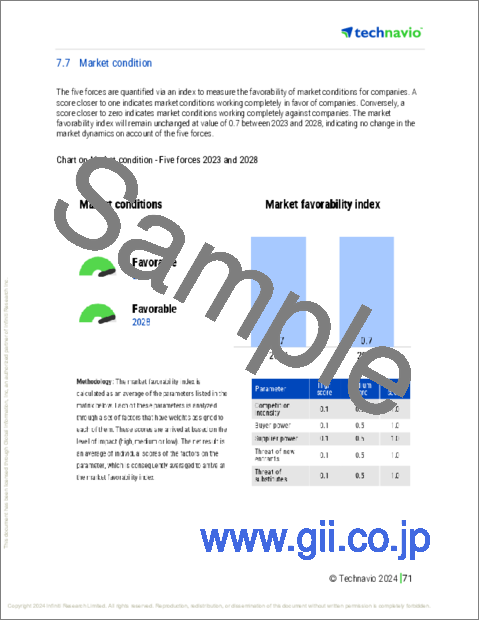
- 7.7 Market condition
- Chart on Market condition - Five forces 2023 and 2028
8 Market Segmentation by Service Type
- 8.1 Market segments
- Chart on Service Type - Market share 2023-2028 (%)
- Data Table on Service Type - Market share 2023-2028 (%)
- 8.2 Comparison by Service Type
- Chart on Comparison by Service Type
- Data Table on Comparison by Service Type
- 8.3 Electrical - Market size and forecast 2023-2028
- Chart on Electrical - Market size and forecast 2023-2028 ($ million)
- Data Table on Electrical - Market size and forecast 2023-2028 ($ million)
- Chart on Electrical - Year-over-year growth 2023-2028 (%)
- Data Table on Electrical - Year-over-year growth 2023-2028 (%)
- 8.4 Mechanical - Market size and forecast 2023-2028
- Chart on Mechanical - Market size and forecast 2023-2028 ($ million)
- Data Table on Mechanical - Market size and forecast 2023-2028 ($ million)
- Chart on Mechanical - Year-over-year growth 2023-2028 (%)
- Data Table on Mechanical - Year-over-year growth 2023-2028 (%)
- 8.5 Thermodynamic - Market size and forecast 2023-2028
- Chart on Thermodynamic - Market size and forecast 2023-2028 ($ million)
- Data Table on Thermodynamic - Market size and forecast 2023-2028 ($ million)
- Chart on Thermodynamic - Year-over-year growth 2023-2028 (%)
- Data Table on Thermodynamic - Year-over-year growth 2023-2028 (%)
- 8.6 Dimensional/physical - Market size and forecast 2023-2028
- Chart on Dimensional/physical - Market size and forecast 2023-2028 ($ million)
- Data Table on Dimensional/physical - Market size and forecast 2023-2028 ($ million)
- Chart on Dimensional/physical - Year-over-year growth 2023-2028 (%)
- Data Table on Dimensional/physical - Year-over-year growth 2023-2028 (%)
- 8.7 Market opportunity by Service Type
- Market opportunity by Service Type ($ million)
- Data Table on Market opportunity by Service Type ($ million)
9 Market Segmentation by Service
- 9.1 Market segments
- Chart on Service - Market share 2023-2028 (%)
- Data Table on Service - Market share 2023-2028 (%)
- 9.2 Comparison by Service
- Chart on Comparison by Service
- Data Table on Comparison by Service
- 9.3 Third party vendors - Market size and forecast 2023-2028
- Chart on Third party vendors - Market size and forecast 2023-2028 ($ million)
- Data Table on Third party vendors - Market size and forecast 2023-2028 ($ million)
- Chart on Third party vendors - Year-over-year growth 2023-2028 (%)
- Data Table on Third party vendors - Year-over-year growth 2023-2028 (%)
- 9.4 In-house laboratories - Market size and forecast 2023-2028
- Chart on In-house laboratories - Market size and forecast 2023-2028 ($ million)
- Data Table on In-house laboratories - Market size and forecast 2023-2028 ($ million)
- Chart on In-house laboratories - Year-over-year growth 2023-2028 (%)
- Data Table on In-house laboratories - Year-over-year growth 2023-2028 (%)
- 9.5 OEMs - Market size and forecast 2023-2028
- Chart on OEMs - Market size and forecast 2023-2028 ($ million)
- Data Table on OEMs - Market size and forecast 2023-2028 ($ million)
- Chart on OEMs - Year-over-year growth 2023-2028 (%)
- Data Table on OEMs - Year-over-year growth 2023-2028 (%)
- 9.6 Market opportunity by Service
- Market opportunity by Service ($ million)
- Data Table on Market opportunity by Service ($ million)
10 Customer Landscape
- 10.1 Customer landscape overview
- Analysis of price sensitivity, lifecycle, customer purchase basket, adoption rates, and purchase criteria
11 Geographic Landscape
- 11.1 Geographic segmentation
- Chart on Market share by geography 2023-2028 (%)
- Data Table on Market share by geography 2023-2028 (%)
- 11.2 Geographic comparison
- Chart on Geographic comparison
- Data Table on Geographic comparison
- 11.3 APAC - Market size and forecast 2023-2028
- Chart on APAC - Market size and forecast 2023-2028 ($ million)
- Data Table on APAC - Market size and forecast 2023-2028 ($ million)
- Chart on APAC - Year-over-year growth 2023-2028 (%)
- Data Table on APAC - Year-over-year growth 2023-2028 (%)
- 11.4 North America - Market size and forecast 2023-2028
- Chart on North America - Market size and forecast 2023-2028 ($ million)
- Data Table on North America - Market size and forecast 2023-2028 ($ million)
- Chart on North America - Year-over-year growth 2023-2028 (%)
- Data Table on North America - Year-over-year growth 2023-2028 (%)
- 11.5 Europe - Market size and forecast 2023-2028
- Chart on Europe - Market size and forecast 2023-2028 ($ million)
- Data Table on Europe - Market size and forecast 2023-2028 ($ million)
- Chart on Europe - Year-over-year growth 2023-2028 (%)
- Data Table on Europe - Year-over-year growth 2023-2028 (%)
- 11.6 Middle East and Africa - Market size and forecast 2023-2028
- Chart on Middle East and Africa - Market size and forecast 2023-2028 ($ million)
- Data Table on Middle East and Africa - Market size and forecast 2023-2028 ($ million)
- Chart on Middle East and Africa - Year-over-year growth 2023-2028 (%)
- Data Table on Middle East and Africa - Year-over-year growth 2023-2028 (%)
- 11.7 South America - Market size and forecast 2023-2028
- Chart on South America - Market size and forecast 2023-2028 ($ million)
- Data Table on South America - Market size and forecast 2023-2028 ($ million)
- Chart on South America - Year-over-year growth 2023-2028 (%)
- Data Table on South America - Year-over-year growth 2023-2028 (%)
- 11.8 US - Market size and forecast 2023-2028
- Chart on US - Market size and forecast 2023-2028 ($ million)
- Data Table on US - Market size and forecast 2023-2028 ($ million)
- Chart on US - Year-over-year growth 2023-2028 (%)
- Data Table on US - Year-over-year growth 2023-2028 (%)
- 11.9 China - Market size and forecast 2023-2028
- Chart on China - Market size and forecast 2023-2028 ($ million)
- Data Table on China - Market size and forecast 2023-2028 ($ million)
- Chart on China - Year-over-year growth 2023-2028 (%)
- Data Table on China - Year-over-year growth 2023-2028 (%)
- 11.10 Germany - Market size and forecast 2023-2028
- Chart on Germany - Market size and forecast 2023-2028 ($ million)
- Data Table on Germany - Market size and forecast 2023-2028 ($ million)
- Chart on Germany - Year-over-year growth 2023-2028 (%)
- Data Table on Germany - Year-over-year growth 2023-2028 (%)
- 11.11 UK - Market size and forecast 2023-2028
- Chart on UK - Market size and forecast 2023-2028 ($ million)
- Data Table on UK - Market size and forecast 2023-2028 ($ million)
- Chart on UK - Year-over-year growth 2023-2028 (%)
- Data Table on UK - Year-over-year growth 2023-2028 (%)
- 11.12 Japan - Market size and forecast 2023-2028
- Chart on Japan - Market size and forecast 2023-2028 ($ million)
- Data Table on Japan - Market size and forecast 2023-2028 ($ million)
- Chart on Japan - Year-over-year growth 2023-2028 (%)
- Data Table on Japan - Year-over-year growth 2023-2028 (%)
- 11.13 India - Market size and forecast 2023-2028
- Chart on India - Market size and forecast 2023-2028 ($ million)
- Data Table on India - Market size and forecast 2023-2028 ($ million)
- Chart on India - Year-over-year growth 2023-2028 (%)
- Data Table on India - Year-over-year growth 2023-2028 (%)
- 11.14 Market opportunity by geography
- Market opportunity by geography ($ million)
- Data Tables on Market opportunity by geography ($ million)
12 Drivers, Challenges, and Opportunity/Restraints
- 12.1 Market drivers
- 12.2 Market challenges
- 12.3 Impact of drivers and challenges
- Impact of drivers and challenges in 2023 and 2028
- 12.4 Market opportunities/restraints
13 Competitive Landscape
- 13.1 Overview
- 13.2 Competitive Landscape
- Overview on criticality of inputs and factors of differentiation
- 13.3 Landscape disruption
- Overview on factors of disruption
- 13.4 Industry risks
- Impact of key risks on business
14 Competitive Analysis
- 14.1 Companies profiled
- Companies covered
- 14.2 Company ranking index
- Company ranking index
- 14.3 Market positioning of companies
- Matrix on companies position and classification
- 14.4 ABB Ltd.
- ABB Ltd. - Overview
- ABB Ltd. - Business segments
- ABB Ltd. - Key news
- ABB Ltd. - Key offerings
- ABB Ltd. - Segment focus
- SWOT
- 14.5 Endress Hauser Group Services AG
- Endress Hauser Group Services AG - Overview
- Endress Hauser Group Services AG - Product / Service
- Endress Hauser Group Services AG - Key news
- Endress Hauser Group Services AG - Key offerings
- SWOT
- 14.6 ESSCO Calibration Laboratory
- ESSCO Calibration Laboratory - Overview
- ESSCO Calibration Laboratory - Product / Service
- ESSCO Calibration Laboratory - Key offerings
- SWOT
- 14.7 Hexagon AB
- Hexagon AB - Overview
- Hexagon AB - Business segments
- Hexagon AB - Key offerings
- Hexagon AB - Segment focus
- SWOT
- 14.8 Keysight Technologies Inc.
- Keysight Technologies Inc. - Overview
- Keysight Technologies Inc. - Business segments
- Keysight Technologies Inc. - Key news
- Keysight Technologies Inc. - Key offerings
- Keysight Technologies Inc. - Segment focus
- SWOT
- 14.9 Micro Precision Calibration
- Micro Precision Calibration - Overview
- Micro Precision Calibration - Product / Service
- Micro Precision Calibration - Key offerings
- SWOT
- 14.10 National Instruments Corp.
- National Instruments Corp. - Overview
- National Instruments Corp. - Product / Service
- National Instruments Corp. - Key offerings
- SWOT
- 14.11 Omega Engineering Inc.
- Omega Engineering Inc. - Overview
- Omega Engineering Inc. - Product / Service
- Omega Engineering Inc. - Key offerings
- SWOT
- 14.12 Rohde and Schwarz GmbH and Co. KG
- Rohde and Schwarz GmbH and Co. KG - Overview
- Rohde and Schwarz GmbH and Co. KG - Product / Service
- Rohde and Schwarz GmbH and Co. KG - Key news
- Rohde and Schwarz GmbH and Co. KG - Key offerings
- SWOT
- 14.13 Siemens AG
- Siemens AG - Overview
- Siemens AG - Business segments
- Siemens AG - Key news
- Siemens AG - Key offerings
- Siemens AG - Segment focus
- SWOT
- 14.14 SIMCO Electronics
- SIMCO Electronics - Overview
- SIMCO Electronics - Product / Service
- SIMCO Electronics - Key offerings
- SWOT
- 14.15 Tektronix Inc.
- Tektronix Inc. - Overview
- Tektronix Inc. - Product / Service
- Tektronix Inc. - Key offerings
- SWOT
- 14.16 Transcat Inc.
- Transcat Inc. - Overview
- Transcat Inc. - Business segments
- Transcat Inc. - Key offerings
- Transcat Inc. - Segment focus
- SWOT
- 14.17 Trescal International SAS
- Trescal International SAS - Overview
- Trescal International SAS - Product / Service
- Trescal International SAS - Key offerings
- SWOT
- 14.18 Viavi Solutions Inc.
- Viavi Solutions Inc. - Overview
- Viavi Solutions Inc. - Business segments
- Viavi Solutions Inc. - Key news
- Viavi Solutions Inc. - Key offerings
- Viavi Solutions Inc. - Segment focus
- SWOT
15 Appendix
- 15.1 Scope of the report
- 15.2 Inclusions and exclusions checklist
- Inclusions checklist
- Exclusions checklist
- 15.3 Currency conversion rates for US$
- Currency conversion rates for US$
- 15.4 Research methodology
- Research methodology
- 15.5 Data procurement
- Information sources
- 15.6 Data validation
- Data validation
- 15.7 Validation techniques employed for market sizing
- Validation techniques employed for market sizing
- 15.8 Data synthesis
- Data synthesis
- 15.9 360 degree market analysis
- 360 degree market analysis
- 15.10 List of abbreviations
- List of abbreviations

