|
|
市場調査レポート
商品コード
1557676
蒸発冷却の世界市場 2024年~2028年Global Evaporative Cooling Market 2024-2028 |
||||||

|
|||||||
カスタマイズ可能
|
|||||||

| 蒸発冷却の世界市場 2024年~2028年 |
|
出版日: 2024年07月12日
発行: TechNavio
ページ情報: 英文 161 Pages
納期: 即納可能
|

全表示
- 概要
- 図表
- 目次
蒸発冷却市場は2023年~2028年年に18億600万米ドル、予測期間中のCAGRは6.78%で成長すると予測されます。
当レポートでは、蒸発冷却市場の全体的な分析、市場規模・予測、動向、成長促進要因、課題、約25のベンダーを網羅したベンダー分析などを掲載しています。
現在の市場シナリオ、最新動向と促進要因、市場環境全体に関する最新分析を提供しています。住宅建設活動の拡大、製品革新によるポートフォリオの拡大と製品のプレミアム化、環境に優しくコスト効率の高い製品などが市場を牽引しています。
| 市場範囲 | |
|---|---|
| 基準年 | 2024年 |
| 終了年 | 2028年 |
| 予測期間 | 2024年~2028年 |
| 成長モメンタム | 加速 |
| 前年比2024年 | 6.23% |
| CAGR | 6.78% |
| 増分額 | 18億600万米ドル |
本調査では、オムニチャネル流通とマルチチャネルマーケティングの採用増加が、今後数年間の蒸発冷却市場成長を牽引する主要因の1つであると分析しています。また、スマートなポータブル蒸発式エアクーラーのイントロダクションやベンダーによる戦略的活動の高まりは、市場の大きな需要につながると思われます。
目次
第1章 エグゼクティブサマリー
- 市場概要
第2章 市場情勢
- 市場エコシステム
- 市場の特徴
- バリューチェーン分析
第3章 市場規模の評価
- 市場の定義
- 市場セグメント分析
- 市場規模 2023年
- 市場の見通し 2023年~2028年
第4章 市場規模実績
- 蒸発冷却の世界市場 2018年~2022年
- タイプセグメント分析 2018年~2022年
- 用途別セグメント分析 2018年~2022年
- 地域別セグメント分析 2018年~2022年
- 国別セグメント分析 2018年~2022年
第5章 ファイブフォース分析
- ファイブフォースの要約
- 買い手の交渉力
- 供給企業の交渉力
- 新規参入業者の脅威
- 代替品の脅威
- 競争の脅威
- 市況
第6章 市場セグメンテーション:タイプ別
- 市場セグメンテーション
- 比較:タイプ別
- 間接蒸発冷却:市場規模と予測 2023年~2028年
- 直接蒸発冷却:市場規模と予測 2023年~2028年
- 2段階蒸発冷却:市場規模と予測 2023年~2028年
- 市場機会:タイプ別
第7章 市場セグメンテーション:用途別
- 市場セグメンテーション
- 比較:用途別
- 産業:市場規模と予測 2023年~2028年
- 閉鎖農業:市場規模と予測 2023年~2028年
- 住宅用:市場規模と予測 2023年~2028年
- その他:市場規模と予測 2023年~2028年
- 市場機会:用途別
第8章 顧客情勢
- 顧客情勢の概要
第9章 地域別情勢
- 地域別セグメンテーション
- 地域別比較
- 北米:市場規模と予測 2023年~2028年
- 欧州:市場規模と予測 2023年~2028年
- アジア太平洋:市場規模と予測 2023年~2028年
- 南米:市場規模と予測 2023年~2028年
- 中東・アフリカ:市場規模と予測 2023年~2028年
- 米国:市場規模と予測 2023年~2028年
- ドイツ:市場規模と予測 2023年~2028年
- 中国:市場規模と予測 2023年~2028年
- インド:市場規模と予測 2023年~2028年
- 英国:市場規模と予測 2023年~2028年
- 市場機会:地域別
第10章 促進要因・課題・機会・抑制要因
- 市場促進要因
- 市場の課題
- 促進要因と課題の影響
- 市場の機会・抑制要因
第11章 競合情勢
- 概要
- 競合情勢
- 混乱の状況
- 業界のリスク
第12章 競合分析
- 企業プロファイル
- 企業の市場ポジショニング
- Amsted Industries Inc.
- ATE Pvt. Ltd.
- CAREL INDUSTRIES S.p.A.
- Celsius Design Ltd.
- Colt Group Ltd.
- Condair Group AG
- Delta Cooling Towers Inc.
- EcoCooling
- ENEXIO Management GmbH
- EVAPCO Inc.
- Honeywell International Inc.
- Munters Group AB
- SPX Technologies Inc.
- Symphony Ltd
- United Metal Products Inc.
第13章 付録
Exhibits:
- Exhibits1: Executive Summary - Chart on Market Overview
- Exhibits2: Executive Summary - Data Table on Market Overview
- Exhibits3: Executive Summary - Chart on Global Market Characteristics
- Exhibits4: Executive Summary - Chart on Market by Geography
- Exhibits5: Executive Summary - Chart on Market Segmentation by Type
- Exhibits6: Executive Summary - Chart on Market Segmentation by Application
- Exhibits7: Executive Summary - Chart on Incremental Growth
- Exhibits8: Executive Summary - Data Table on Incremental Growth
- Exhibits9: Executive Summary - Chart on Company Market Positioning
- Exhibits10: Parent Market
- Exhibits11: Data Table on - Parent Market
- Exhibits12: Market characteristics analysis
- Exhibits13: Value Chain Analysis
- Exhibits14: Offerings of companies included in the market definition
- Exhibits15: Market segments
- Exhibits16: Chart on Global - Market size and forecast 2023-2028 ($ million)
- Exhibits17: Data Table on Global - Market size and forecast 2023-2028 ($ million)
- Exhibits18: Chart on Global Market: Year-over-year growth 2023-2028 (%)
- Exhibits19: Data Table on Global Market: Year-over-year growth 2023-2028 (%)
- Exhibits20: Historic Market Size - Data Table on Global Evaporative Cooling Market 2018 - 2022 ($ million)
- Exhibits21: Historic Market Size - Type Segment 2018 - 2022 ($ million)
- Exhibits22: Historic Market Size - Application Segment 2018 - 2022 ($ million)
- Exhibits23: Historic Market Size - Geography Segment 2018 - 2022 ($ million)
- Exhibits24: Historic Market Size - Country Segment 2018 - 2022 ($ million)
- Exhibits25: Five forces analysis - Comparison between 2023 and 2028
- Exhibits26: Bargaining power of buyers - Impact of key factors 2023 and 2028
- Exhibits27: Bargaining power of suppliers - Impact of key factors in 2023 and 2028
- Exhibits28: Threat of new entrants - Impact of key factors in 2023 and 2028
- Exhibits29: Threat of substitutes - Impact of key factors in 2023 and 2028
- Exhibits30: Threat of rivalry - Impact of key factors in 2023 and 2028
- Exhibits31: Chart on Market condition - Five forces 2023 and 2028
- Exhibits32: Chart on Type - Market share 2023-2028 (%)
- Exhibits33: Data Table on Type - Market share 2023-2028 (%)
- Exhibits34: Chart on Comparison by Type
- Exhibits35: Data Table on Comparison by Type
- Exhibits36: Chart on Indirect evaporative cooling - Market size and forecast 2023-2028 ($ million)
- Exhibits37: Data Table on Indirect evaporative cooling - Market size and forecast 2023-2028 ($ million)
- Exhibits38: Chart on Indirect evaporative cooling - Year-over-year growth 2023-2028 (%)
- Exhibits39: Data Table on Indirect evaporative cooling - Year-over-year growth 2023-2028 (%)
- Exhibits40: Chart on Direct evaporative cooling - Market size and forecast 2023-2028 ($ million)
- Exhibits41: Data Table on Direct evaporative cooling - Market size and forecast 2023-2028 ($ million)
- Exhibits42: Chart on Direct evaporative cooling - Year-over-year growth 2023-2028 (%)
- Exhibits43: Data Table on Direct evaporative cooling - Year-over-year growth 2023-2028 (%)
- Exhibits44: Chart on Two stage evaporative cooling - Market size and forecast 2023-2028 ($ million)
- Exhibits45: Data Table on Two stage evaporative cooling - Market size and forecast 2023-2028 ($ million)
- Exhibits46: Chart on Two stage evaporative cooling - Year-over-year growth 2023-2028 (%)
- Exhibits47: Data Table on Two stage evaporative cooling - Year-over-year growth 2023-2028 (%)
- Exhibits48: Market opportunity by Type ($ million)
- Exhibits49: Data Table on Market opportunity by Type ($ million)
- Exhibits50: Chart on Application - Market share 2023-2028 (%)
- Exhibits51: Data Table on Application - Market share 2023-2028 (%)
- Exhibits52: Chart on Comparison by Application
- Exhibits53: Data Table on Comparison by Application
- Exhibits54: Chart on Industrial - Market size and forecast 2023-2028 ($ million)
- Exhibits55: Data Table on Industrial - Market size and forecast 2023-2028 ($ million)
- Exhibits56: Chart on Industrial - Year-over-year growth 2023-2028 (%)
- Exhibits57: Data Table on Industrial - Year-over-year growth 2023-2028 (%)
- Exhibits58: Chart on Confinement farming - Market size and forecast 2023-2028 ($ million)
- Exhibits59: Data Table on Confinement farming - Market size and forecast 2023-2028 ($ million)
- Exhibits60: Chart on Confinement farming - Year-over-year growth 2023-2028 (%)
- Exhibits61: Data Table on Confinement farming - Year-over-year growth 2023-2028 (%)
- Exhibits62: Chart on Residential - Market size and forecast 2023-2028 ($ million)
- Exhibits63: Data Table on Residential - Market size and forecast 2023-2028 ($ million)
- Exhibits64: Chart on Residential - Year-over-year growth 2023-2028 (%)
- Exhibits65: Data Table on Residential - Year-over-year growth 2023-2028 (%)
- Exhibits66: Chart on Others - Market size and forecast 2023-2028 ($ million)
- Exhibits67: Data Table on Others - Market size and forecast 2023-2028 ($ million)
- Exhibits68: Chart on Others - Year-over-year growth 2023-2028 (%)
- Exhibits69: Data Table on Others - Year-over-year growth 2023-2028 (%)
- Exhibits70: Market opportunity by Application ($ million)
- Exhibits71: Data Table on Market opportunity by Application ($ million)
- Exhibits72: Analysis of price sensitivity, lifecycle, customer purchase basket, adoption rates, and purchase criteria
- Exhibits73: Chart on Market share by geography 2023-2028 (%)
- Exhibits74: Data Table on Market share by geography 2023-2028 (%)
- Exhibits75: Chart on Geographic comparison
- Exhibits76: Data Table on Geographic comparison
- Exhibits77: Chart on North America - Market size and forecast 2023-2028 ($ million)
- Exhibits78: Data Table on North America - Market size and forecast 2023-2028 ($ million)
- Exhibits79: Chart on North America - Year-over-year growth 2023-2028 (%)
- Exhibits80: Data Table on North America - Year-over-year growth 2023-2028 (%)
- Exhibits81: Chart on Europe - Market size and forecast 2023-2028 ($ million)
- Exhibits82: Data Table on Europe - Market size and forecast 2023-2028 ($ million)
- Exhibits83: Chart on Europe - Year-over-year growth 2023-2028 (%)
- Exhibits84: Data Table on Europe - Year-over-year growth 2023-2028 (%)
- Exhibits85: Chart on APAC - Market size and forecast 2023-2028 ($ million)
- Exhibits86: Data Table on APAC - Market size and forecast 2023-2028 ($ million)
- Exhibits87: Chart on APAC - Year-over-year growth 2023-2028 (%)
- Exhibits88: Data Table on APAC - Year-over-year growth 2023-2028 (%)
- Exhibits89: Chart on South America - Market size and forecast 2023-2028 ($ million)
- Exhibits90: Data Table on South America - Market size and forecast 2023-2028 ($ million)
- Exhibits91: Chart on South America - Year-over-year growth 2023-2028 (%)
- Exhibits92: Data Table on South America - Year-over-year growth 2023-2028 (%)
- Exhibits93: Chart on Middle East and Africa - Market size and forecast 2023-2028 ($ million)
- Exhibits94: Data Table on Middle East and Africa - Market size and forecast 2023-2028 ($ million)
- Exhibits95: Chart on Middle East and Africa - Year-over-year growth 2023-2028 (%)
- Exhibits96: Data Table on Middle East and Africa - Year-over-year growth 2023-2028 (%)
- Exhibits97: Chart on US - Market size and forecast 2023-2028 ($ million)
- Exhibits98: Data Table on US - Market size and forecast 2023-2028 ($ million)
- Exhibits99: Chart on US - Year-over-year growth 2023-2028 (%)
- Exhibits100: Data Table on US - Year-over-year growth 2023-2028 (%)
- Exhibits101: Chart on Germany - Market size and forecast 2023-2028 ($ million)
- Exhibits102: Data Table on Germany - Market size and forecast 2023-2028 ($ million)
- Exhibits103: Chart on Germany - Year-over-year growth 2023-2028 (%)
- Exhibits104: Data Table on Germany - Year-over-year growth 2023-2028 (%)
- Exhibits105: Chart on China - Market size and forecast 2023-2028 ($ million)
- Exhibits106: Data Table on China - Market size and forecast 2023-2028 ($ million)
- Exhibits107: Chart on China - Year-over-year growth 2023-2028 (%)
- Exhibits108: Data Table on China - Year-over-year growth 2023-2028 (%)
- Exhibits109: Chart on India - Market size and forecast 2023-2028 ($ million)
- Exhibits110: Data Table on India - Market size and forecast 2023-2028 ($ million)
- Exhibits111: Chart on India - Year-over-year growth 2023-2028 (%)
- Exhibits112: Data Table on India - Year-over-year growth 2023-2028 (%)
- Exhibits113: Chart on UK - Market size and forecast 2023-2028 ($ million)
- Exhibits114: Data Table on UK - Market size and forecast 2023-2028 ($ million)
- Exhibits115: Chart on UK - Year-over-year growth 2023-2028 (%)
- Exhibits116: Data Table on UK - Year-over-year growth 2023-2028 (%)
- Exhibits117: Market opportunity by geography ($ million)
- Exhibits118: Data Tables on Market opportunity by geography ($ million)
- Exhibits119: Impact of drivers and challenges in 2023 and 2028
- Exhibits120: Overview on criticality of inputs and factors of differentiation
- Exhibits121: Overview on factors of disruption
- Exhibits122: Impact of key risks on business
- Exhibits123: Companies covered
- Exhibits124: Matrix on companies position and classification
- Exhibits125: Amsted Industries Inc. - Overview
- Exhibits126: Amsted Industries Inc. - Product / Service
- Exhibits127: Amsted Industries Inc. - Key offerings
- Exhibits128: ATE Pvt. Ltd. - Overview
- Exhibits129: ATE Pvt. Ltd. - Product / Service
- Exhibits130: ATE Pvt. Ltd. - Key offerings
- Exhibits131: CAREL INDUSTRIES S.p.A. - Overview
- Exhibits132: CAREL INDUSTRIES S.p.A. - Business segments
- Exhibits133: CAREL INDUSTRIES S.p.A. - Key offerings
- Exhibits134: CAREL INDUSTRIES S.p.A. - Segment focus
- Exhibits135: Celsius Design Ltd. - Overview
- Exhibits136: Celsius Design Ltd. - Product / Service
- Exhibits137: Celsius Design Ltd. - Key offerings
- Exhibits138: Colt Group Ltd. - Overview
- Exhibits139: Colt Group Ltd. - Product / Service
- Exhibits140: Colt Group Ltd. - Key offerings
- Exhibits141: Condair Group AG - Overview
- Exhibits142: Condair Group AG - Product / Service
- Exhibits143: Condair Group AG - Key offerings
- Exhibits144: Delta Cooling Towers Inc. - Overview
- Exhibits145: Delta Cooling Towers Inc. - Product / Service
- Exhibits146: Delta Cooling Towers Inc. - Key offerings
- Exhibits147: EcoCooling - Overview
- Exhibits148: EcoCooling - Product / Service
- Exhibits149: EcoCooling - Key offerings
- Exhibits150: ENEXIO Management GmbH - Overview
- Exhibits151: ENEXIO Management GmbH - Product / Service
- Exhibits152: ENEXIO Management GmbH - Key offerings
- Exhibits153: EVAPCO Inc. - Overview
- Exhibits154: EVAPCO Inc. - Product / Service
- Exhibits155: EVAPCO Inc. - Key offerings
- Exhibits156: Honeywell International Inc. - Overview
- Exhibits157: Honeywell International Inc. - Business segments
- Exhibits158: Honeywell International Inc. - Key news
- Exhibits159: Honeywell International Inc. - Key offerings
- Exhibits160: Honeywell International Inc. - Segment focus
- Exhibits161: Munters Group AB - Overview
- Exhibits162: Munters Group AB - Product / Service
- Exhibits163: Munters Group AB - Key offerings
- Exhibits164: SPX Technologies Inc. - Overview
- Exhibits165: SPX Technologies Inc. - Business segments
- Exhibits166: SPX Technologies Inc. - Key news
- Exhibits167: SPX Technologies Inc. - Key offerings
- Exhibits168: SPX Technologies Inc. - Segment focus
- Exhibits169: Symphony Ltd - Overview
- Exhibits170: Symphony Ltd - Product / Service
- Exhibits171: Symphony Ltd - Key offerings
- Exhibits172: United Metal Products Inc. - Overview
- Exhibits173: United Metal Products Inc. - Product / Service
- Exhibits174: United Metal Products Inc. - Key offerings
- Exhibits175: Inclusions checklist
- Exhibits176: Exclusions checklist
- Exhibits177: Currency conversion rates for US$
- Exhibits178: Research methodology
- Exhibits179: Information sources
- Exhibits180: Data validation
- Exhibits181: Validation techniques employed for market sizing
- Exhibits182: Data synthesis
- Exhibits183: 360 degree market analysis
- Exhibits184: List of abbreviations
The evaporative cooling market is forecasted to grow by USD 1806 mn during 2023-2028, accelerating at a CAGR of 6.78% during the forecast period. The report on the evaporative cooling market provides a holistic analysis, market size and forecast, trends, growth drivers, and challenges, as well as vendor analysis covering around 25 vendors.
The report offers an up-to-date analysis regarding the current market scenario, the latest trends and drivers, and the overall market environment. The market is driven by growing residential construction activity, product innovation leads to portfolio extension and product premiumization, and environment-friendly and cost-efficient products.
Technavio's evaporative cooling market is segmented as below:
| Market Scope | |
|---|---|
| Base Year | 2024 |
| End Year | 2028 |
| Series Year | 2024-2028 |
| Growth Momentum | Accelerate |
| YOY 2024 | 6.23% |
| CAGR | 6.78% |
| Incremental Value | $1806mn |
By Type
- Indirect evaporative cooling
- Direct evaporative cooling
- Two stage evaporative cooling
By Application
- Industrial
- Confinement farming
- Residential
- Others
By Geography
- North America
- Europe
- APAC
- South America
- Middle East and Africa
This study identifies the increased adoption of omnichannel distribution and multi-channel marketing as one of the prime reasons driving the evaporative cooling market growth during the next few years. Also, introduction of smart portable evaporative air coolers and rising strategic activities by vendors will lead to sizable demand in the market.
The report on the evaporative cooling market covers the following areas:
- Evaporative cooling market sizing
- Evaporative cooling market forecast
- Evaporative cooling market industry analysis
The robust vendor analysis is designed to help clients improve their market position, and in line with this, this report provides a detailed analysis of several leading evaporative cooling market vendors that include Amsted Industries Inc., ATE Pvt. Ltd., CAREL INDUSTRIES S.p.A., Celsius Design Ltd., Colt Group Ltd., Condair Group AG, Delta Cooling Towers Inc., EcoCooling, Energy Wise Solutions, ENEXIO Management GmbH, EVAPCO Inc., Hessaire Products Inc., Honeywell International Inc., Longhua Technology Group Co., Ltd., Munters Group AB, NewAir, Premiair Appliances Ltd., SPX Technologies Inc., Symphony Ltd, and United Metal Products Inc.. Also, the evaporative cooling market analysis report includes information on upcoming trends and challenges that will influence market growth. This is to help companies strategize and leverage all forthcoming growth opportunities.
The study was conducted using an objective combination of primary and secondary information including inputs from key participants in the industry. The report contains a comprehensive market and vendor landscape in addition to an analysis of the key vendors.
The publisher presents a detailed picture of the market by the way of study, synthesis, and summation of data from multiple sources by an analysis of key parameters such as profit, pricing, competition, and promotions. It presents various market facets by identifying the key industry influencers. The data presented is comprehensive, reliable, and a result of extensive research - both primary and secondary. The market research reports provide a complete competitive landscape and an in-depth vendor selection methodology and analysis using qualitative and quantitative research to forecast the accurate market growth.
Table of Contents
1 Executive Summary
- 1.1 Market overview
- Executive Summary - Chart on Market Overview
- Executive Summary - Data Table on Market Overview
- Executive Summary - Chart on Global Market Characteristics
- Executive Summary - Chart on Market by Geography
- Executive Summary - Chart on Market Segmentation by Type
- Executive Summary - Chart on Market Segmentation by Application
- Executive Summary - Chart on Incremental Growth
- Executive Summary - Data Table on Incremental Growth
- Executive Summary - Chart on Company Market Positioning
2 Market Landscape
- 2.1 Market ecosystem
- Parent Market
- Data Table on - Parent Market
- 2.2 Market characteristics
- Market characteristics analysis
- 2.3 Value chain analysis
- Value Chain Analysis
3 Market Sizing
- 3.1 Market definition
- Offerings of companies included in the market definition
- 3.2 Market segment analysis
- Market segments
- 3.3 Market size 2023
- 3.4 Market outlook: Forecast for 2023-2028
- Chart on Global - Market size and forecast 2023-2028 ($ million)
- Data Table on Global - Market size and forecast 2023-2028 ($ million)
- Chart on Global Market: Year-over-year growth 2023-2028 (%)
- Data Table on Global Market: Year-over-year growth 2023-2028 (%)
4 Historic Market Size
- 4.1 Global Evaporative Cooling Market 2018 - 2022
- Historic Market Size - Data Table on Global Evaporative Cooling Market 2018 - 2022 ($ million)
- 4.2 Type segment analysis 2018 - 2022
- Historic Market Size - Type Segment 2018 - 2022 ($ million)
- 4.3 Application segment analysis 2018 - 2022
- Historic Market Size - Application Segment 2018 - 2022 ($ million)
- 4.4 Geography segment analysis 2018 - 2022
- Historic Market Size - Geography Segment 2018 - 2022 ($ million)
- 4.5 Country segment analysis 2018 - 2022
- Historic Market Size - Country Segment 2018 - 2022 ($ million)
5 Five Forces Analysis
- 5.1 Five forces summary
- Five forces analysis - Comparison between 2023 and 2028
- 5.2 Bargaining power of buyers
- Bargaining power of buyers - Impact of key factors 2023 and 2028
- 5.3 Bargaining power of suppliers
- Bargaining power of suppliers - Impact of key factors in 2023 and 2028
- 5.4 Threat of new entrants
- Threat of new entrants - Impact of key factors in 2023 and 2028
- 5.5 Threat of substitutes
- Threat of substitutes - Impact of key factors in 2023 and 2028
- 5.6 Threat of rivalry
- Threat of rivalry - Impact of key factors in 2023 and 2028
- 5.7 Market condition
- Chart on Market condition - Five forces 2023 and 2028
6 Market Segmentation by Type
- 6.1 Market segments
- Chart on Type - Market share 2023-2028 (%)
- Data Table on Type - Market share 2023-2028 (%)
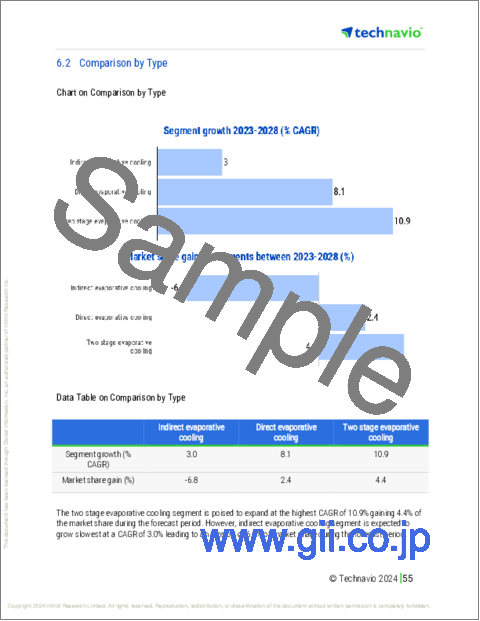
- 6.2 Comparison by Type
- Chart on Comparison by Type
- Data Table on Comparison by Type
- 6.3 Indirect evaporative cooling - Market size and forecast 2023-2028
- Chart on Indirect evaporative cooling - Market size and forecast 2023-2028 ($ million)
- Data Table on Indirect evaporative cooling - Market size and forecast 2023-2028 ($ million)
- Chart on Indirect evaporative cooling - Year-over-year growth 2023-2028 (%)
- Data Table on Indirect evaporative cooling - Year-over-year growth 2023-2028 (%)
- 6.4 Direct evaporative cooling - Market size and forecast 2023-2028
- Chart on Direct evaporative cooling - Market size and forecast 2023-2028 ($ million)
- Data Table on Direct evaporative cooling - Market size and forecast 2023-2028 ($ million)
- Chart on Direct evaporative cooling - Year-over-year growth 2023-2028 (%)
- Data Table on Direct evaporative cooling - Year-over-year growth 2023-2028 (%)
- 6.5 Two stage evaporative cooling - Market size and forecast 2023-2028
- Chart on Two stage evaporative cooling - Market size and forecast 2023-2028 ($ million)
- Data Table on Two stage evaporative cooling - Market size and forecast 2023-2028 ($ million)
- Chart on Two stage evaporative cooling - Year-over-year growth 2023-2028 (%)
- Data Table on Two stage evaporative cooling - Year-over-year growth 2023-2028 (%)
- 6.6 Market opportunity by Type
- Market opportunity by Type ($ million)
- Data Table on Market opportunity by Type ($ million)
7 Market Segmentation by Application
- 7.1 Market segments
- Chart on Application - Market share 2023-2028 (%)
- Data Table on Application - Market share 2023-2028 (%)
- 7.2 Comparison by Application
- Chart on Comparison by Application
- Data Table on Comparison by Application
- 7.3 Industrial - Market size and forecast 2023-2028
- Chart on Industrial - Market size and forecast 2023-2028 ($ million)
- Data Table on Industrial - Market size and forecast 2023-2028 ($ million)
- Chart on Industrial - Year-over-year growth 2023-2028 (%)
- Data Table on Industrial - Year-over-year growth 2023-2028 (%)
- 7.4 Confinement farming - Market size and forecast 2023-2028
- Chart on Confinement farming - Market size and forecast 2023-2028 ($ million)
- Data Table on Confinement farming - Market size and forecast 2023-2028 ($ million)
- Chart on Confinement farming - Year-over-year growth 2023-2028 (%)
- Data Table on Confinement farming - Year-over-year growth 2023-2028 (%)
- 7.5 Residential - Market size and forecast 2023-2028
- Chart on Residential - Market size and forecast 2023-2028 ($ million)
- Data Table on Residential - Market size and forecast 2023-2028 ($ million)
- Chart on Residential - Year-over-year growth 2023-2028 (%)
- Data Table on Residential - Year-over-year growth 2023-2028 (%)
- 7.6 Others - Market size and forecast 2023-2028
- Chart on Others - Market size and forecast 2023-2028 ($ million)
- Data Table on Others - Market size and forecast 2023-2028 ($ million)
- Chart on Others - Year-over-year growth 2023-2028 (%)
- Data Table on Others - Year-over-year growth 2023-2028 (%)
- 7.7 Market opportunity by Application
- Market opportunity by Application ($ million)
- Data Table on Market opportunity by Application ($ million)
8 Customer Landscape
- 8.1 Customer landscape overview
- Analysis of price sensitivity, lifecycle, customer purchase basket, adoption rates, and purchase criteria
9 Geographic Landscape
- 9.1 Geographic segmentation
- Chart on Market share by geography 2023-2028 (%)
- Data Table on Market share by geography 2023-2028 (%)
- 9.2 Geographic comparison
- Chart on Geographic comparison
- Data Table on Geographic comparison
- 9.3 North America - Market size and forecast 2023-2028
- Chart on North America - Market size and forecast 2023-2028 ($ million)
- Data Table on North America - Market size and forecast 2023-2028 ($ million)
- Chart on North America - Year-over-year growth 2023-2028 (%)
- Data Table on North America - Year-over-year growth 2023-2028 (%)
- 9.4 Europe - Market size and forecast 2023-2028
- Chart on Europe - Market size and forecast 2023-2028 ($ million)
- Data Table on Europe - Market size and forecast 2023-2028 ($ million)
- Chart on Europe - Year-over-year growth 2023-2028 (%)
- Data Table on Europe - Year-over-year growth 2023-2028 (%)
- 9.5 APAC - Market size and forecast 2023-2028
- Chart on APAC - Market size and forecast 2023-2028 ($ million)
- Data Table on APAC - Market size and forecast 2023-2028 ($ million)
- Chart on APAC - Year-over-year growth 2023-2028 (%)
- Data Table on APAC - Year-over-year growth 2023-2028 (%)
- 9.6 South America - Market size and forecast 2023-2028
- Chart on South America - Market size and forecast 2023-2028 ($ million)
- Data Table on South America - Market size and forecast 2023-2028 ($ million)
- Chart on South America - Year-over-year growth 2023-2028 (%)
- Data Table on South America - Year-over-year growth 2023-2028 (%)
- 9.7 Middle East and Africa - Market size and forecast 2023-2028
- Chart on Middle East and Africa - Market size and forecast 2023-2028 ($ million)
- Data Table on Middle East and Africa - Market size and forecast 2023-2028 ($ million)
- Chart on Middle East and Africa - Year-over-year growth 2023-2028 (%)
- Data Table on Middle East and Africa - Year-over-year growth 2023-2028 (%)
- 9.8 US - Market size and forecast 2023-2028
- Chart on US - Market size and forecast 2023-2028 ($ million)
- Data Table on US - Market size and forecast 2023-2028 ($ million)
- Chart on US - Year-over-year growth 2023-2028 (%)
- Data Table on US - Year-over-year growth 2023-2028 (%)
- 9.9 Germany - Market size and forecast 2023-2028
- Chart on Germany - Market size and forecast 2023-2028 ($ million)
- Data Table on Germany - Market size and forecast 2023-2028 ($ million)
- Chart on Germany - Year-over-year growth 2023-2028 (%)
- Data Table on Germany - Year-over-year growth 2023-2028 (%)
- 9.10 China - Market size and forecast 2023-2028
- Chart on China - Market size and forecast 2023-2028 ($ million)
- Data Table on China - Market size and forecast 2023-2028 ($ million)
- Chart on China - Year-over-year growth 2023-2028 (%)
- Data Table on China - Year-over-year growth 2023-2028 (%)
- 9.11 India - Market size and forecast 2023-2028
- Chart on India - Market size and forecast 2023-2028 ($ million)
- Data Table on India - Market size and forecast 2023-2028 ($ million)
- Chart on India - Year-over-year growth 2023-2028 (%)
- Data Table on India - Year-over-year growth 2023-2028 (%)
- 9.12 UK - Market size and forecast 2023-2028
- Chart on UK - Market size and forecast 2023-2028 ($ million)
- Data Table on UK - Market size and forecast 2023-2028 ($ million)
- Chart on UK - Year-over-year growth 2023-2028 (%)
- Data Table on UK - Year-over-year growth 2023-2028 (%)
- 9.13 Market opportunity by geography
- Market opportunity by geography ($ million)
- Data Tables on Market opportunity by geography ($ million)
10 Drivers, Challenges, and Opportunity/Restraints
- 10.1 Market drivers
- 10.2 Market challenges
- 10.3 Impact of drivers and challenges
- Impact of drivers and challenges in 2023 and 2028
- 10.4 Market opportunities/restraints
11 Competitive Landscape
- 11.1 Overview
- 11.2 Competitive Landscape
- Overview on criticality of inputs and factors of differentiation
- 11.3 Landscape disruption
- Overview on factors of disruption
- 11.4 Industry risks
- Impact of key risks on business
12 Competitive Analysis
- 12.1 Companies profiled
- Companies covered
- 12.2 Market positioning of companies
- Matrix on companies position and classification
- 12.3 Amsted Industries Inc.
- Amsted Industries Inc. - Overview
- Amsted Industries Inc. - Product / Service
- Amsted Industries Inc. - Key offerings
- 12.4 ATE Pvt. Ltd.
- ATE Pvt. Ltd. - Overview
- ATE Pvt. Ltd. - Product / Service
- ATE Pvt. Ltd. - Key offerings
- 12.5 CAREL INDUSTRIES S.p.A.
- CAREL INDUSTRIES S.p.A. - Overview
- CAREL INDUSTRIES S.p.A. - Business segments
- CAREL INDUSTRIES S.p.A. - Key offerings
- CAREL INDUSTRIES S.p.A. - Segment focus
- 12.6 Celsius Design Ltd.
- Celsius Design Ltd. - Overview
- Celsius Design Ltd. - Product / Service
- Celsius Design Ltd. - Key offerings
- 12.7 Colt Group Ltd.
- Colt Group Ltd. - Overview
- Colt Group Ltd. - Product / Service
- Colt Group Ltd. - Key offerings
- 12.8 Condair Group AG
- Condair Group AG - Overview
- Condair Group AG - Product / Service
- Condair Group AG - Key offerings
- 12.9 Delta Cooling Towers Inc.
- Delta Cooling Towers Inc. - Overview
- Delta Cooling Towers Inc. - Product / Service
- Delta Cooling Towers Inc. - Key offerings
- 12.10 EcoCooling
- EcoCooling - Overview
- EcoCooling - Product / Service
- EcoCooling - Key offerings
- 12.11 ENEXIO Management GmbH
- ENEXIO Management GmbH - Overview
- ENEXIO Management GmbH - Product / Service
- ENEXIO Management GmbH - Key offerings
- 12.12 EVAPCO Inc.
- EVAPCO Inc. - Overview
- EVAPCO Inc. - Product / Service
- EVAPCO Inc. - Key offerings
- 12.13 Honeywell International Inc.
- Honeywell International Inc. - Overview
- Honeywell International Inc. - Business segments
- Honeywell International Inc. - Key news
- Honeywell International Inc. - Key offerings
- Honeywell International Inc. - Segment focus
- 12.14 Munters Group AB
- Munters Group AB - Overview
- Munters Group AB - Product / Service
- Munters Group AB - Key offerings
- 12.15 SPX Technologies Inc.
- SPX Technologies Inc. - Overview
- SPX Technologies Inc. - Business segments
- SPX Technologies Inc. - Key news
- SPX Technologies Inc. - Key offerings
- SPX Technologies Inc. - Segment focus
- 12.16 Symphony Ltd
- Symphony Ltd - Overview
- Symphony Ltd - Product / Service
- Symphony Ltd - Key offerings
- 12.17 United Metal Products Inc.
- United Metal Products Inc. - Overview
- United Metal Products Inc. - Product / Service
- United Metal Products Inc. - Key offerings
13 Appendix
- 13.1 Scope of the report
- 13.2 Inclusions and exclusions checklist
- Inclusions checklist
- Exclusions checklist
- 13.3 Currency conversion rates for US$
- Currency conversion rates for US$
- 13.4 Research methodology
- Research methodology
- 13.5 Data procurement
- Information sources
- 13.6 Data validation
- Data validation
- 13.7 Validation techniques employed for market sizing
- Validation techniques employed for market sizing
- 13.8 Data synthesis
- Data synthesis
- 360 degree market analysis
- 360 degree market analysis
- 13.10 List of abbreviations
- List of abbreviations
