|
|
市場調査レポート
商品コード
1557667
ナイトビジョンシステムの世界市場 2024年~2028年Global Night Vision Systems Market 2024-2028 |
||||||
|
|||||||
カスタマイズ可能
|
|||||||

| ナイトビジョンシステムの世界市場 2024年~2028年 |
|
出版日: 2024年08月02日
発行: TechNavio
ページ情報: 英文 198 Pages
納期: 即納可能
|

全表示
- 概要
- 図表
- 目次
ナイトビジョンシステム市場は2023年~2028年年に25億1,480万米ドル、予測期間中のCAGRは7.08%で成長すると予測されています。
当レポートでは、ナイトビジョンシステム市場の全体的な分析、市場規模・予測、動向、成長促進要因、課題、約25のベンダーを網羅したベンダー分析などを掲載しています。
現在の市場シナリオ、最新動向と促進要因、市場環境全体に関する最新分析を提供しています。市場を牽引しているのは、軍事作戦における用途の増加、火災事故を制御するための赤外線画像技術の採用、自動車用途におけるナイトビジョンシステムの使用増加などです。
| 市場範囲 | |
|---|---|
| 基準年 | 2024年 |
| 終了年 | 2028年 |
| 予測期間 | 2024年~2028年 |
| 成長モメンタム | 加速 |
| 前年比2024年 | 6.49% |
| CAGR | 7.08% |
| 増分額 | 25億1,480万米ドル |
この調査では、センサフュージョン技術の応用が、今後数年間のナイトビジョンシステム市場成長を牽引する主要因の1つであると指摘しています。また、ナイトビジョンデバイスにおけるグラフェンとMEMSの統合の増加、AIと機械学習の統合が市場の大きな需要につながります。
目次
第1章 エグゼクティブサマリー
- 市場概要
第2章 市場情勢
- 市場エコシステム
- 市場の特徴
- バリューチェーン分析
第3章 市場規模の評価
- 市場の定義
- 市場セグメント分析
- 市場規模 2023年
- 市場の見通し 2023年~2028年
第4章 市場規模実績
- ナイトビジョンシステムの世界市場 2018年~2022年
- 技術セグメント分析 2018年~2022年
- 用途別セグメント分析 2018年~2022年
- 製品セグメント分析 2018年~2022年
- 地域別セグメント分析 2018年~2022年
- 国別セグメント分析 2018年~2022年
第5章 ファイブフォース分析
- ファイブフォースの要約
- 買い手の交渉力
- 供給企業の交渉力
- 新規参入業者の脅威
- 代替品の脅威
- 競争の脅威
- 市況
第6章 市場セグメンテーション:技術別
- 市場セグメンテーション
- 比較:技術別
- アクティブ照明:市場規模と予測 2023年~2028年
- 画像の増強:市場規模と予測 2023年~2028年
- 熱画像:市場規模と予測 2023年~2028年
- 市場機会:技術別
第7章 市場セグメンテーション:用途別
- 市場セグメンテーション
- 比較:用途別
- 軍事:市場規模と予測 2023年~2028年
- 自動車:市場規模と予測 2023年~2028年
- セキュリティ:市場規模と予測 2023年~2028年
- その他:市場規模と予測 2023年~2028年
- 市場機会:用途別
第8章 市場セグメンテーション:製品別
- 市場セグメンテーション
- 比較:製品別
- 暗視ゴーグル:市場規模と予測 2023年~2028年
- 暗視カメラ:市場規模と予測 2023年~2028年
- 暗視スコープ:市場規模と予測 2023年~2028年
- その他:市場規模と予測 2023年~2028年
- 市場機会:製品別
第9章 顧客情勢
- 顧客情勢の概要
第10章 地域別情勢
- 地域別セグメンテーション
- 地域別比較
- アジア太平洋:市場規模と予測 2023年~2028年
- 北米:市場規模と予測 2023年~2028年
- 欧州:市場規模と予測 2023年~2028年
- 中東・アフリカ:市場規模と予測 2023年~2028年
- 南米:市場規模と予測 2023年~2028年
- 米国:市場規模と予測 2023年~2028年
- 中国:市場規模と予測 2023年~2028年
- インド:市場規模と予測 2023年~2028年
- ドイツ:市場規模と予測 2023年~2028年
- カナダ:市場規模と予測 2023年~2028年
- 市場機会:地域別
第11章 促進要因・課題・機会・抑制要因
- 市場促進要因
- 市場の課題
- 促進要因と課題の影響
- 市場の機会・抑制要因
第12章 競合情勢
- 概要
- 競合情勢
- 混乱の状況
- 業界のリスク
第13章 競合分析
- 企業プロファイル
- 企業の市場ポジショニング
- Adorama Camera Inc.
- BAE Systems Plc
- Continental AG
- Elbit Systems Ltd.
- L3Harris Technologies Inc.
- Newcon International Ltd.
- Robert Bosch GmbH
- Teledyne Technologies Inc.
- Texas Instruments Inc.
- Thales Group
第14章 付録
Exhibits:
- Exhibits1: Executive Summary - Chart on Market Overview
- Exhibits2: Executive Summary - Data Table on Market Overview
- Exhibits3: Executive Summary - Chart on Global Market Characteristics
- Exhibits4: Executive Summary - Chart on Market by Geography
- Exhibits5: Executive Summary - Chart on Market Segmentation by Technology
- Exhibits6: Executive Summary - Chart on Market Segmentation by Application
- Exhibits7: Executive Summary - Chart on Market Segmentation by Product
- Exhibits8: Executive Summary - Chart on Incremental Growth
- Exhibits9: Executive Summary - Data Table on Incremental Growth
- Exhibits10: Executive Summary - Chart on Company Market Positioning
- Exhibits11: Parent Market
- Exhibits12: Data Table on - Parent Market
- Exhibits13: Market characteristics analysis
- Exhibits14: Value Chain Analysis
- Exhibits15: Offerings of companies included in the market definition
- Exhibits16: Market segments
- Exhibits17: Chart on Global - Market size and forecast 2023-2028 ($ million)
- Exhibits18: Data Table on Global - Market size and forecast 2023-2028 ($ million)
- Exhibits19: Chart on Global Market: Year-over-year growth 2023-2028 (%)
- Exhibits20: Data Table on Global Market: Year-over-year growth 2023-2028 (%)
- Exhibits21: Historic Market Size - Data Table on Global Night Vision Systems Market 2018 - 2022 ($ million)
- Exhibits22: Historic Market Size - Technology Segment 2018 - 2022 ($ million)
- Exhibits23: Historic Market Size - Application Segment 2018 - 2022 ($ million)
- Exhibits24: Historic Market Size - Product Segment 2018 - 2022 ($ million)
- Exhibits25: Historic Market Size - Geography Segment 2018 - 2022 ($ million)
- Exhibits26: Historic Market Size - Country Segment 2018 - 2022 ($ million)
- Exhibits27: Five forces analysis - Comparison between 2023 and 2028
- Exhibits28: Bargaining power of buyers - Impact of key factors 2023 and 2028
- Exhibits29: Bargaining power of suppliers - Impact of key factors in 2023 and 2028
- Exhibits30: Threat of new entrants - Impact of key factors in 2023 and 2028
- Exhibits31: Threat of substitutes - Impact of key factors in 2023 and 2028
- Exhibits32: Threat of rivalry - Impact of key factors in 2023 and 2028
- Exhibits33: Chart on Market condition - Five forces 2023 and 2028
- Exhibits34: Chart on Technology - Market share 2023-2028 (%)
- Exhibits35: Data Table on Technology - Market share 2023-2028 (%)
- Exhibits36: Chart on Comparison by Technology
- Exhibits37: Data Table on Comparison by Technology
- Exhibits38: Chart on Active illumination - Market size and forecast 2023-2028 ($ million)
- Exhibits39: Data Table on Active illumination - Market size and forecast 2023-2028 ($ million)
- Exhibits40: Chart on Active illumination - Year-over-year growth 2023-2028 (%)
- Exhibits41: Data Table on Active illumination - Year-over-year growth 2023-2028 (%)
- Exhibits42: Chart on Image intensification - Market size and forecast 2023-2028 ($ million)
- Exhibits43: Data Table on Image intensification - Market size and forecast 2023-2028 ($ million)
- Exhibits44: Chart on Image intensification - Year-over-year growth 2023-2028 (%)
- Exhibits45: Data Table on Image intensification - Year-over-year growth 2023-2028 (%)
- Exhibits46: Chart on Thermal imaging - Market size and forecast 2023-2028 ($ million)
- Exhibits47: Data Table on Thermal imaging - Market size and forecast 2023-2028 ($ million)
- Exhibits48: Chart on Thermal imaging - Year-over-year growth 2023-2028 (%)
- Exhibits49: Data Table on Thermal imaging - Year-over-year growth 2023-2028 (%)
- Exhibits50: Market opportunity by Technology ($ million)
- Exhibits51: Data Table on Market opportunity by Technology ($ million)
- Exhibits52: Chart on Application - Market share 2023-2028 (%)
- Exhibits53: Data Table on Application - Market share 2023-2028 (%)
- Exhibits54: Chart on Comparison by Application
- Exhibits55: Data Table on Comparison by Application
- Exhibits56: Chart on Military - Market size and forecast 2023-2028 ($ million)
- Exhibits57: Data Table on Military - Market size and forecast 2023-2028 ($ million)
- Exhibits58: Chart on Military - Year-over-year growth 2023-2028 (%)
- Exhibits59: Data Table on Military - Year-over-year growth 2023-2028 (%)
- Exhibits60: Chart on Automotive - Market size and forecast 2023-2028 ($ million)
- Exhibits61: Data Table on Automotive - Market size and forecast 2023-2028 ($ million)
- Exhibits62: Chart on Automotive - Year-over-year growth 2023-2028 (%)
- Exhibits63: Data Table on Automotive - Year-over-year growth 2023-2028 (%)
- Exhibits64: Chart on Security - Market size and forecast 2023-2028 ($ million)
- Exhibits65: Data Table on Security - Market size and forecast 2023-2028 ($ million)
- Exhibits66: Chart on Security - Year-over-year growth 2023-2028 (%)
- Exhibits67: Data Table on Security - Year-over-year growth 2023-2028 (%)
- Exhibits68: Chart on Others - Market size and forecast 2023-2028 ($ million)
- Exhibits69: Data Table on Others - Market size and forecast 2023-2028 ($ million)
- Exhibits70: Chart on Others - Year-over-year growth 2023-2028 (%)
- Exhibits71: Data Table on Others - Year-over-year growth 2023-2028 (%)
- Exhibits72: Market opportunity by Application ($ million)
- Exhibits73: Data Table on Market opportunity by Application ($ million)
- Exhibits74: Chart on Product - Market share 2023-2028 (%)
- Exhibits75: Data Table on Product - Market share 2023-2028 (%)
- Exhibits76: Chart on Comparison by Product
- Exhibits77: Data Table on Comparison by Product
- Exhibits78: Chart on Night vision goggles - Market size and forecast 2023-2028 ($ million)
- Exhibits79: Data Table on Night vision goggles - Market size and forecast 2023-2028 ($ million)
- Exhibits80: Chart on Night vision goggles - Year-over-year growth 2023-2028 (%)
- Exhibits81: Data Table on Night vision goggles - Year-over-year growth 2023-2028 (%)
- Exhibits82: Chart on Night vision cameras - Market size and forecast 2023-2028 ($ million)
- Exhibits83: Data Table on Night vision cameras - Market size and forecast 2023-2028 ($ million)
- Exhibits84: Chart on Night vision cameras - Year-over-year growth 2023-2028 (%)
- Exhibits85: Data Table on Night vision cameras - Year-over-year growth 2023-2028 (%)
- Exhibits86: Chart on Night vision scopes - Market size and forecast 2023-2028 ($ million)
- Exhibits87: Data Table on Night vision scopes - Market size and forecast 2023-2028 ($ million)
- Exhibits88: Chart on Night vision scopes - Year-over-year growth 2023-2028 (%)
- Exhibits89: Data Table on Night vision scopes - Year-over-year growth 2023-2028 (%)
- Exhibits90: Chart on Others - Market size and forecast 2023-2028 ($ million)
- Exhibits91: Data Table on Others - Market size and forecast 2023-2028 ($ million)
- Exhibits92: Chart on Others - Year-over-year growth 2023-2028 (%)
- Exhibits93: Data Table on Others - Year-over-year growth 2023-2028 (%)
- Exhibits94: Market opportunity by Product ($ million)
- Exhibits95: Data Table on Market opportunity by Product ($ million)
- Exhibits96: Analysis of price sensitivity, lifecycle, customer purchase basket, adoption rates, and purchase criteria
- Exhibits97: Chart on Market share by geography 2023-2028 (%)
- Exhibits98: Data Table on Market share by geography 2023-2028 (%)
- Exhibits99: Chart on Geographic comparison
- Exhibits100: Data Table on Geographic comparison
- Exhibits101: Chart on APAC - Market size and forecast 2023-2028 ($ million)
- Exhibits102: Data Table on APAC - Market size and forecast 2023-2028 ($ million)
- Exhibits103: Chart on APAC - Year-over-year growth 2023-2028 (%)
- Exhibits104: Data Table on APAC - Year-over-year growth 2023-2028 (%)
- Exhibits105: Chart on North America - Market size and forecast 2023-2028 ($ million)
- Exhibits106: Data Table on North America - Market size and forecast 2023-2028 ($ million)
- Exhibits107: Chart on North America - Year-over-year growth 2023-2028 (%)
- Exhibits108: Data Table on North America - Year-over-year growth 2023-2028 (%)
- Exhibits109: Chart on Europe - Market size and forecast 2023-2028 ($ million)
- Exhibits110: Data Table on Europe - Market size and forecast 2023-2028 ($ million)
- Exhibits111: Chart on Europe - Year-over-year growth 2023-2028 (%)
- Exhibits112: Data Table on Europe - Year-over-year growth 2023-2028 (%)
- Exhibits113: Chart on Middle East and Africa - Market size and forecast 2023-2028 ($ million)
- Exhibits114: Data Table on Middle East and Africa - Market size and forecast 2023-2028 ($ million)
- Exhibits115: Chart on Middle East and Africa - Year-over-year growth 2023-2028 (%)
- Exhibits116: Data Table on Middle East and Africa - Year-over-year growth 2023-2028 (%)
- Exhibits117: Chart on South America - Market size and forecast 2023-2028 ($ million)
- Exhibits118: Data Table on South America - Market size and forecast 2023-2028 ($ million)
- Exhibits119: Chart on South America - Year-over-year growth 2023-2028 (%)
- Exhibits120: Data Table on South America - Year-over-year growth 2023-2028 (%)
- Exhibits121: Chart on US - Market size and forecast 2023-2028 ($ million)
- Exhibits122: Data Table on US - Market size and forecast 2023-2028 ($ million)
- Exhibits123: Chart on US - Year-over-year growth 2023-2028 (%)
- Exhibits124: Data Table on US - Year-over-year growth 2023-2028 (%)
- Exhibits125: Chart on China - Market size and forecast 2023-2028 ($ million)
- Exhibits126: Data Table on China - Market size and forecast 2023-2028 ($ million)
- Exhibits127: Chart on China - Year-over-year growth 2023-2028 (%)
- Exhibits128: Data Table on China - Year-over-year growth 2023-2028 (%)
- Exhibits129: Chart on India - Market size and forecast 2023-2028 ($ million)
- Exhibits130: Data Table on India - Market size and forecast 2023-2028 ($ million)
- Exhibits131: Chart on India - Year-over-year growth 2023-2028 (%)
- Exhibits132: Data Table on India - Year-over-year growth 2023-2028 (%)
- Exhibits133: Chart on Germany - Market size and forecast 2023-2028 ($ million)
- Exhibits134: Data Table on Germany - Market size and forecast 2023-2028 ($ million)
- Exhibits135: Chart on Germany - Year-over-year growth 2023-2028 (%)
- Exhibits136: Data Table on Germany - Year-over-year growth 2023-2028 (%)
- Exhibits137: Chart on Canada - Market size and forecast 2023-2028 ($ million)
- Exhibits138: Data Table on Canada - Market size and forecast 2023-2028 ($ million)
- Exhibits139: Chart on Canada - Year-over-year growth 2023-2028 (%)
- Exhibits140: Data Table on Canada - Year-over-year growth 2023-2028 (%)
- Exhibits141: Market opportunity by geography ($ million)
- Exhibits142: Data Tables on Market opportunity by geography ($ million)
- Exhibits143: Impact of drivers and challenges in 2023 and 2028
- Exhibits144: Overview on criticality of inputs and factors of differentiation
- Exhibits145: Overview on factors of disruption
- Exhibits146: Impact of key risks on business
- Exhibits147: Companies covered
- Exhibits148: Matrix on companies position and classification
- Exhibits149: Adorama Camera Inc. - Overview
- Exhibits150: Adorama Camera Inc. - Product / Service
- Exhibits151: Adorama Camera Inc. - Key offerings
- Exhibits152: BAE Systems Plc - Overview
- Exhibits153: BAE Systems Plc - Business segments
- Exhibits154: BAE Systems Plc - Key news
- Exhibits155: BAE Systems Plc - Key offerings
- Exhibits156: BAE Systems Plc - Segment focus
- Exhibits157: Continental AG - Overview
- Exhibits158: Continental AG - Business segments
- Exhibits159: Continental AG - Key news
- Exhibits160: Continental AG - Key offerings
- Exhibits161: Continental AG - Segment focus
- Exhibits162: Elbit Systems Ltd. - Overview
- Exhibits163: Elbit Systems Ltd. - Product / Service
- Exhibits164: Elbit Systems Ltd. - Key news
- Exhibits165: Elbit Systems Ltd. - Key offerings
- Exhibits166: L3Harris Technologies Inc. - Overview
- Exhibits167: L3Harris Technologies Inc. - Business segments
- Exhibits168: L3Harris Technologies Inc. - Key news
- Exhibits169: L3Harris Technologies Inc. - Key offerings
- Exhibits170: L3Harris Technologies Inc. - Segment focus
- Exhibits171: Newcon International Ltd. - Overview
- Exhibits172: Newcon International Ltd. - Product / Service
- Exhibits173: Newcon International Ltd. - Key offerings
- Exhibits174: Robert Bosch GmbH - Overview
- Exhibits175: Robert Bosch GmbH - Product / Service
- Exhibits176: Robert Bosch GmbH - Key news
- Exhibits177: Robert Bosch GmbH - Key offerings
- Exhibits178: Teledyne Technologies Inc. - Overview
- Exhibits179: Teledyne Technologies Inc. - Business segments
- Exhibits180: Teledyne Technologies Inc. - Key news
- Exhibits181: Teledyne Technologies Inc. - Key offerings
- Exhibits182: Teledyne Technologies Inc. - Segment focus
- Exhibits183: Texas Instruments Inc. - Overview
- Exhibits184: Texas Instruments Inc. - Business segments
- Exhibits185: Texas Instruments Inc. - Key news
- Exhibits186: Texas Instruments Inc. - Key offerings
- Exhibits187: Texas Instruments Inc. - Segment focus
- Exhibits188: Thales Group - Overview
- Exhibits189: Thales Group - Business segments
- Exhibits190: Thales Group - Key news
- Exhibits191: Thales Group - Key offerings
- Exhibits192: Thales Group - Segment focus
- Exhibits193: Inclusions checklist
- Exhibits194: Exclusions checklist
- Exhibits195: Currency conversion rates for US$
- Exhibits196: Research methodology
- Exhibits197: Information sources
- Exhibits198: Data validation
- Exhibits199: Validation techniques employed for market sizing
- Exhibits200: Data synthesis
- Exhibits201: 360 degree market analysis
- Exhibits202: List of abbreviations
The night vision systems market is forecasted to grow by USD 2514.8 mn during 2023-2028, accelerating at a CAGR of 7.08% during the forecast period. The report on the night vision systems market provides a holistic analysis, market size and forecast, trends, growth drivers, and challenges, as well as vendor analysis covering around 25 vendors.
The report offers an up-to-date analysis regarding the current market scenario, the latest trends and drivers, and the overall market environment. The market is driven by increased applications in military operations, adoption of thermal imaging technology for controlling fire accidents, and increasing use of night vision systems in automotive applications.
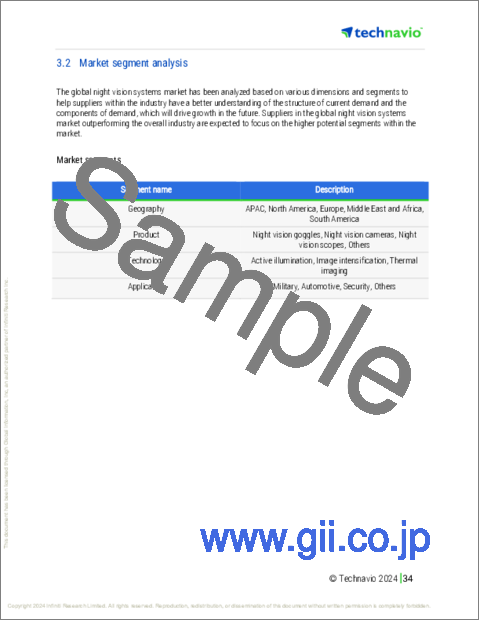
Technavio's night vision systems market is segmented as below:
| Market Scope | |
|---|---|
| Base Year | 2024 |
| End Year | 2028 |
| Series Year | 2024-2028 |
| Growth Momentum | Accelerate |
| YOY 2024 | 6.49% |
| CAGR | 7.08% |
| Incremental Value | $2514.8mn |
By Technology
- Active illumination
- Image intensification
- Thermal imaging
By Application
- Military
- Automotive
- Security
- Others
By Product
- Night vision goggles
- Night vision cameras
- Night vision scopes
- Others
By Geography
- APAC
- North America
- Europe
- Middle East and Africa
- South America
This study identifies the application of sensor fusion technology as one of the prime reasons driving the night vision systems market growth during the next few years. Also, increasing integration of graphene with mems in night vision devices and integration of ai and machine learning will lead to sizable demand in the market.
The report on the night vision systems market covers the following areas:
- Night vision systems market sizing
- Night vision systems market forecast
- Night vision systems market industry analysis
The robust vendor analysis is designed to help clients improve their market position, and in line with this, this report provides a detailed analysis of several leading night vision systems market vendors that include Adorama Camera Inc., American Technologies Network Corp., Autoliv Inc., BAE Systems Plc, BorgWarner Inc., Continental AG, DENSO Corp., Elbit Systems Ltd., L3Harris Technologies Inc., Magna International Inc., Meopta Optica S.R.O, Mobileye Technologies Ltd., Newcon International Ltd., OPTIX JSC, Robert Bosch GmbH, Teledyne Technologies Inc., Texas Instruments Inc., Thales Group, Valeo SA, and Veoneer Inc.. Also, the night vision systems market analysis report includes information on upcoming trends and challenges that will influence market growth. This is to help companies strategize and leverage all forthcoming growth opportunities.
The study was conducted using an objective combination of primary and secondary information including inputs from key participants in the industry. The report contains a comprehensive market and vendor landscape in addition to an analysis of the key vendors.
The publisher presents a detailed picture of the market by the way of study, synthesis, and summation of data from multiple sources by an analysis of key parameters such as profit, pricing, competition, and promotions. It presents various market facets by identifying the key industry influencers. The data presented is comprehensive, reliable, and a result of extensive research - both primary and secondary. The market research reports provide a complete competitive landscape and an in-depth vendor selection methodology and analysis using qualitative and quantitative research to forecast the accurate market growth.
Table of Contents
1 Executive Summary
- 1.1 Market overview
- Executive Summary - Chart on Market Overview
- Executive Summary - Data Table on Market Overview
- Executive Summary - Chart on Global Market Characteristics
- Executive Summary - Chart on Market by Geography
- Executive Summary - Chart on Market Segmentation by Technology
- Executive Summary - Chart on Market Segmentation by Application
- Executive Summary - Chart on Market Segmentation by Product
- Executive Summary - Chart on Incremental Growth
- Executive Summary - Data Table on Incremental Growth
- Executive Summary - Chart on Company Market Positioning
2 Market Landscape
- 2.1 Market ecosystem
- Parent Market
- Data Table on - Parent Market
- 2.2 Market characteristics
- Market characteristics analysis
- 2.3 Value chain analysis
- Value Chain Analysis
3 Market Sizing
- 3.1 Market definition
- Offerings of companies included in the market definition
- 3.2 Market segment analysis
- Market segments
- 3.3 Market size 2023
- 3.4 Market outlook: Forecast for 2023-2028
- Chart on Global - Market size and forecast 2023-2028 ($ million)
- Data Table on Global - Market size and forecast 2023-2028 ($ million)
- Chart on Global Market: Year-over-year growth 2023-2028 (%)
- Data Table on Global Market: Year-over-year growth 2023-2028 (%)
4 Historic Market Size
- 4.1 Global Night Vision Systems Market 2018 - 2022
- Historic Market Size - Data Table on Global Night Vision Systems Market 2018 - 2022 ($ million)
- 4.2 Technology segment analysis 2018 - 2022
- Historic Market Size - Technology Segment 2018 - 2022 ($ million)
- 4.3 Application segment analysis 2018 - 2022
- Historic Market Size - Application Segment 2018 - 2022 ($ million)
- 4.4 Product segment analysis 2018 - 2022
- Historic Market Size - Product Segment 2018 - 2022 ($ million)
- 4.5 Geography segment analysis 2018 - 2022
- Historic Market Size - Geography Segment 2018 - 2022 ($ million)
- 4.6 Country segment analysis 2018 - 2022
- Historic Market Size - Country Segment 2018 - 2022 ($ million)
5 Five Forces Analysis
- 5.1 Five forces summary
- Five forces analysis - Comparison between 2023 and 2028
- 5.2 Bargaining power of buyers
- Bargaining power of buyers - Impact of key factors 2023 and 2028
- 5.3 Bargaining power of suppliers
- Bargaining power of suppliers - Impact of key factors in 2023 and 2028
- 5.4 Threat of new entrants
- Threat of new entrants - Impact of key factors in 2023 and 2028
- 5.5 Threat of substitutes
- Threat of substitutes - Impact of key factors in 2023 and 2028
- 5.6 Threat of rivalry
- Threat of rivalry - Impact of key factors in 2023 and 2028
- 5.7 Market condition
- Chart on Market condition - Five forces 2023 and 2028
6 Market Segmentation by Technology
- 6.1 Market segments
- Chart on Technology - Market share 2023-2028 (%)
- Data Table on Technology - Market share 2023-2028 (%)
- 6.2 Comparison by Technology
- Chart on Comparison by Technology
- Data Table on Comparison by Technology
- 6.3 Active illumination - Market size and forecast 2023-2028
- Chart on Active illumination - Market size and forecast 2023-2028 ($ million)
- Data Table on Active illumination - Market size and forecast 2023-2028 ($ million)
- Chart on Active illumination - Year-over-year growth 2023-2028 (%)
- Data Table on Active illumination - Year-over-year growth 2023-2028 (%)
- 6.4 Image intensification - Market size and forecast 2023-2028
- Chart on Image intensification - Market size and forecast 2023-2028 ($ million)
- Data Table on Image intensification - Market size and forecast 2023-2028 ($ million)
- Chart on Image intensification - Year-over-year growth 2023-2028 (%)
- Data Table on Image intensification - Year-over-year growth 2023-2028 (%)
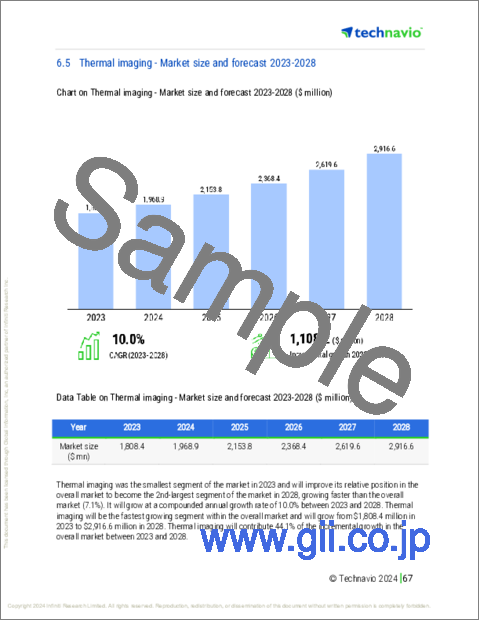
- 6.5 Thermal imaging - Market size and forecast 2023-2028
- Chart on Thermal imaging - Market size and forecast 2023-2028 ($ million)
- Data Table on Thermal imaging - Market size and forecast 2023-2028 ($ million)
- Chart on Thermal imaging - Year-over-year growth 2023-2028 (%)
- Data Table on Thermal imaging - Year-over-year growth 2023-2028 (%)
- 6.6 Market opportunity by Technology
- Market opportunity by Technology ($ million)
- Data Table on Market opportunity by Technology ($ million)
7 Market Segmentation by Application
- 7.1 Market segments
- Chart on Application - Market share 2023-2028 (%)
- Data Table on Application - Market share 2023-2028 (%)
- 7.2 Comparison by Application
- Chart on Comparison by Application
- Data Table on Comparison by Application
- 7.3 Military - Market size and forecast 2023-2028
- Chart on Military - Market size and forecast 2023-2028 ($ million)
- Data Table on Military - Market size and forecast 2023-2028 ($ million)
- Chart on Military - Year-over-year growth 2023-2028 (%)
- Data Table on Military - Year-over-year growth 2023-2028 (%)
- 7.4 Automotive - Market size and forecast 2023-2028
- Chart on Automotive - Market size and forecast 2023-2028 ($ million)
- Data Table on Automotive - Market size and forecast 2023-2028 ($ million)
- Chart on Automotive - Year-over-year growth 2023-2028 (%)
- Data Table on Automotive - Year-over-year growth 2023-2028 (%)
- 7.5 Security - Market size and forecast 2023-2028
- Chart on Security - Market size and forecast 2023-2028 ($ million)
- Data Table on Security - Market size and forecast 2023-2028 ($ million)
- Chart on Security - Year-over-year growth 2023-2028 (%)
- Data Table on Security - Year-over-year growth 2023-2028 (%)
- 7.6 Others - Market size and forecast 2023-2028
- Chart on Others - Market size and forecast 2023-2028 ($ million)
- Data Table on Others - Market size and forecast 2023-2028 ($ million)
- Chart on Others - Year-over-year growth 2023-2028 (%)
- Data Table on Others - Year-over-year growth 2023-2028 (%)
- 7.7 Market opportunity by Application
- Market opportunity by Application ($ million)
- Data Table on Market opportunity by Application ($ million)
8 Market Segmentation by Product
- 8.1 Market segments
- Chart on Product - Market share 2023-2028 (%)
- Data Table on Product - Market share 2023-2028 (%)
- 8.2 Comparison by Product
- Chart on Comparison by Product
- Data Table on Comparison by Product
- 8.3 Night vision goggles - Market size and forecast 2023-2028
- Chart on Night vision goggles - Market size and forecast 2023-2028 ($ million)
- Data Table on Night vision goggles - Market size and forecast 2023-2028 ($ million)
- Chart on Night vision goggles - Year-over-year growth 2023-2028 (%)
- Data Table on Night vision goggles - Year-over-year growth 2023-2028 (%)
- 8.4 Night vision cameras - Market size and forecast 2023-2028
- Chart on Night vision cameras - Market size and forecast 2023-2028 ($ million)
- Data Table on Night vision cameras - Market size and forecast 2023-2028 ($ million)
- Chart on Night vision cameras - Year-over-year growth 2023-2028 (%)
- Data Table on Night vision cameras - Year-over-year growth 2023-2028 (%)
- 8.5 Night vision scopes - Market size and forecast 2023-2028
- Chart on Night vision scopes - Market size and forecast 2023-2028 ($ million)
- Data Table on Night vision scopes - Market size and forecast 2023-2028 ($ million)
- Chart on Night vision scopes - Year-over-year growth 2023-2028 (%)
- Data Table on Night vision scopes - Year-over-year growth 2023-2028 (%)
- 8.6 Others - Market size and forecast 2023-2028
- Chart on Others - Market size and forecast 2023-2028 ($ million)
- Data Table on Others - Market size and forecast 2023-2028 ($ million)
- Chart on Others - Year-over-year growth 2023-2028 (%)
- Data Table on Others - Year-over-year growth 2023-2028 (%)
- 8.7 Market opportunity by Product
- Market opportunity by Product ($ million)
- Data Table on Market opportunity by Product ($ million)
9 Customer Landscape
- 9.1 Customer landscape overview
- Analysis of price sensitivity, lifecycle, customer purchase basket, adoption rates, and purchase criteria
10 Geographic Landscape
- 10.1 Geographic segmentation
- Chart on Market share by geography 2023-2028 (%)
- Data Table on Market share by geography 2023-2028 (%)
- 10.2 Geographic comparison
- Chart on Geographic comparison
- Data Table on Geographic comparison
- 10.3 APAC - Market size and forecast 2023-2028
- Chart on APAC - Market size and forecast 2023-2028 ($ million)
- Data Table on APAC - Market size and forecast 2023-2028 ($ million)
- Chart on APAC - Year-over-year growth 2023-2028 (%)
- Data Table on APAC - Year-over-year growth 2023-2028 (%)
- 10.4 North America - Market size and forecast 2023-2028
- Chart on North America - Market size and forecast 2023-2028 ($ million)
- Data Table on North America - Market size and forecast 2023-2028 ($ million)
- Chart on North America - Year-over-year growth 2023-2028 (%)
- Data Table on North America - Year-over-year growth 2023-2028 (%)
- 10.5 Europe - Market size and forecast 2023-2028
- Chart on Europe - Market size and forecast 2023-2028 ($ million)
- Data Table on Europe - Market size and forecast 2023-2028 ($ million)
- Chart on Europe - Year-over-year growth 2023-2028 (%)
- Data Table on Europe - Year-over-year growth 2023-2028 (%)
- 10.6 Middle East and Africa - Market size and forecast 2023-2028
- Chart on Middle East and Africa - Market size and forecast 2023-2028 ($ million)
- Data Table on Middle East and Africa - Market size and forecast 2023-2028 ($ million)
- Chart on Middle East and Africa - Year-over-year growth 2023-2028 (%)
- Data Table on Middle East and Africa - Year-over-year growth 2023-2028 (%)
- 10.7 South America - Market size and forecast 2023-2028
- Chart on South America - Market size and forecast 2023-2028 ($ million)
- Data Table on South America - Market size and forecast 2023-2028 ($ million)
- Chart on South America - Year-over-year growth 2023-2028 (%)
- Data Table on South America - Year-over-year growth 2023-2028 (%)
- 10.8 US - Market size and forecast 2023-2028
- Chart on US - Market size and forecast 2023-2028 ($ million)
- Data Table on US - Market size and forecast 2023-2028 ($ million)
- Chart on US - Year-over-year growth 2023-2028 (%)
- Data Table on US - Year-over-year growth 2023-2028 (%)
- 10.9 China - Market size and forecast 2023-2028
- Chart on China - Market size and forecast 2023-2028 ($ million)
- Data Table on China - Market size and forecast 2023-2028 ($ million)
- Chart on China - Year-over-year growth 2023-2028 (%)
- Data Table on China - Year-over-year growth 2023-2028 (%)
- 10.10 India - Market size and forecast 2023-2028
- Chart on India - Market size and forecast 2023-2028 ($ million)
- Data Table on India - Market size and forecast 2023-2028 ($ million)
- Chart on India - Year-over-year growth 2023-2028 (%)
- Data Table on India - Year-over-year growth 2023-2028 (%)
- 10.11 Germany - Market size and forecast 2023-2028
- Chart on Germany - Market size and forecast 2023-2028 ($ million)
- Data Table on Germany - Market size and forecast 2023-2028 ($ million)
- Chart on Germany - Year-over-year growth 2023-2028 (%)
- Data Table on Germany - Year-over-year growth 2023-2028 (%)
- 10.12 Canada - Market size and forecast 2023-2028
- Chart on Canada - Market size and forecast 2023-2028 ($ million)
- Data Table on Canada - Market size and forecast 2023-2028 ($ million)
- Chart on Canada - Year-over-year growth 2023-2028 (%)
- Data Table on Canada - Year-over-year growth 2023-2028 (%)
- 10.13 Market opportunity by geography
- Market opportunity by geography ($ million)
- Data Tables on Market opportunity by geography ($ million)
11 Drivers, Challenges, and Opportunity/Restraints
- 11.1 Market drivers
- 11.2 Market challenges
- 11.3 Impact of drivers and challenges
- Impact of drivers and challenges in 2023 and 2028
- 11.4 Market opportunities/restraints
12 Competitive Landscape
- 12.1 Overview
- 12.2 Competitive Landscape
- Overview on criticality of inputs and factors of differentiation
- 12.3 Landscape disruption
- Overview on factors of disruption
- 12.4 Industry risks
- Impact of key risks on business
13 Competitive Analysis
- 13.1 Companies profiled
- Companies covered
- 13.2 Market positioning of companies
- Matrix on companies position and classification
- 13.3 Adorama Camera Inc.
- Adorama Camera Inc. - Overview
- Adorama Camera Inc. - Product / Service
- Adorama Camera Inc. - Key offerings
- 13.4 BAE Systems Plc
- BAE Systems Plc - Overview
- BAE Systems Plc - Business segments
- BAE Systems Plc - Key news
- BAE Systems Plc - Key offerings
- BAE Systems Plc - Segment focus
- 13.5 Continental AG
- Continental AG - Overview
- Continental AG - Business segments
- Continental AG - Key news
- Continental AG - Key offerings
- Continental AG - Segment focus
- 13.6 Elbit Systems Ltd.
- Elbit Systems Ltd. - Overview
- Elbit Systems Ltd. - Product / Service
- Elbit Systems Ltd. - Key news
- Elbit Systems Ltd. - Key offerings
- 13.7 L3Harris Technologies Inc.
- L3Harris Technologies Inc. - Overview
- L3Harris Technologies Inc. - Business segments
- L3Harris Technologies Inc. - Key news
- L3Harris Technologies Inc. - Key offerings
- L3Harris Technologies Inc. - Segment focus
- 13.8 Newcon International Ltd.
- Newcon International Ltd. - Overview
- Newcon International Ltd. - Product / Service
- Newcon International Ltd. - Key offerings
- 13.9 Robert Bosch GmbH
- Robert Bosch GmbH - Overview
- Robert Bosch GmbH - Product / Service
- Robert Bosch GmbH - Key news
- Robert Bosch GmbH - Key offerings
- 13.10 Teledyne Technologies Inc.
- Teledyne Technologies Inc. - Overview
- Teledyne Technologies Inc. - Business segments
- Teledyne Technologies Inc. - Key news
- Teledyne Technologies Inc. - Key offerings
- Teledyne Technologies Inc. - Segment focus
- 13.11 Texas Instruments Inc.
- Texas Instruments Inc. - Overview
- Texas Instruments Inc. - Business segments
- Texas Instruments Inc. - Key news
- Texas Instruments Inc. - Key offerings
- Texas Instruments Inc. - Segment focus
- 13.12 Thales Group
- Thales Group - Overview
- Thales Group - Business segments
- Thales Group - Key news
- Thales Group - Key offerings
- Thales Group - Segment focus
14 Appendix
- 14.1 Scope of the report
- 14.2 Inclusions and exclusions checklist
- Inclusions checklist
- Exclusions checklist
- 14.3 Currency conversion rates for US$
- Currency conversion rates for US$
- 14.4 Research methodology
- Research methodology
- 14.5 Data procurement
- Information sources
- 14.6 Data validation
- Data validation
- 14.7 Validation techniques employed for market sizing
- Validation techniques employed for market sizing
- 14.8 Data synthesis
- Data synthesis
- 14.9 360 degree market analysis
- 360 degree market analysis
- 14.10 List of abbreviations
- List of abbreviations
