|
|
市場調査レポート
商品コード
1557662
ガラス基板の世界市場 2024-2028Global Glass Substrate Market 2024-2028 |
||||||

|
|||||||
カスタマイズ可能
|
|||||||

| ガラス基板の世界市場 2024-2028 |
|
出版日: 2024年08月01日
発行: TechNavio
ページ情報: 英文 146 Pages
納期: 即納可能
|

全表示
- 概要
- 図表
- 目次
ガラス基板市場は2023-2028年に4億8,970万米ドル、予測期間中のCAGRは4.83%で成長すると予測されます。
当レポートでは、ガラス基板市場の全体的な分析、市場規模・予測、動向、成長促進要因、課題、約25のベンダーを網羅したベンダー分析などを掲載しています。
現在の市場シナリオ、最新動向と促進要因、市場環境全体に関する最新分析を提供しています。市場を牽引しているのは、自動車へのガラス繊維複合材料の採用拡大、航空宇宙・防衛用途でのガラス基板の使用増加、家電需要の急増などです。
| 市場範囲 | |
|---|---|
| 基準年 | 2024 |
| 終了年 | 2028 |
| 予測期間 | 2024-2028 |
| 成長モメンタム | 加速 |
| 前年比2024年 | 4.37% |
| CAGR | 4.83% |
| 増分額 | 4億8,970万米ドル |
本調査では、今後数年間のガラス基板市場成長を牽引する主要因の1つとして、太陽光発電プラントにおけるガラス基板の採用を挙げています。また、ベンダーが製品イノベーションに注力するようになり、ベンダー間の合併・買収が増加していることも、市場の大きな需要につながります。
目次
第1章 エグゼクティブサマリー
- 市場概要
第2章 市場情勢
- 市場エコシステム
- 市場の特徴
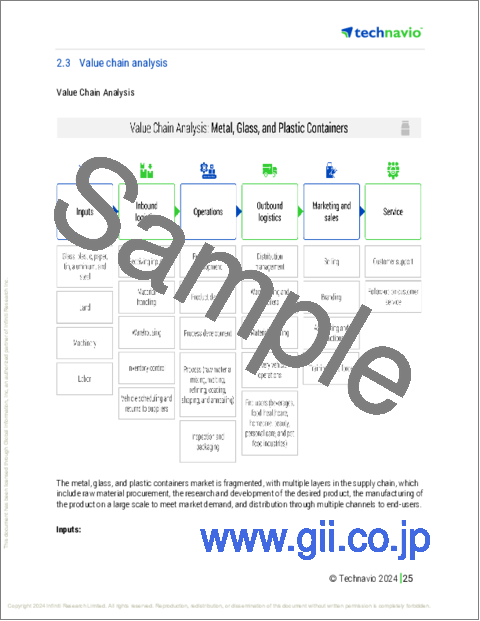
- バリューチェーン分析
第3章 市場規模の評価
- 市場の定義
- 市場セグメント分析
- 市場規模 2023
- 市場の見通し 2023-2028
第4章 市場規模実績
- ガラス基板の世界市場 2018-2022
- エンドユーザー別セグメント分析 2018-2022
- 地域別セグメント分析 2018-2022
- 国別セグメント分析 2018-2022
第5章 ファイブフォース分析
- ファイブフォースの要約
- 買い手の交渉力
- 供給企業の交渉力
- 新規参入業者の脅威
- 代替品の脅威
- 競争の脅威
- 市況
第6章 市場セグメンテーション:エンドユーザー別
- 市場セグメンテーション
- 比較:エンドユーザー別
- エレクトロニクス:市場規模と予測 2023-2028
- 自動車:市場規模と予測 2023-2028
- 医療:市場規模と予測 2023-2028
- 太陽光:市場規模と予測 2023-2028
- 航空宇宙・防衛:市場規模と予測 2023-2028
- 市場機会:エンドユーザー別
第7章 顧客情勢
- 顧客情勢の概要
第8章 地域別情勢
- 地域別セグメンテーション
- 地域別比較
- アジア太平洋:市場規模と予測 2023-2028
- 北米:市場規模と予測 2023-2028
- 欧州:市場規模と予測 2023-2028
- 南米:市場規模と予測 2023-2028
- 中東・アフリカ:市場規模と予測 2023-2028
- 米国:市場規模と予測 2023-2028
- 中国:市場規模と予測 2023-2028
- 日本:市場規模と予測 2023-2028
- ドイツ:市場規模と予測 2023-2028
- 英国:市場規模と予測 2023-2028
- 市場機会:地域別
第9章 促進要因・課題・機会・抑制要因
- 市場促進要因
- 市場の課題
- 促進要因と課題の影響
- 市場の機会・抑制要因
第10章 競合情勢
- 概要
- 競合情勢
- 混乱の状況
- 業界のリスク
第11章 競合分析
- 企業プロファイル
- 企業の市場ポジショニング
- AGC Inc.
- Corning Inc.
- HOYA CORP.
- Nippon Sheet Glass Co. Ltd.
- Ohara Inc.
- Otto Chemie Pvt. Ltd.
- Plan Optik AG
- SCHOTT AG
- Shin Etsu Chemical Co. Ltd.
- Vedanta Ltd.
第12章 付録
Exhibits:
- Exhibits1: Executive Summary - Chart on Market Overview
- Exhibits2: Executive Summary - Data Table on Market Overview
- Exhibits3: Executive Summary - Chart on Global Market Characteristics
- Exhibits4: Executive Summary - Chart on Market by Geography
- Exhibits5: Executive Summary - Chart on Market Segmentation by End-user
- Exhibits6: Executive Summary - Chart on Incremental Growth
- Exhibits7: Executive Summary - Data Table on Incremental Growth
- Exhibits8: Executive Summary - Chart on Company Market Positioning
- Exhibits9: Parent Market
- Exhibits10: Data Table on - Parent Market
- Exhibits11: Market characteristics analysis
- Exhibits12: Value Chain Analysis
- Exhibits13: Offerings of companies included in the market definition
- Exhibits14: Market segments
- Exhibits15: Chart on Global - Market size and forecast 2023-2028 ($ million)
- Exhibits16: Data Table on Global - Market size and forecast 2023-2028 ($ million)
- Exhibits17: Chart on Global Market: Year-over-year growth 2023-2028 (%)
- Exhibits18: Data Table on Global Market: Year-over-year growth 2023-2028 (%)
- Exhibits19: Historic Market Size - Data Table on Global Glass Substrate Market 2018 - 2022 ($ million)
- Exhibits20: Historic Market Size - End-user Segment 2018 - 2022 ($ million)
- Exhibits21: Historic Market Size - Geography Segment 2018 - 2022 ($ million)
- Exhibits22: Historic Market Size - Country Segment 2018 - 2022 ($ million)
- Exhibits23: Five forces analysis - Comparison between 2023 and 2028
- Exhibits24: Bargaining power of buyers - Impact of key factors 2023 and 2028
- Exhibits25: Bargaining power of suppliers - Impact of key factors in 2023 and 2028
- Exhibits26: Threat of new entrants - Impact of key factors in 2023 and 2028
- Exhibits27: Threat of substitutes - Impact of key factors in 2023 and 2028
- Exhibits28: Threat of rivalry - Impact of key factors in 2023 and 2028
- Exhibits29: Chart on Market condition - Five forces 2023 and 2028
- Exhibits30: Chart on End-user - Market share 2023-2028 (%)
- Exhibits31: Data Table on End-user - Market share 2023-2028 (%)
- Exhibits32: Chart on Comparison by End-user
- Exhibits33: Data Table on Comparison by End-user
- Exhibits34: Chart on Electronics - Market size and forecast 2023-2028 ($ million)
- Exhibits35: Data Table on Electronics - Market size and forecast 2023-2028 ($ million)
- Exhibits36: Chart on Electronics - Year-over-year growth 2023-2028 (%)
- Exhibits37: Data Table on Electronics - Year-over-year growth 2023-2028 (%)
- Exhibits38: Chart on Automotive - Market size and forecast 2023-2028 ($ million)
- Exhibits39: Data Table on Automotive - Market size and forecast 2023-2028 ($ million)
- Exhibits40: Chart on Automotive - Year-over-year growth 2023-2028 (%)
- Exhibits41: Data Table on Automotive - Year-over-year growth 2023-2028 (%)
- Exhibits42: Chart on Medical - Market size and forecast 2023-2028 ($ million)
- Exhibits43: Data Table on Medical - Market size and forecast 2023-2028 ($ million)
- Exhibits44: Chart on Medical - Year-over-year growth 2023-2028 (%)
- Exhibits45: Data Table on Medical - Year-over-year growth 2023-2028 (%)
- Exhibits46: Chart on Solar - Market size and forecast 2023-2028 ($ million)
- Exhibits47: Data Table on Solar - Market size and forecast 2023-2028 ($ million)
- Exhibits48: Chart on Solar - Year-over-year growth 2023-2028 (%)
- Exhibits49: Data Table on Solar - Year-over-year growth 2023-2028 (%)
- Exhibits50: Chart on Aerospace and defense - Market size and forecast 2023-2028 ($ million)
- Exhibits51: Data Table on Aerospace and defense - Market size and forecast 2023-2028 ($ million)
- Exhibits52: Chart on Aerospace and defense - Year-over-year growth 2023-2028 (%)
- Exhibits53: Data Table on Aerospace and defense - Year-over-year growth 2023-2028 (%)
- Exhibits54: Market opportunity by End-user ($ million)
- Exhibits55: Data Table on Market opportunity by End-user ($ million)
- Exhibits56: Analysis of price sensitivity, lifecycle, customer purchase basket, adoption rates, and purchase criteria
- Exhibits57: Chart on Market share by geography 2023-2028 (%)
- Exhibits58: Data Table on Market share by geography 2023-2028 (%)
- Exhibits59: Chart on Geographic comparison
- Exhibits60: Data Table on Geographic comparison
- Exhibits61: Chart on APAC - Market size and forecast 2023-2028 ($ million)
- Exhibits62: Data Table on APAC - Market size and forecast 2023-2028 ($ million)
- Exhibits63: Chart on APAC - Year-over-year growth 2023-2028 (%)
- Exhibits64: Data Table on APAC - Year-over-year growth 2023-2028 (%)
- Exhibits65: Chart on North America - Market size and forecast 2023-2028 ($ million)
- Exhibits66: Data Table on North America - Market size and forecast 2023-2028 ($ million)
- Exhibits67: Chart on North America - Year-over-year growth 2023-2028 (%)
- Exhibits68: Data Table on North America - Year-over-year growth 2023-2028 (%)
- Exhibits69: Chart on Europe - Market size and forecast 2023-2028 ($ million)
- Exhibits70: Data Table on Europe - Market size and forecast 2023-2028 ($ million)
- Exhibits71: Chart on Europe - Year-over-year growth 2023-2028 (%)
- Exhibits72: Data Table on Europe - Year-over-year growth 2023-2028 (%)
- Exhibits73: Chart on South America - Market size and forecast 2023-2028 ($ million)
- Exhibits74: Data Table on South America - Market size and forecast 2023-2028 ($ million)
- Exhibits75: Chart on South America - Year-over-year growth 2023-2028 (%)
- Exhibits76: Data Table on South America - Year-over-year growth 2023-2028 (%)
- Exhibits77: Chart on Middle East and Africa - Market size and forecast 2023-2028 ($ million)
- Exhibits78: Data Table on Middle East and Africa - Market size and forecast 2023-2028 ($ million)
- Exhibits79: Chart on Middle East and Africa - Year-over-year growth 2023-2028 (%)
- Exhibits80: Data Table on Middle East and Africa - Year-over-year growth 2023-2028 (%)
- Exhibits81: Chart on US - Market size and forecast 2023-2028 ($ million)
- Exhibits82: Data Table on US - Market size and forecast 2023-2028 ($ million)
- Exhibits83: Chart on US - Year-over-year growth 2023-2028 (%)
- Exhibits84: Data Table on US - Year-over-year growth 2023-2028 (%)
- Exhibits85: Chart on China - Market size and forecast 2023-2028 ($ million)
- Exhibits86: Data Table on China - Market size and forecast 2023-2028 ($ million)
- Exhibits87: Chart on China - Year-over-year growth 2023-2028 (%)
- Exhibits88: Data Table on China - Year-over-year growth 2023-2028 (%)
- Exhibits89: Chart on Japan - Market size and forecast 2023-2028 ($ million)
- Exhibits90: Data Table on Japan - Market size and forecast 2023-2028 ($ million)
- Exhibits91: Chart on Japan - Year-over-year growth 2023-2028 (%)
- Exhibits92: Data Table on Japan - Year-over-year growth 2023-2028 (%)
- Exhibits93: Chart on Germany - Market size and forecast 2023-2028 ($ million)
- Exhibits94: Data Table on Germany - Market size and forecast 2023-2028 ($ million)
- Exhibits95: Chart on Germany - Year-over-year growth 2023-2028 (%)
- Exhibits96: Data Table on Germany - Year-over-year growth 2023-2028 (%)
- Exhibits97: Chart on UK - Market size and forecast 2023-2028 ($ million)
- Exhibits98: Data Table on UK - Market size and forecast 2023-2028 ($ million)
- Exhibits99: Chart on UK - Year-over-year growth 2023-2028 (%)
- Exhibits100: Data Table on UK - Year-over-year growth 2023-2028 (%)
- Exhibits101: Market opportunity by geography ($ million)
- Exhibits102: Data Tables on Market opportunity by geography ($ million)
- Exhibits103: Impact of drivers and challenges in 2023 and 2028
- Exhibits104: Overview on criticality of inputs and factors of differentiation
- Exhibits105: Overview on factors of disruption
- Exhibits106: Impact of key risks on business
- Exhibits107: Companies covered
- Exhibits108: Matrix on companies position and classification
- Exhibits109: AGC Inc. - Overview
- Exhibits110: AGC Inc. - Business segments
- Exhibits111: AGC Inc. - Key news
- Exhibits112: AGC Inc. - Key offerings
- Exhibits113: AGC Inc. - Segment focus
- Exhibits114: Corning Inc. - Overview
- Exhibits115: Corning Inc. - Business segments
- Exhibits116: Corning Inc. - Key news
- Exhibits117: Corning Inc. - Key offerings
- Exhibits118: Corning Inc. - Segment focus
- Exhibits119: HOYA CORP. - Overview
- Exhibits120: HOYA CORP. - Business segments
- Exhibits121: HOYA CORP. - Key offerings
- Exhibits122: HOYA CORP. - Segment focus
- Exhibits123: Nippon Sheet Glass Co. Ltd. - Overview
- Exhibits124: Nippon Sheet Glass Co. Ltd. - Business segments
- Exhibits125: Nippon Sheet Glass Co. Ltd. - Key news
- Exhibits126: Nippon Sheet Glass Co. Ltd. - Key offerings
- Exhibits127: Nippon Sheet Glass Co. Ltd. - Segment focus
- Exhibits128: Ohara Inc. - Overview
- Exhibits129: Ohara Inc. - Business segments
- Exhibits130: Ohara Inc. - Key offerings
- Exhibits131: Ohara Inc. - Segment focus
- Exhibits132: Otto Chemie Pvt. Ltd. - Overview
- Exhibits133: Otto Chemie Pvt. Ltd. - Product / Service
- Exhibits134: Otto Chemie Pvt. Ltd. - Key offerings
- Exhibits135: Plan Optik AG - Overview
- Exhibits136: Plan Optik AG - Product / Service
- Exhibits137: Plan Optik AG - Key offerings
- Exhibits138: SCHOTT AG - Overview
- Exhibits139: SCHOTT AG - Product / Service
- Exhibits140: SCHOTT AG - Key news
- Exhibits141: SCHOTT AG - Key offerings
- Exhibits142: Shin Etsu Chemical Co. Ltd. - Overview
- Exhibits143: Shin Etsu Chemical Co. Ltd. - Business segments
- Exhibits144: Shin Etsu Chemical Co. Ltd. - Key news
- Exhibits145: Shin Etsu Chemical Co. Ltd. - Key offerings
- Exhibits146: Shin Etsu Chemical Co. Ltd. - Segment focus
- Exhibits147: Vedanta Ltd. - Overview
- Exhibits148: Vedanta Ltd. - Business segments
- Exhibits149: Vedanta Ltd. - Key news
- Exhibits150: Vedanta Ltd. - Key offerings
- Exhibits151: Vedanta Ltd. - Segment focus
- Exhibits152: Inclusions checklist
- Exhibits153: Exclusions checklist
- Exhibits154: Currency conversion rates for US$
- Exhibits155: Research methodology
- Exhibits156: Information sources
- Exhibits157: Data validation
- Exhibits158: Validation techniques employed for market sizing
- Exhibits159: Data synthesis
- Exhibits160: 360 degree market analysis
- Exhibits161: List of abbreviations
The glass substrate market is forecasted to grow by USD 489.7 mn during 2023-2028, accelerating at a CAGR of 4.83% during the forecast period. The report on the glass substrate market provides a holistic analysis, market size and forecast, trends, growth drivers, and challenges, as well as vendor analysis covering around 25 vendors.
The report offers an up-to-date analysis regarding the current market scenario, the latest trends and drivers, and the overall market environment. The market is driven by increasing adoption of glass fiber composites in automobiles, rise in use of glass substrates for aerospace and defense applications, and surging demand for consumer electronics.
Technavio's glass substrate market is segmented as below:
| Market Scope | |
|---|---|
| Base Year | 2024 |
| End Year | 2028 |
| Series Year | 2024-2028 |
| Growth Momentum | Accelerate |
| YOY 2024 | 4.37% |
| CAGR | 4.83% |
| Incremental Value | $489.7mn |
By End-user
- Electronics
- Automotive
- Medical
- Solar
- Aerospace and defense
By Geography
- APAC
- North America
- Europe
- South America
- Middle East and Africa
This study identifies the adoption of glass substrates in solar power-generating plants as one of the prime reasons driving the glass substrate market growth during the next few years. Also, increasing focus of vendors on product innovations and growing number of mergers and acquisitions among vendors will lead to sizable demand in the market.
The report on the glass substrate market covers the following areas:
- Glass substrate market sizing
- Glass substrate market forecast
- Glass substrate market industry analysis
The robust vendor analysis is designed to help clients improve their market position, and in line with this, this report provides a detailed analysis of several leading glass substrate market vendors that include AGC Inc., Apogee Enterprises Inc, Corning Inc., DuPont de Nemours Inc., HOYA CORP., IRICO Group New Energy Co. Ltd., Kyodo International Inc., Laseroptik GmbH, MTI Corp., Nippon Sheet Glass Co. Ltd., NOVA Electronic Materials LLC, Ohara Inc., Otto Chemie Pvt. Ltd., Plan Optik AG, SCHOTT AG, Shilpa Enterprises, Shin Etsu Chemical Co. Ltd., Solaronix SA, Techinstro Industries, and Vedanta Ltd.. Also, the glass substrate market analysis report includes information on upcoming trends and challenges that will influence market growth. This is to help companies strategize and leverage all forthcoming growth opportunities.
The study was conducted using an objective combination of primary and secondary information including inputs from key participants in the industry. The report contains a comprehensive market and vendor landscape in addition to an analysis of the key vendors.
The publisher presents a detailed picture of the market by the way of study, synthesis, and summation of data from multiple sources by an analysis of key parameters such as profit, pricing, competition, and promotions. It presents various market facets by identifying the key industry influencers. The data presented is comprehensive, reliable, and a result of extensive research - both primary and secondary. The market research reports provide a complete competitive landscape and an in-depth vendor selection methodology and analysis using qualitative and quantitative research to forecast the accurate market growth.
Table of Contents
1 Executive Summary
- 1.1 Market overview
- Executive Summary - Chart on Market Overview
- Executive Summary - Data Table on Market Overview
- Executive Summary - Chart on Global Market Characteristics
- Executive Summary - Chart on Market by Geography
- Executive Summary - Chart on Market Segmentation by End-user
- Executive Summary - Chart on Incremental Growth
- Executive Summary - Data Table on Incremental Growth
- Executive Summary - Chart on Company Market Positioning
2 Market Landscape
- 2.1 Market ecosystem
- Parent Market
- Data Table on - Parent Market
- 2.2 Market characteristics
- Market characteristics analysis
- 2.3 Value chain analysis
- Value Chain Analysis
3 Market Sizing
- 3.1 Market definition
- Offerings of companies included in the market definition
- 3.2 Market segment analysis
- Market segments
- 3.3 Market size 2023
- 3.4 Market outlook: Forecast for 2023-2028
- Chart on Global - Market size and forecast 2023-2028 ($ million)
- Data Table on Global - Market size and forecast 2023-2028 ($ million)
- Chart on Global Market: Year-over-year growth 2023-2028 (%)
- Data Table on Global Market: Year-over-year growth 2023-2028 (%)
4 Historic Market Size
- 4.1 Global Glass Substrate Market 2018 - 2022
- Historic Market Size - Data Table on Global Glass Substrate Market 2018 - 2022 ($ million)
- 4.2 End-user segment analysis 2018 - 2022
- Historic Market Size - End-user Segment 2018 - 2022 ($ million)
- 4.3 Geography segment analysis 2018 - 2022
- Historic Market Size - Geography Segment 2018 - 2022 ($ million)
- 4.4 Country segment analysis 2018 - 2022
- Historic Market Size - Country Segment 2018 - 2022 ($ million)
5 Five Forces Analysis
- 5.1 Five forces summary
- Five forces analysis - Comparison between 2023 and 2028
- 5.2 Bargaining power of buyers
- Bargaining power of buyers - Impact of key factors 2023 and 2028
- 5.3 Bargaining power of suppliers
- Bargaining power of suppliers - Impact of key factors in 2023 and 2028
- 5.4 Threat of new entrants
- Threat of new entrants - Impact of key factors in 2023 and 2028
- 5.5 Threat of substitutes
- Threat of substitutes - Impact of key factors in 2023 and 2028
- 5.6 Threat of rivalry
- Threat of rivalry - Impact of key factors in 2023 and 2028
- 5.7 Market condition
- Chart on Market condition - Five forces 2023 and 2028
6 Market Segmentation by End-user
- 6.1 Market segments
- Chart on End-user - Market share 2023-2028 (%)
- Data Table on End-user - Market share 2023-2028 (%)
- 6.2 Comparison by End-user
- Chart on Comparison by End-user
- Data Table on Comparison by End-user
- 6.3 Electronics - Market size and forecast 2023-2028
- Chart on Electronics - Market size and forecast 2023-2028 ($ million)
- Data Table on Electronics - Market size and forecast 2023-2028 ($ million)
- Chart on Electronics - Year-over-year growth 2023-2028 (%)
- Data Table on Electronics - Year-over-year growth 2023-2028 (%)
- 6.4 Automotive - Market size and forecast 2023-2028
- Chart on Automotive - Market size and forecast 2023-2028 ($ million)
- Data Table on Automotive - Market size and forecast 2023-2028 ($ million)
- Chart on Automotive - Year-over-year growth 2023-2028 (%)
- Data Table on Automotive - Year-over-year growth 2023-2028 (%)
- 6.5 Medical - Market size and forecast 2023-2028
- Chart on Medical - Market size and forecast 2023-2028 ($ million)
- Data Table on Medical - Market size and forecast 2023-2028 ($ million)
- Chart on Medical - Year-over-year growth 2023-2028 (%)
- Data Table on Medical - Year-over-year growth 2023-2028 (%)
- 6.6 Solar - Market size and forecast 2023-2028
- Chart on Solar - Market size and forecast 2023-2028 ($ million)
- Data Table on Solar - Market size and forecast 2023-2028 ($ million)
- Chart on Solar - Year-over-year growth 2023-2028 (%)
- Data Table on Solar - Year-over-year growth 2023-2028 (%)
- 6.7 Aerospace and defense - Market size and forecast 2023-2028
- Chart on Aerospace and defense - Market size and forecast 2023-2028 ($ million)
- Data Table on Aerospace and defense - Market size and forecast 2023-2028 ($ million)
- Chart on Aerospace and defense - Year-over-year growth 2023-2028 (%)
- Data Table on Aerospace and defense - Year-over-year growth 2023-2028 (%)
- 6.8 Market opportunity by End-user
- Market opportunity by End-user ($ million)
- Data Table on Market opportunity by End-user ($ million)
7 Customer Landscape
- 7.1 Customer landscape overview
- Analysis of price sensitivity, lifecycle, customer purchase basket, adoption rates, and purchase criteria
8 Geographic Landscape
- 8.1 Geographic segmentation
- Chart on Market share by geography 2023-2028 (%)
- Data Table on Market share by geography 2023-2028 (%)
- 8.2 Geographic comparison
- Chart on Geographic comparison
- Data Table on Geographic comparison
- 8.3 APAC - Market size and forecast 2023-2028
- Chart on APAC - Market size and forecast 2023-2028 ($ million)
- Data Table on APAC - Market size and forecast 2023-2028 ($ million)
- Chart on APAC - Year-over-year growth 2023-2028 (%)
- Data Table on APAC - Year-over-year growth 2023-2028 (%)
- 8.4 North America - Market size and forecast 2023-2028
- Chart on North America - Market size and forecast 2023-2028 ($ million)
- Data Table on North America - Market size and forecast 2023-2028 ($ million)
- Chart on North America - Year-over-year growth 2023-2028 (%)
- Data Table on North America - Year-over-year growth 2023-2028 (%)
- 8.5 Europe - Market size and forecast 2023-2028
- Chart on Europe - Market size and forecast 2023-2028 ($ million)
- Data Table on Europe - Market size and forecast 2023-2028 ($ million)
- Chart on Europe - Year-over-year growth 2023-2028 (%)
- Data Table on Europe - Year-over-year growth 2023-2028 (%)
- 8.6 South America - Market size and forecast 2023-2028
- Chart on South America - Market size and forecast 2023-2028 ($ million)
- Data Table on South America - Market size and forecast 2023-2028 ($ million)
- Chart on South America - Year-over-year growth 2023-2028 (%)
- Data Table on South America - Year-over-year growth 2023-2028 (%)
- 8.7 Middle East and Africa - Market size and forecast 2023-2028
- Chart on Middle East and Africa - Market size and forecast 2023-2028 ($ million)
- Data Table on Middle East and Africa - Market size and forecast 2023-2028 ($ million)
- Chart on Middle East and Africa - Year-over-year growth 2023-2028 (%)
- Data Table on Middle East and Africa - Year-over-year growth 2023-2028 (%)
- 8.8 US - Market size and forecast 2023-2028
- Chart on US - Market size and forecast 2023-2028 ($ million)
- Data Table on US - Market size and forecast 2023-2028 ($ million)
- Chart on US - Year-over-year growth 2023-2028 (%)
- Data Table on US - Year-over-year growth 2023-2028 (%)
- 8.9 China - Market size and forecast 2023-2028
- Chart on China - Market size and forecast 2023-2028 ($ million)
- Data Table on China - Market size and forecast 2023-2028 ($ million)
- Chart on China - Year-over-year growth 2023-2028 (%)
- Data Table on China - Year-over-year growth 2023-2028 (%)
- 8.10 Japan - Market size and forecast 2023-2028
- Chart on Japan - Market size and forecast 2023-2028 ($ million)
- Data Table on Japan - Market size and forecast 2023-2028 ($ million)
- Chart on Japan - Year-over-year growth 2023-2028 (%)
- Data Table on Japan - Year-over-year growth 2023-2028 (%)
- 8.11 Germany - Market size and forecast 2023-2028
- Chart on Germany - Market size and forecast 2023-2028 ($ million)
- Data Table on Germany - Market size and forecast 2023-2028 ($ million)
- Chart on Germany - Year-over-year growth 2023-2028 (%)
- Data Table on Germany - Year-over-year growth 2023-2028 (%)
- 8.12 UK - Market size and forecast 2023-2028
- Chart on UK - Market size and forecast 2023-2028 ($ million)
- Data Table on UK - Market size and forecast 2023-2028 ($ million)
- Chart on UK - Year-over-year growth 2023-2028 (%)
- Data Table on UK - Year-over-year growth 2023-2028 (%)
- 8.13 Market opportunity by geography
- Market opportunity by geography ($ million)
- Data Tables on Market opportunity by geography ($ million)
9 Drivers, Challenges, and Opportunity/Restraints
- 9.1 Market drivers
- 9.2 Market challenges
- 9.3 Impact of drivers and challenges
- Impact of drivers and challenges in 2023 and 2028
- 9.4 Market opportunities/restraints
10 Competitive Landscape
- 10.1 Overview
- 10.2 Competitive Landscape
- Overview on criticality of inputs and factors of differentiation
- 10.3 Landscape disruption
- Overview on factors of disruption
- 10.4 Industry risks
- Impact of key risks on business
11 Competitive Analysis
- 11.1 Companies profiled
- Companies covered
- 11.2 Market positioning of companies
- Matrix on companies position and classification
- 11.3 AGC Inc.
- AGC Inc. - Overview
- AGC Inc. - Business segments
- AGC Inc. - Key news
- AGC Inc. - Key offerings
- AGC Inc. - Segment focus
- 11.4 Corning Inc.
- Corning Inc. - Overview
- Corning Inc. - Business segments
- Corning Inc. - Key news
- Corning Inc. - Key offerings
- Corning Inc. - Segment focus
- 11.5 HOYA CORP.
- HOYA CORP. - Overview
- HOYA CORP. - Business segments
- HOYA CORP. - Key offerings
- HOYA CORP. - Segment focus
- 11.6 Nippon Sheet Glass Co. Ltd.
- Nippon Sheet Glass Co. Ltd. - Overview
- Nippon Sheet Glass Co. Ltd. - Business segments
- Nippon Sheet Glass Co. Ltd. - Key news
- Nippon Sheet Glass Co. Ltd. - Key offerings
- Nippon Sheet Glass Co. Ltd. - Segment focus
- 11.7 Ohara Inc.
- Ohara Inc. - Overview
- Ohara Inc. - Business segments
- Ohara Inc. - Key offerings
- Ohara Inc. - Segment focus
- 11.8 Otto Chemie Pvt. Ltd.
- Otto Chemie Pvt. Ltd. - Overview
- Otto Chemie Pvt. Ltd. - Product / Service
- Otto Chemie Pvt. Ltd. - Key offerings
- 11.9 Plan Optik AG
- Plan Optik AG - Overview
- Plan Optik AG - Product / Service
- Plan Optik AG - Key offerings
- 11.10 SCHOTT AG
- SCHOTT AG - Overview
- SCHOTT AG - Product / Service
- SCHOTT AG - Key news
- SCHOTT AG - Key offerings
- 11.11 Shin Etsu Chemical Co. Ltd.
- Shin Etsu Chemical Co. Ltd. - Overview
- Shin Etsu Chemical Co. Ltd. - Business segments
- Shin Etsu Chemical Co. Ltd. - Key news
- Shin Etsu Chemical Co. Ltd. - Key offerings
- Shin Etsu Chemical Co. Ltd. - Segment focus
- 11.12 Vedanta Ltd.
- Vedanta Ltd. - Overview
- Vedanta Ltd. - Business segments
- Vedanta Ltd. - Key news
- Vedanta Ltd. - Key offerings
- Vedanta Ltd. - Segment focus
12 Appendix
- 12.1 Scope of the report
- 12.2 Inclusions and exclusions checklist
- Inclusions checklist
- Exclusions checklist
- 12.3 Currency conversion rates for US$
- Currency conversion rates for US$
- 12.4 Research methodology
- Research methodology
- 12.5 Data procurement
- Information sources
- 12.6 Data validation
- Data validation
- 12.7 Validation techniques employed for market sizing
- Validation techniques employed for market sizing
- 12.8 Data synthesis
- Data synthesis
- 12.9 360 degree market analysis
- 360 degree market analysis
- 12.10 List of abbreviations
- List of abbreviations
