|
|
市場調査レポート
商品コード
1557482
ラテラルフローアッセイ用コンポーネントの世界市場 2024年~2028年Global Lateral Flow Assay Components Market 2024-2028 |
||||||

|
|||||||
カスタマイズ可能
|
|||||||

| ラテラルフローアッセイ用コンポーネントの世界市場 2024年~2028年 |
|
出版日: 2024年08月15日
発行: TechNavio
ページ情報: 英文 169 Pages
納期: 即納可能
|

全表示
- 概要
- 図表
- 目次
ラテラルフローアッセイ用コンポーネント市場は2023年~2028年年に9,550万米ドル、予測期間中のCAGRは5.07%で成長すると予測されます。
当レポートでは、ラテラルフローアッセイ用コンポーネント市場の全体的な分析、市場規模・予測、動向、成長促進要因、課題、約25のベンダーを網羅したベンダー分析などを掲載しています。
現在の市場シナリオ、最新動向と促進要因、市場環境全体に関する最新分析を提供しています。市場は、研究開発への取り組みの高まり、技術の進歩、家庭用ラテラルフローアッセイ装置の利用拡大によって牽引されています。
| 市場範囲 | |
|---|---|
| 基準年 | 2024年 |
| 終了年 | 2028年 |
| 予測期間 | 2024年~2028年 |
| 成長モメンタム | 加速 |
| 前年比2024年 | 4.61% |
| CAGR | 5.07% |
| 増分額 | 9,550万米ドル |
本調査では、今後数年間におけるラテラルフローアッセイ用コンポーネント市場の成長を牽引する主な要因の1つとして、ポイントオブケア(POC)検査の需要拡大を挙げています。また、ラテラルフローアッセイのアプリケーションの発展や、ラテラルフローアッセイ開発のための公共投資や民間投資の増加は、市場の大きな需要につながります。
目次
第1章 エグゼクティブサマリー
- 市場概要
第2章 市場情勢
- 市場エコシステム
- 市場の特徴
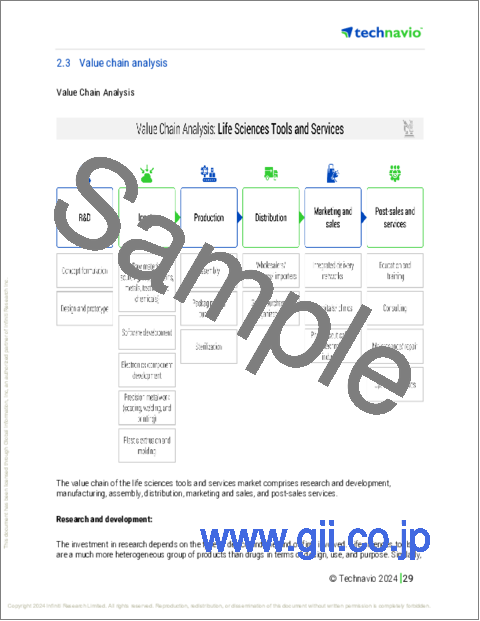
- バリューチェーン分析
第3章 市場規模の評価
- 市場の定義
- 市場セグメント分析
- 市場規模 2023年
- 市場の見通し 2023年~2028年
第4章 市場規模実績
- ラテラルフローアッセイ用コンポーネントの世界市場 2018年~2022年
- テクニックセグメント分析 2018年~2022年
- エンドユーザーセグメント分析 2018年~2022年
- 地域別セグメント分析 2018年~2022年
- 国別セグメント分析 2018年~2022年
第5章 ファイブフォース分析
- ファイブフォースの要約
- 買い手の交渉力
- 供給企業の交渉力
- 新規参入業者の脅威
- 代替品の脅威
- 競争の脅威
- 市況
第6章 市場セグメンテーション:技術別
- 市場セグメンテーション
- 比較:技術別
- サンドイッチアッセイ:市場規模と予測 2023年~2028年
- 競合アッセイ:市場規模と予測 2023年~2028年
- マルチプレックス検出アッセイ:市場規模と予測 2023年~2028年
- 市場機会:技術別
第7章 市場セグメンテーション:エンドユーザー別
- 市場セグメンテーション
- 比較:エンドユーザー別
- 医療機器製造会社:市場規模と予測 2023年~2028年
- 医療機器受託製造会社:市場規模と予測 2023年~2028年
- 市場機会:エンドユーザー別
第8章 顧客情勢
- 顧客情勢の概要
第9章 地域別情勢
- 地域別セグメンテーション
- 地域別比較
- 北米:市場規模と予測 2023年~2028年
- 欧州:市場規模と予測 2023年~2028年
- アジア:市場規模と予測 2023年~2028年
- 世界のその他の地域:市場規模と予測 2023年~2028年
- 米国:市場規模と予測 2023年~2028年
- ドイツ:市場規模と予測 2023年~2028年
- 英国:市場規模と予測 2023年~2028年
- 中国:市場規模と予測 2023年~2028年
- カナダ:市場規模と予測 2023年~2028年
- 市場機会:地域情勢別
第10章 促進要因・課題・機会・抑制要因
- 市場促進要因
- 市場の課題
- 促進要因と課題の影響
- 市場の機会・抑制要因
第11章 競合情勢
- 概要
- 競合情勢
- 混乱の状況
- 業界のリスク
第12章 競合分析
- 企業プロファイル
- 企業の市場ポジショニング
- Abbott Laboratories
- Ahlstrom Holding 3 Oy
- Becton Dickinson and Co.
- Bio Rad Laboratories Inc.
- Bio Techne Corp.
- F. Hoffmann La Roche Ltd.
- Geno Technology Inc.
- Hologic Inc.
- Merck KGaA
- Perkin Elmer Inc.
- QIAGEN NV
- Quidelortho Corp.
- Sartorius AG
- Siemens AG
- Thermo Fisher Scientific Inc.
第13章 付録
Exhibits:
- Exhibits1: Executive Summary - Chart on Market Overview
- Exhibits2: Executive Summary - Data Table on Market Overview
- Exhibits3: Executive Summary - Chart on Global Market Characteristics
- Exhibits4: Executive Summary - Chart on Market By Geographical Landscape
- Exhibits5: Executive Summary - Chart on Market Segmentation by Technique
- Exhibits6: Executive Summary - Chart on Market Segmentation by End-user
- Exhibits7: Executive Summary - Chart on Incremental Growth
- Exhibits8: Executive Summary - Data Table on Incremental Growth
- Exhibits9: Executive Summary - Chart on Company Market Positioning
- Exhibits10: Parent Market
- Exhibits11: Data Table on - Parent Market
- Exhibits12: Market characteristics analysis
- Exhibits13: Value Chain Analysis
- Exhibits14: Offerings of companies included in the market definition
- Exhibits15: Market segments
- Exhibits16: Chart on Global - Market size and forecast 2023-2028 ($ million)
- Exhibits17: Data Table on Global - Market size and forecast 2023-2028 ($ million)
- Exhibits18: Chart on Global Market: Year-over-year growth 2023-2028 (%)
- Exhibits19: Data Table on Global Market: Year-over-year growth 2023-2028 (%)
- Exhibits20: Historic Market Size - Data Table on Global Lateral Flow Assay Components Market 2018 - 2022 ($ million)
- Exhibits21: Historic Market Size - Technique Segment 2018 - 2022 ($ million)
- Exhibits22: Historic Market Size - End-user Segment 2018 - 2022 ($ million)
- Exhibits23: Historic Market Size - Geography Segment 2018 - 2022 ($ million)
- Exhibits24: Historic Market Size - Country Segment 2018 - 2022 ($ million)
- Exhibits25: Five forces analysis - Comparison between 2023 and 2028
- Exhibits26: Bargaining power of buyers - Impact of key factors 2023 and 2028
- Exhibits27: Bargaining power of suppliers - Impact of key factors in 2023 and 2028
- Exhibits28: Threat of new entrants - Impact of key factors in 2023 and 2028
- Exhibits29: Threat of substitutes - Impact of key factors in 2023 and 2028
- Exhibits30: Threat of rivalry - Impact of key factors in 2023 and 2028
- Exhibits31: Chart on Market condition - Five forces 2023 and 2028
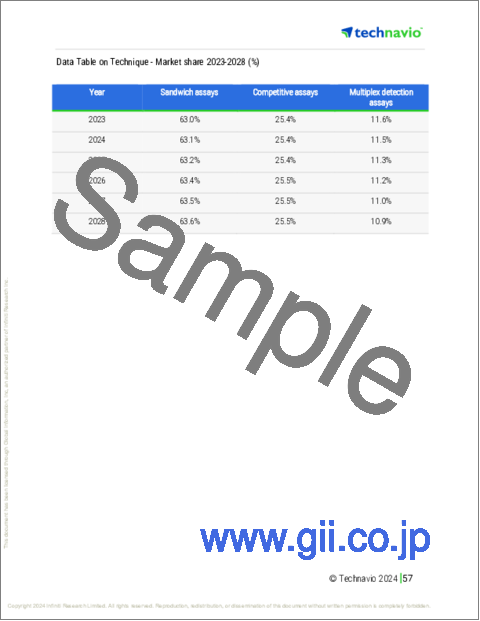
- Exhibits32: Chart on Technique - Market share 2023-2028 (%)
- Exhibits33: Data Table on Technique - Market share 2023-2028 (%)
- Exhibits34: Chart on Comparison by Technique
- Exhibits35: Data Table on Comparison by Technique
- Exhibits36: Chart on Sandwich assays - Market size and forecast 2023-2028 ($ million)
- Exhibits37: Data Table on Sandwich assays - Market size and forecast 2023-2028 ($ million)
- Exhibits38: Chart on Sandwich assays - Year-over-year growth 2023-2028 (%)
- Exhibits39: Data Table on Sandwich assays - Year-over-year growth 2023-2028 (%)
- Exhibits40: Chart on Competitive assays - Market size and forecast 2023-2028 ($ million)
- Exhibits41: Data Table on Competitive assays - Market size and forecast 2023-2028 ($ million)
- Exhibits42: Chart on Competitive assays - Year-over-year growth 2023-2028 (%)
- Exhibits43: Data Table on Competitive assays - Year-over-year growth 2023-2028 (%)
- Exhibits44: Chart on Multiplex detection assays - Market size and forecast 2023-2028 ($ million)
- Exhibits45: Data Table on Multiplex detection assays - Market size and forecast 2023-2028 ($ million)
- Exhibits46: Chart on Multiplex detection assays - Year-over-year growth 2023-2028 (%)
- Exhibits47: Data Table on Multiplex detection assays - Year-over-year growth 2023-2028 (%)
- Exhibits48: Market opportunity by Technique ($ million)
- Exhibits49: Data Table on Market opportunity by Technique ($ million)
- Exhibits50: Chart on End-user - Market share 2023-2028 (%)
- Exhibits51: Data Table on End-user - Market share 2023-2028 (%)
- Exhibits52: Chart on Comparison by End-user
- Exhibits53: Data Table on Comparison by End-user
- Exhibits54: Chart on Medical device manufacturing companies - Market size and forecast 2023-2028 ($ million)
- Exhibits55: Data Table on Medical device manufacturing companies - Market size and forecast 2023-2028 ($ million)
- Exhibits56: Chart on Medical device manufacturing companies - Year-over-year growth 2023-2028 (%)
- Exhibits57: Data Table on Medical device manufacturing companies - Year-over-year growth 2023-2028 (%)
- Exhibits58: Chart on Medical device contract manufacturing companies - Market size and forecast 2023-2028 ($ million)
- Exhibits59: Data Table on Medical device contract manufacturing companies - Market size and forecast 2023-2028 ($ million)
- Exhibits60: Chart on Medical device contract manufacturing companies - Year-over-year growth 2023-2028 (%)
- Exhibits61: Data Table on Medical device contract manufacturing companies - Year-over-year growth 2023-2028 (%)
- Exhibits62: Market opportunity by End-user ($ million)
- Exhibits63: Data Table on Market opportunity by End-user ($ million)
- Exhibits64: Analysis of price sensitivity, lifecycle, customer purchase basket, adoption rates, and purchase criteria
- Exhibits65: Chart on Market share By Geographical Landscape 2023-2028 (%)
- Exhibits66: Data Table on Market share By Geographical Landscape 2023-2028 (%)
- Exhibits67: Chart on Geographic comparison
- Exhibits68: Data Table on Geographic comparison
- Exhibits69: Chart on North America - Market size and forecast 2023-2028 ($ million)
- Exhibits70: Data Table on North America - Market size and forecast 2023-2028 ($ million)
- Exhibits71: Chart on North America - Year-over-year growth 2023-2028 (%)
- Exhibits72: Data Table on North America - Year-over-year growth 2023-2028 (%)
- Exhibits73: Chart on Europe - Market size and forecast 2023-2028 ($ million)
- Exhibits74: Data Table on Europe - Market size and forecast 2023-2028 ($ million)
- Exhibits75: Chart on Europe - Year-over-year growth 2023-2028 (%)
- Exhibits76: Data Table on Europe - Year-over-year growth 2023-2028 (%)
- Exhibits77: Chart on Asia - Market size and forecast 2023-2028 ($ million)
- Exhibits78: Data Table on Asia - Market size and forecast 2023-2028 ($ million)
- Exhibits79: Chart on Asia - Year-over-year growth 2023-2028 (%)
- Exhibits80: Data Table on Asia - Year-over-year growth 2023-2028 (%)
- Exhibits81: Chart on Rest of World (ROW) - Market size and forecast 2023-2028 ($ million)
- Exhibits82: Data Table on Rest of World (ROW) - Market size and forecast 2023-2028 ($ million)
- Exhibits83: Chart on Rest of World (ROW) - Year-over-year growth 2023-2028 (%)
- Exhibits84: Data Table on Rest of World (ROW) - Year-over-year growth 2023-2028 (%)
- Exhibits85: Chart on US - Market size and forecast 2023-2028 ($ million)
- Exhibits86: Data Table on US - Market size and forecast 2023-2028 ($ million)
- Exhibits87: Chart on US - Year-over-year growth 2023-2028 (%)
- Exhibits88: Data Table on US - Year-over-year growth 2023-2028 (%)
- Exhibits89: Chart on Germany - Market size and forecast 2023-2028 ($ million)
- Exhibits90: Data Table on Germany - Market size and forecast 2023-2028 ($ million)
- Exhibits91: Chart on Germany - Year-over-year growth 2023-2028 (%)
- Exhibits92: Data Table on Germany - Year-over-year growth 2023-2028 (%)
- Exhibits93: Chart on UK - Market size and forecast 2023-2028 ($ million)
- Exhibits94: Data Table on UK - Market size and forecast 2023-2028 ($ million)
- Exhibits95: Chart on UK - Year-over-year growth 2023-2028 (%)
- Exhibits96: Data Table on UK - Year-over-year growth 2023-2028 (%)
- Exhibits97: Chart on China - Market size and forecast 2023-2028 ($ million)
- Exhibits98: Data Table on China - Market size and forecast 2023-2028 ($ million)
- Exhibits99: Chart on China - Year-over-year growth 2023-2028 (%)
- Exhibits100: Data Table on China - Year-over-year growth 2023-2028 (%)
- Exhibits101: Chart on Canada - Market size and forecast 2023-2028 ($ million)
- Exhibits102: Data Table on Canada - Market size and forecast 2023-2028 ($ million)
- Exhibits103: Chart on Canada - Year-over-year growth 2023-2028 (%)
- Exhibits104: Data Table on Canada - Year-over-year growth 2023-2028 (%)
- Exhibits105: Market opportunity By Geographical Landscape ($ million)
- Exhibits106: Data Tables on Market opportunity By Geographical Landscape ($ million)
- Exhibits107: Impact of drivers and challenges in 2023 and 2028
- Exhibits108: Overview on criticality of inputs and factors of differentiation
- Exhibits109: Overview on factors of disruption
- Exhibits110: Impact of key risks on business
- Exhibits111: Companies covered
- Exhibits112: Matrix on companies position and classification
- Exhibits113: Abbott Laboratories - Overview
- Exhibits114: Abbott Laboratories - Business segments
- Exhibits115: Abbott Laboratories - Key news
- Exhibits116: Abbott Laboratories - Key offerings
- Exhibits117: Abbott Laboratories - Segment focus
- Exhibits118: Ahlstrom Holding 3 Oy - Overview
- Exhibits119: Ahlstrom Holding 3 Oy - Product / Service
- Exhibits120: Ahlstrom Holding 3 Oy - Key news
- Exhibits121: Ahlstrom Holding 3 Oy - Key offerings
- Exhibits122: Becton Dickinson and Co. - Overview
- Exhibits123: Becton Dickinson and Co. - Business segments
- Exhibits124: Becton Dickinson and Co. - Key news
- Exhibits125: Becton Dickinson and Co. - Key offerings
- Exhibits126: Becton Dickinson and Co. - Segment focus
- Exhibits127: Bio Rad Laboratories Inc. - Overview
- Exhibits128: Bio Rad Laboratories Inc. - Business segments
- Exhibits129: Bio Rad Laboratories Inc. - Key news
- Exhibits130: Bio Rad Laboratories Inc. - Key offerings
- Exhibits131: Bio Rad Laboratories Inc. - Segment focus
- Exhibits132: Bio Techne Corp. - Overview
- Exhibits133: Bio Techne Corp. - Business segments
- Exhibits134: Bio Techne Corp. - Key news
- Exhibits135: Bio Techne Corp. - Key offerings
- Exhibits136: Bio Techne Corp. - Segment focus
- Exhibits137: F. Hoffmann La Roche Ltd. - Overview
- Exhibits138: F. Hoffmann La Roche Ltd. - Business segments
- Exhibits139: F. Hoffmann La Roche Ltd. - Key news
- Exhibits140: F. Hoffmann La Roche Ltd. - Key offerings
- Exhibits141: F. Hoffmann La Roche Ltd. - Segment focus
- Exhibits142: Geno Technology Inc. - Overview
- Exhibits143: Geno Technology Inc. - Product / Service
- Exhibits144: Geno Technology Inc. - Key offerings
- Exhibits145: Hologic Inc. - Overview
- Exhibits146: Hologic Inc. - Business segments
- Exhibits147: Hologic Inc. - Key news
- Exhibits148: Hologic Inc. - Key offerings
- Exhibits149: Hologic Inc. - Segment focus
- Exhibits150: Merck KGaA - Overview
- Exhibits151: Merck KGaA - Business segments
- Exhibits152: Merck KGaA - Key news
- Exhibits153: Merck KGaA - Key offerings
- Exhibits154: Merck KGaA - Segment focus
- Exhibits155: Perkin Elmer Inc. - Overview
- Exhibits156: Perkin Elmer Inc. - Business segments
- Exhibits157: Perkin Elmer Inc. - Key news
- Exhibits158: Perkin Elmer Inc. - Key offerings
- Exhibits159: Perkin Elmer Inc. - Segment focus
- Exhibits160: QIAGEN NV - Overview
- Exhibits161: QIAGEN NV - Product / Service
- Exhibits162: QIAGEN NV - Key news
- Exhibits163: QIAGEN NV - Key offerings
- Exhibits164: Quidelortho Corp. - Overview
- Exhibits165: Quidelortho Corp. - Product / Service
- Exhibits166: Quidelortho Corp. - Key news
- Exhibits167: Quidelortho Corp. - Key offerings
- Exhibits168: Sartorius AG - Overview
- Exhibits169: Sartorius AG - Business segments
- Exhibits170: Sartorius AG - Key news
- Exhibits171: Sartorius AG - Key offerings
- Exhibits172: Sartorius AG - Segment focus
- Exhibits173: Siemens AG - Overview
- Exhibits174: Siemens AG - Business segments
- Exhibits175: Siemens AG - Key news
- Exhibits176: Siemens AG - Key offerings
- Exhibits177: Siemens AG - Segment focus
- Exhibits178: Thermo Fisher Scientific Inc. - Overview
- Exhibits179: Thermo Fisher Scientific Inc. - Business segments
- Exhibits180: Thermo Fisher Scientific Inc. - Key news
- Exhibits181: Thermo Fisher Scientific Inc. - Key offerings
- Exhibits182: Thermo Fisher Scientific Inc. - Segment focus
- Exhibits183: Inclusions checklist
- Exhibits184: Exclusions checklist
- Exhibits185: Currency conversion rates for US$
- Exhibits186: Research methodology
- Exhibits187: Information sources
- Exhibits188: Data validation
- Exhibits189: Validation techniques employed for market sizing
- Exhibits190: Data synthesis
- Exhibits191: 360 degree market analysis
- Exhibits192: List of abbreviations
The lateral flow assay components market is forecasted to grow by USD 95.5 mn during 2023-2028, accelerating at a CAGR of 5.07% during the forecast period. The report on the lateral flow assay components market provides a holistic analysis, market size and forecast, trends, growth drivers, and challenges, as well as vendor analysis covering around 25 vendors.
The report offers an up-to-date analysis regarding the current market scenario, the latest trends and drivers, and the overall market environment. The market is driven by rising efforts in research and development, technological advancement, and growing usage of home-based lateral flow assay devices.
Technavio's lateral flow assay components market is segmented as below:
| Market Scope | |
|---|---|
| Base Year | 2024 |
| End Year | 2028 |
| Series Year | 2024-2028 |
| Growth Momentum | Accelerate |
| YOY 2024 | 4.61% |
| CAGR | 5.07% |
| Incremental Value | $95.5 mn |
By Technique
- Sandwich assays
- Competitive assays
- Multiplex detection assays
By End-user
- Medical device manufacturing companies
- Medical device contract manufacturing companies
By Geographical Landscape
- North America
- Europe
- Asia
- Rest of World (ROW)
This study identifies the growing demand for point-of-care (poc) testing as one of the prime reasons driving the lateral flow assay components market growth during the next few years. Also, evolving application of lateral flow assays and increasing public and private investment to develop lateral flow assays will lead to sizable demand in the market.
The report on the lateral flow assay components market covers the following areas:
- Lateral flow assay components market sizing
- Lateral flow assay components market forecast
- Lateral flow assay components market industry analysis
The robust vendor analysis is designed to help clients improve their market position, and in line with this, this report provides a detailed analysis of several leading lateral flow assay components market vendors that include Abbott Laboratories, Ahlstrom Holding 3 Oy, AXIVA SICHEM Pvt. Ltd., Becton Dickinson and Co., Bio Rad Laboratories Inc., Bio Techne Corp., Cytodiagnostics Inc., DxDiscovery Inc., F. Hoffmann La Roche Ltd., Geno Technology Inc., Hologic Inc., Merck KGaA, Nupore Filtration System, Perkin Elmer Inc., Porex Corp., QIAGEN NV, Quidelortho Corp., Sartorius AG, Siemens AG, and Thermo Fisher Scientific Inc.. Also, the lateral flow assay components market analysis report includes information on upcoming trends and challenges that will influence market growth. This is to help companies strategize and leverage all forthcoming growth opportunities.
The study was conducted using an objective combination of primary and secondary information including inputs from key participants in the industry. The report contains a comprehensive market and vendor landscape in addition to an analysis of the key vendors.
The publisher presents a detailed picture of the market by the way of study, synthesis, and summation of data from multiple sources by an analysis of key parameters such as profit, pricing, competition, and promotions. It presents various market facets by identifying the key industry influencers. The data presented is comprehensive, reliable, and a result of extensive research - both primary and secondary. The market research reports provide a complete competitive landscape and an in-depth vendor selection methodology and analysis using qualitative and quantitative research to forecast the accurate market growth.
Table of Contents
1 Executive Summary
- 1.1 Market overview
- Executive Summary - Chart on Market Overview
- Executive Summary - Data Table on Market Overview
- Executive Summary - Chart on Global Market Characteristics
- Executive Summary - Chart on Market By Geographical Landscape
- Executive Summary - Chart on Market Segmentation by Technique
- Executive Summary - Chart on Market Segmentation by End-user
- Executive Summary - Chart on Incremental Growth
- Executive Summary - Data Table on Incremental Growth
- Executive Summary - Chart on Company Market Positioning
2 Market Landscape
- 2.1 Market ecosystem
- Parent Market
- Data Table on - Parent Market
- 2.2 Market characteristics
- Market characteristics analysis
- 2.3 Value chain analysis
- Value Chain Analysis
3 Market Sizing
- 3.1 Market definition
- Offerings of companies included in the market definition
- 3.2 Market segment analysis
- Market segments
- 3.3 Market size 2023
- 3.4 Market outlook: Forecast for 2023-2028
- Chart on Global - Market size and forecast 2023-2028 ($ million)
- Data Table on Global - Market size and forecast 2023-2028 ($ million)
- Chart on Global Market: Year-over-year growth 2023-2028 (%)
- Data Table on Global Market: Year-over-year growth 2023-2028 (%)
4 Historic Market Size
- 4.1 Global Lateral Flow Assay Components Market 2018 - 2022
- Historic Market Size - Data Table on Global Lateral Flow Assay Components Market 2018 - 2022 ($ million)
- 4.2 Technique segment analysis 2018 - 2022
- Historic Market Size - Technique Segment 2018 - 2022 ($ million)
- 4.3 End-user segment analysis 2018 - 2022
- Historic Market Size - End-user Segment 2018 - 2022 ($ million)
- 4.4 Geography segment analysis 2018 - 2022
- Historic Market Size - Geography Segment 2018 - 2022 ($ million)
- 4.5 Country segment analysis 2018 - 2022
- Historic Market Size - Country Segment 2018 - 2022 ($ million)
5 Five Forces Analysis
- 5.1 Five forces summary
- Five forces analysis - Comparison between 2023 and 2028
- 5.2 Bargaining power of buyers
- Bargaining power of buyers - Impact of key factors 2023 and 2028
- 5.3 Bargaining power of suppliers
- Bargaining power of suppliers - Impact of key factors in 2023 and 2028
- 5.4 Threat of new entrants
- Threat of new entrants - Impact of key factors in 2023 and 2028
- 5.5 Threat of substitutes
- Threat of substitutes - Impact of key factors in 2023 and 2028
- 5.6 Threat of rivalry
- Threat of rivalry - Impact of key factors in 2023 and 2028
- 5.7 Market condition
- Chart on Market condition - Five forces 2023 and 2028
6 Market Segmentation by Technique
- 6.1 Market segments
- Chart on Technique - Market share 2023-2028 (%)
- Data Table on Technique - Market share 2023-2028 (%)
- 6.2 Comparison by Technique
- Chart on Comparison by Technique
- Data Table on Comparison by Technique
- 6.3 Sandwich assays - Market size and forecast 2023-2028
- Chart on Sandwich assays - Market size and forecast 2023-2028 ($ million)
- Data Table on Sandwich assays - Market size and forecast 2023-2028 ($ million)
- Chart on Sandwich assays - Year-over-year growth 2023-2028 (%)
- Data Table on Sandwich assays - Year-over-year growth 2023-2028 (%)
- 6.4 Competitive assays - Market size and forecast 2023-2028
- Chart on Competitive assays - Market size and forecast 2023-2028 ($ million)
- Data Table on Competitive assays - Market size and forecast 2023-2028 ($ million)
- Chart on Competitive assays - Year-over-year growth 2023-2028 (%)
- Data Table on Competitive assays - Year-over-year growth 2023-2028 (%)
- 6.5 Multiplex detection assays - Market size and forecast 2023-2028
- Chart on Multiplex detection assays - Market size and forecast 2023-2028 ($ million)
- Data Table on Multiplex detection assays - Market size and forecast 2023-2028 ($ million)
- Chart on Multiplex detection assays - Year-over-year growth 2023-2028 (%)
- Data Table on Multiplex detection assays - Year-over-year growth 2023-2028 (%)
- 6.6 Market opportunity by Technique
- Market opportunity by Technique ($ million)
- Data Table on Market opportunity by Technique ($ million)
7 Market Segmentation by End-user
- 7.1 Market segments
- Chart on End-user - Market share 2023-2028 (%)
- Data Table on End-user - Market share 2023-2028 (%)
- 7.2 Comparison by End-user
- Chart on Comparison by End-user
- Data Table on Comparison by End-user
- 7.3 Medical device manufacturing companies - Market size and forecast 2023-2028
- Chart on Medical device manufacturing companies - Market size and forecast 2023-2028 ($ million)
- Data Table on Medical device manufacturing companies - Market size and forecast 2023-2028 ($ million)
- Chart on Medical device manufacturing companies - Year-over-year growth 2023-2028 (%)
- Data Table on Medical device manufacturing companies - Year-over-year growth 2023-2028 (%)
- 7.4 Medical device contract manufacturing companies - Market size and forecast 2023-2028
- Chart on Medical device contract manufacturing companies - Market size and forecast 2023-2028 ($ million)
- Data Table on Medical device contract manufacturing companies - Market size and forecast 2023-2028 ($ million)
- Chart on Medical device contract manufacturing companies - Year-over-year growth 2023-2028 (%)
- Data Table on Medical device contract manufacturing companies - Year-over-year growth 2023-2028 (%)
- 7.5 Market opportunity by End-user
- Market opportunity by End-user ($ million)
- Data Table on Market opportunity by End-user ($ million)
8 Customer Landscape
- 8.1 Customer landscape overview
- Analysis of price sensitivity, lifecycle, customer purchase basket, adoption rates, and purchase criteria
9 Geographic Landscape
- 9.1 Geographic segmentation
- Chart on Market share By Geographical Landscape 2023-2028 (%)
- Data Table on Market share By Geographical Landscape 2023-2028 (%)
- 9.2 Geographic comparison
- Chart on Geographic comparison
- Data Table on Geographic comparison
- 9.3 North America - Market size and forecast 2023-2028
- Chart on North America - Market size and forecast 2023-2028 ($ million)
- Data Table on North America - Market size and forecast 2023-2028 ($ million)
- Chart on North America - Year-over-year growth 2023-2028 (%)
- Data Table on North America - Year-over-year growth 2023-2028 (%)
- 9.4 Europe - Market size and forecast 2023-2028
- Chart on Europe - Market size and forecast 2023-2028 ($ million)
- Data Table on Europe - Market size and forecast 2023-2028 ($ million)
- Chart on Europe - Year-over-year growth 2023-2028 (%)
- Data Table on Europe - Year-over-year growth 2023-2028 (%)
- 9.5 Asia - Market size and forecast 2023-2028
- Chart on Asia - Market size and forecast 2023-2028 ($ million)
- Data Table on Asia - Market size and forecast 2023-2028 ($ million)
- Chart on Asia - Year-over-year growth 2023-2028 (%)
- Data Table on Asia - Year-over-year growth 2023-2028 (%)
- 9.6 Rest of World (ROW) - Market size and forecast 2023-2028
- Chart on Rest of World (ROW) - Market size and forecast 2023-2028 ($ million)
- Data Table on Rest of World (ROW) - Market size and forecast 2023-2028 ($ million)
- Chart on Rest of World (ROW) - Year-over-year growth 2023-2028 (%)
- Data Table on Rest of World (ROW) - Year-over-year growth 2023-2028 (%)
- 9.7 US - Market size and forecast 2023-2028
- Chart on US - Market size and forecast 2023-2028 ($ million)
- Data Table on US - Market size and forecast 2023-2028 ($ million)
- Chart on US - Year-over-year growth 2023-2028 (%)
- Data Table on US - Year-over-year growth 2023-2028 (%)
- 9.8 Germany - Market size and forecast 2023-2028
- Chart on Germany - Market size and forecast 2023-2028 ($ million)
- Data Table on Germany - Market size and forecast 2023-2028 ($ million)
- Chart on Germany - Year-over-year growth 2023-2028 (%)
- Data Table on Germany - Year-over-year growth 2023-2028 (%)
- 9.9 UK - Market size and forecast 2023-2028
- Chart on UK - Market size and forecast 2023-2028 ($ million)
- Data Table on UK - Market size and forecast 2023-2028 ($ million)
- Chart on UK - Year-over-year growth 2023-2028 (%)
- Data Table on UK - Year-over-year growth 2023-2028 (%)
- 9.10 China - Market size and forecast 2023-2028
- Chart on China - Market size and forecast 2023-2028 ($ million)
- Data Table on China - Market size and forecast 2023-2028 ($ million)
- Chart on China - Year-over-year growth 2023-2028 (%)
- Data Table on China - Year-over-year growth 2023-2028 (%)
- 9.11 Canada - Market size and forecast 2023-2028
- Chart on Canada - Market size and forecast 2023-2028 ($ million)
- Data Table on Canada - Market size and forecast 2023-2028 ($ million)
- Chart on Canada - Year-over-year growth 2023-2028 (%)
- Data Table on Canada - Year-over-year growth 2023-2028 (%)
- 9.12 Market opportunity By Geographical Landscape
- Market opportunity By Geographical Landscape ($ million)
- Data Tables on Market opportunity By Geographical Landscape ($ million)
10 Drivers, Challenges, and Opportunity/Restraints
- 10.1 Market drivers
- 10.2 Market challenges
- 10.3 Impact of drivers and challenges
- Impact of drivers and challenges in 2023 and 2028
- 10.4 Market opportunities/restraints
11 Competitive Landscape
- 11.1 Overview
- 11.2 Competitive Landscape
- Overview on criticality of inputs and factors of differentiation
- 11.3 Landscape disruption
- Overview on factors of disruption
- 11.4 Industry risks
- Impact of key risks on business
12 Competitive Analysis
- 12.1 Companies profiled
- Companies covered
- 12.2 Market positioning of companies
- Matrix on companies position and classification
- 12.3 Abbott Laboratories
- Abbott Laboratories - Overview
- Abbott Laboratories - Business segments
- Abbott Laboratories - Key news
- Abbott Laboratories - Key offerings
- Abbott Laboratories - Segment focus
- 12.4 Ahlstrom Holding 3 Oy
- Ahlstrom Holding 3 Oy - Overview
- Ahlstrom Holding 3 Oy - Product / Service
- Ahlstrom Holding 3 Oy - Key news
- Ahlstrom Holding 3 Oy - Key offerings
- 12.5 Becton Dickinson and Co.
- Becton Dickinson and Co. - Overview
- Becton Dickinson and Co. - Business segments
- Becton Dickinson and Co. - Key news
- Becton Dickinson and Co. - Key offerings
- Becton Dickinson and Co. - Segment focus
- 12.6 Bio Rad Laboratories Inc.
- Bio Rad Laboratories Inc. - Overview
- Bio Rad Laboratories Inc. - Business segments
- Bio Rad Laboratories Inc. - Key news
- Bio Rad Laboratories Inc. - Key offerings
- Bio Rad Laboratories Inc. - Segment focus
- 12.7 Bio Techne Corp.
- Bio Techne Corp. - Overview
- Bio Techne Corp. - Business segments
- Bio Techne Corp. - Key news
- Bio Techne Corp. - Key offerings
- Bio Techne Corp. - Segment focus
- 12.8 F. Hoffmann La Roche Ltd.
- F. Hoffmann La Roche Ltd. - Overview
- F. Hoffmann La Roche Ltd. - Business segments
- F. Hoffmann La Roche Ltd. - Key news
- F. Hoffmann La Roche Ltd. - Key offerings
- F. Hoffmann La Roche Ltd. - Segment focus
- 12.9 Geno Technology Inc.
- Geno Technology Inc. - Overview
- Geno Technology Inc. - Product / Service
- Geno Technology Inc. - Key offerings
- 12.10 Hologic Inc.
- Hologic Inc. - Overview
- Hologic Inc. - Business segments
- Hologic Inc. - Key news
- Hologic Inc. - Key offerings
- Hologic Inc. - Segment focus
- 12.11 Merck KGaA
- Merck KGaA - Overview
- Merck KGaA - Business segments
- Merck KGaA - Key news
- Merck KGaA - Key offerings
- Merck KGaA - Segment focus
- 12.12 Perkin Elmer Inc.
- Perkin Elmer Inc. - Overview
- Perkin Elmer Inc. - Business segments
- Perkin Elmer Inc. - Key news
- Perkin Elmer Inc. - Key offerings
- Perkin Elmer Inc. - Segment focus
- 12.13 QIAGEN NV
- QIAGEN NV - Overview
- QIAGEN NV - Product / Service
- QIAGEN NV - Key news
- QIAGEN NV - Key offerings
- 12.14 Quidelortho Corp.
- Quidelortho Corp. - Overview
- Quidelortho Corp. - Product / Service
- Quidelortho Corp. - Key news
- Quidelortho Corp. - Key offerings
- 12.15 Sartorius AG
- Sartorius AG - Overview
- Sartorius AG - Business segments
- Sartorius AG - Key news
- Sartorius AG - Key offerings
- Sartorius AG - Segment focus
- 12.16 Siemens AG
- Siemens AG - Overview
- Siemens AG - Business segments
- Siemens AG - Key news
- Siemens AG - Key offerings
- Siemens AG - Segment focus
- 12.17 Thermo Fisher Scientific Inc.
- Thermo Fisher Scientific Inc. - Overview
- Thermo Fisher Scientific Inc. - Business segments
- Thermo Fisher Scientific Inc. - Key news
- Thermo Fisher Scientific Inc. - Key offerings
- Thermo Fisher Scientific Inc. - Segment focus
13 Appendix
- 13.1 Scope of the report
- 13.2 Inclusions and exclusions checklist
- Inclusions checklist
- Exclusions checklist
- 13.3 Currency conversion rates for US$
- Currency conversion rates for US$
- 13.4 Research methodology
- Research methodology
- 13.5 Data procurement
- Information sources
- 13.6 Data validation
- Data validation
- 13.7 Validation techniques employed for market sizing
- Validation techniques employed for market sizing
- 13.8 Data synthesis
- Data synthesis
- 13.9 360 degree market analysis
- 360 degree market analysis
- 13.10 List of abbreviations
- List of abbreviations

