|
|
市場調査レポート
商品コード
1769480
大動脈ステントグラフトの世界市場 2025年~2029年Global Aortic Stent Grafts Market 2025-2029 |
||||||

|
|||||||
カスタマイズ可能
|
|||||||


| 大動脈ステントグラフトの世界市場 2025年~2029年 |
|
出版日: 2025年07月05日
発行: TechNavio
ページ情報: 英文 211 Pages
納期: 即納可能
|

全表示
- 概要
- 図表
- 目次
大動脈ステントグラフト市場は2024年~2029年に7億1,110万米ドル、予測期間中のCAGRは4.6%で成長すると予測されます。
当レポートでは、大動脈ステントグラフト市場の全体的な分析、市場規模・予測、動向、成長促進要因、課題、約25のベンダーを網羅したベンダー分析などを掲載しています。
現在の市場シナリオ、最新動向と促進要因、市場環境全体に関する最新分析を提供しています。市場は、血管内手術の急増、市場拡大を促すヘルスケア支出の増加、大動脈瘤の罹患率の上昇が牽引しています。
| 市場範囲 | |
|---|---|
| 基準年 | 2025年 |
| 終了年 | 2029年 |
| 予測期間 | 2025年~2029年 |
| 成長モメンタム | 加速 |
| 前年比 | 4.4% |
| CAGR | 4.6% |
| 増分額 | 7億1,110万米ドル |
本調査は、業界の主要参加者からのインプットを含め、一次情報と二次情報を客観的に組み合わせて実施しました。レポートには、主要企業の分析に加え、包括的な市場規模データ、地域別分析によるセグメント、ベンダー情勢が含まれています。レポートには過去データと予測データがあります。
本調査では、今後数年間の大動脈ステントグラフト市場の成長を促進する主な要因の一つとして、大動脈ステントグラフト業界の開発を挙げています。また、大動脈ステントグラフトの技術進歩、遠隔医療や遠隔患者モニタリングの成長は、市場の大きな需要につながるでしょう。
目次
第1章 エグゼクティブサマリー
- 市場概要
第2章 Technavio分析
- 価格・ライフサイクル・顧客購入バスケット・採用率・購入基準の分析
- インプットの重要性と差別化の要因
- 混乱の要因
- 促進要因と課題の影響
第3章 市場情勢
- 市場エコシステム
- 市場の特徴
- バリューチェーン分析
第4章 市場規模
- 市場の定義
- 市場セグメント分析
- 市場規模 2024年
- 市場の見通し 2024年~2029年
第5章 市場規模実績
- 大動脈ステントグラフトの世界市場 2019年~2023年
- 製品別セグメント分析 2019年~2023年
- エンドユーザー別セグメント分析 2019年~2023年
- 材料別セグメント分析 2019年~2023年
- 地域別セグメント分析 2019年~2023年
- 国別セグメント分析 2019年~2023年
第6章 定性分析
- AIの影響:大動脈ステントグラフトの世界市場
第7章 ファイブフォース分析
- ファイブフォースの要約
- 買い手の交渉力
- 供給企業の交渉力
- 新規参入業者の脅威
- 代替品の脅威
- 競争の脅威
- 市況
第8章 市場セグメンテーション:製品別
- 市場セグメント
- 比較:製品別
- AAA:市場規模と予測 2024年~2029年
- TAA:市場規模と予測 2024年~2029年
- 市場機会:製品別
第9章 市場セグメンテーション:エンドユーザー別
- 市場セグメント
- 比較:エンドユーザー別
- 病院:市場規模と予測 2024年~2029年
- 外来手術センター:市場規模と予測 2024年~2029年
- 市場機会:エンドユーザー別
第10章 市場セグメンテーション:素材別
- 市場セグメント
- 比較:素材別
- 合成素材:市場規模と予測 2024年~2029年
- 同種移植素材:市場規模と予測 2024年~2029年
- 市場機会:素材別
第11章 顧客情勢
- 顧客情勢の概要
第12章 地域別情勢
- 地域別セグメンテーション
- 地域別比較
- 北米:市場規模と予測 2024年~2029年
- 欧州:市場規模と予測 2024年~2029年
- アジア:市場規模と予測 2024年~2029年
- 世界のその他の地域:市場規模と予測 2024年~2029年
- 米国:市場規模と予測 2024年~2029年
- カナダ:市場規模と予測 2024年~2029年
- ドイツ:市場規模と予測 2024年~2029年
- 中国:市場規模と予測 2024年~2029年
- 英国:市場規模と予測 2024年~2029年
- フランス:市場規模と予測 2024年~2029年
- メキシコ:市場規模と予測 2024年~2029年
- イタリア:市場規模と予測 2024年~2029年
- インド:市場規模と予測 2024年~2029年
- ブラジル:市場規模と予測 2024年~2029年
- 市場機会:地域情勢別
第13章 促進要因・課題・機会・抑制要因
- 市場促進要因
- 市場の課題
- 促進要因と課題の影響
- 市場の機会・抑制要因
第14章 競合情勢
- 概要
- 競合情勢
- 混乱の状況
- 業界のリスク
第15章 競合分析
- 企業プロファイル
- 企業ランキング指数
- 企業の市場ポジショニング
- Artivion Inc.
- B.Braun SE
- Becton Dickinson and Co.
- Bentley InnoMed GmbH
- Braile Biomedica
- Cardinal Health Inc.
- Cook Group Inc.
- Endologix LLC
- Endospan Ltd.
- LeMaitre Vascular Inc.
- Lifetech Scientific Corp
- Medtronic Plc
- MicroPort Scientific Corp.
- Terumo Corp.
- W. L. Gore and Associates Inc.
第16章 付録
Exhibits:
- Exhibits1: Executive Summary - Chart on Market Overview
- Exhibits2: Executive Summary - Data Table on Market Overview
- Exhibits3: Executive Summary - Chart on Global Market Characteristics
- Exhibits4: Executive Summary - Chart on Market By Geographical Landscape
- Exhibits5: Executive Summary - Chart on Market Segmentation by Product
- Exhibits6: Executive Summary - Chart on Market Segmentation by End-user
- Exhibits7: Executive Summary - Chart on Market Segmentation by Material
- Exhibits8: Executive Summary - Chart on Incremental Growth
- Exhibits9: Executive Summary - Data Table on Incremental Growth
- Exhibits10: Executive Summary - Chart on Company Market Positioning
- Exhibits11: Analysis of price sensitivity, lifecycle, customer purchase basket, adoption rates, and purchase criteria
- Exhibits12: Overview on criticality of inputs and factors of differentiation
- Exhibits13: Overview on factors of disruption
- Exhibits14: Impact of drivers and challenges in 2024 and 2029
- Exhibits15: Parent Market
- Exhibits16: Data Table on - Parent Market
- Exhibits17: Market characteristics analysis
- Exhibits18: Value chain analysis
- Exhibits19: Offerings of companies included in the market definition
- Exhibits20: Market segments
- Exhibits21: Chart on Global - Market size and forecast 2024-2029 ($ million)
- Exhibits22: Data Table on Global - Market size and forecast 2024-2029 ($ million)
- Exhibits23: Chart on Global Market: Year-over-year growth 2024-2029 (%)
- Exhibits24: Data Table on Global Market: Year-over-year growth 2024-2029 (%)
- Exhibits25: Historic Market Size - Data Table on Global Aortic Stent Grafts Market 2019 - 2023 ($ million)
- Exhibits26: Historic Market Size - Product Segment 2019 - 2023 ($ million)
- Exhibits27: Historic Market Size - End-user Segment 2019 - 2023 ($ million)
- Exhibits28: Historic Market Size - Material Segment 2019 - 2023 ($ million)
- Exhibits29: Historic Market Size - Geography Segment 2019 - 2023 ($ million)
- Exhibits30: Historic Market Size - Country Segment 2019 - 2023 ($ million)
- Exhibits31: Five forces analysis - Comparison between 2024 and 2029
- Exhibits32: Bargaining power of buyers - Impact of key factors 2024 and 2029
- Exhibits33: Bargaining power of suppliers - Impact of key factors in 2024 and 2029
- Exhibits34: Threat of new entrants - Impact of key factors in 2024 and 2029
- Exhibits35: Threat of substitutes - Impact of key factors in 2024 and 2029
- Exhibits36: Threat of rivalry - Impact of key factors in 2024 and 2029
- Exhibits37: Chart on Market condition - Five forces 2024 and 2029
- Exhibits38: Chart on Product - Market share 2024-2029 (%)
- Exhibits39: Data Table on Product - Market share 2024-2029 (%)
- Exhibits40: Chart on Comparison by Product
- Exhibits41: Data Table on Comparison by Product
- Exhibits42: Chart on AAA - Market size and forecast 2024-2029 ($ million)
- Exhibits43: Data Table on AAA - Market size and forecast 2024-2029 ($ million)
- Exhibits44: Chart on AAA - Year-over-year growth 2024-2029 (%)
- Exhibits45: Data Table on AAA - Year-over-year growth 2024-2029 (%)
- Exhibits46: Chart on TAA - Market size and forecast 2024-2029 ($ million)
- Exhibits47: Data Table on TAA - Market size and forecast 2024-2029 ($ million)
- Exhibits48: Chart on TAA - Year-over-year growth 2024-2029 (%)
- Exhibits49: Data Table on TAA - Year-over-year growth 2024-2029 (%)
- Exhibits50: Market opportunity by Product ($ million)
- Exhibits51: Data Table on Market opportunity by Product ($ million)
- Exhibits52: Chart on End-user - Market share 2024-2029 (%)
- Exhibits53: Data Table on End-user - Market share 2024-2029 (%)
- Exhibits54: Chart on Comparison by End-user
- Exhibits55: Data Table on Comparison by End-user
- Exhibits56: Chart on Hospitals - Market size and forecast 2024-2029 ($ million)
- Exhibits57: Data Table on Hospitals - Market size and forecast 2024-2029 ($ million)
- Exhibits58: Chart on Hospitals - Year-over-year growth 2024-2029 (%)
- Exhibits59: Data Table on Hospitals - Year-over-year growth 2024-2029 (%)
- Exhibits60: Chart on Ambulatory surgical centers - Market size and forecast 2024-2029 ($ million)
- Exhibits61: Data Table on Ambulatory surgical centers - Market size and forecast 2024-2029 ($ million)
- Exhibits62: Chart on Ambulatory surgical centers - Year-over-year growth 2024-2029 (%)
- Exhibits63: Data Table on Ambulatory surgical centers - Year-over-year growth 2024-2029 (%)
- Exhibits64: Market opportunity by End-user ($ million)
- Exhibits65: Data Table on Market opportunity by End-user ($ million)
- Exhibits66: Chart on Material - Market share 2024-2029 (%)
- Exhibits67: Data Table on Material - Market share 2024-2029 (%)
- Exhibits68: Chart on Comparison by Material
- Exhibits69: Data Table on Comparison by Material
- Exhibits70: Chart on Synthetic materials - Market size and forecast 2024-2029 ($ million)
- Exhibits71: Data Table on Synthetic materials - Market size and forecast 2024-2029 ($ million)
- Exhibits72: Chart on Synthetic materials - Year-over-year growth 2024-2029 (%)
- Exhibits73: Data Table on Synthetic materials - Year-over-year growth 2024-2029 (%)
- Exhibits74: Chart on Allograft materials - Market size and forecast 2024-2029 ($ million)
- Exhibits75: Data Table on Allograft materials - Market size and forecast 2024-2029 ($ million)
- Exhibits76: Chart on Allograft materials - Year-over-year growth 2024-2029 (%)
- Exhibits77: Data Table on Allograft materials - Year-over-year growth 2024-2029 (%)
- Exhibits78: Market opportunity by Material ($ million)
- Exhibits79: Data Table on Market opportunity by Material ($ million)
- Exhibits80: Analysis of price sensitivity, lifecycle, customer purchase basket, adoption rates, and purchase criteria
- Exhibits81: Chart on Market share By Geographical Landscape 2024-2029 (%)
- Exhibits82: Data Table on Market share By Geographical Landscape 2024-2029 (%)
- Exhibits83: Chart on Geographic comparison
- Exhibits84: Data Table on Geographic comparison
- Exhibits85: Chart on North America - Market size and forecast 2024-2029 ($ million)
- Exhibits86: Data Table on North America - Market size and forecast 2024-2029 ($ million)
- Exhibits87: Chart on North America - Year-over-year growth 2024-2029 (%)
- Exhibits88: Data Table on North America - Year-over-year growth 2024-2029 (%)
- Exhibits89: Chart on Europe - Market size and forecast 2024-2029 ($ million)
- Exhibits90: Data Table on Europe - Market size and forecast 2024-2029 ($ million)
- Exhibits91: Chart on Europe - Year-over-year growth 2024-2029 (%)
- Exhibits92: Data Table on Europe - Year-over-year growth 2024-2029 (%)
- Exhibits93: Chart on Asia - Market size and forecast 2024-2029 ($ million)
- Exhibits94: Data Table on Asia - Market size and forecast 2024-2029 ($ million)
- Exhibits95: Chart on Asia - Year-over-year growth 2024-2029 (%)
- Exhibits96: Data Table on Asia - Year-over-year growth 2024-2029 (%)
- Exhibits97: Chart on Rest of World (ROW) - Market size and forecast 2024-2029 ($ million)
- Exhibits98: Data Table on Rest of World (ROW) - Market size and forecast 2024-2029 ($ million)
- Exhibits99: Chart on Rest of World (ROW) - Year-over-year growth 2024-2029 (%)
- Exhibits100: Data Table on Rest of World (ROW) - Year-over-year growth 2024-2029 (%)
- Exhibits101: Chart on US - Market size and forecast 2024-2029 ($ million)
- Exhibits102: Data Table on US - Market size and forecast 2024-2029 ($ million)
- Exhibits103: Chart on US - Year-over-year growth 2024-2029 (%)
- Exhibits104: Data Table on US - Year-over-year growth 2024-2029 (%)
- Exhibits105: Chart on Canada - Market size and forecast 2024-2029 ($ million)
- Exhibits106: Data Table on Canada - Market size and forecast 2024-2029 ($ million)
- Exhibits107: Chart on Canada - Year-over-year growth 2024-2029 (%)
- Exhibits108: Data Table on Canada - Year-over-year growth 2024-2029 (%)
- Exhibits109: Chart on Germany - Market size and forecast 2024-2029 ($ million)
- Exhibits110: Data Table on Germany - Market size and forecast 2024-2029 ($ million)
- Exhibits111: Chart on Germany - Year-over-year growth 2024-2029 (%)
- Exhibits112: Data Table on Germany - Year-over-year growth 2024-2029 (%)
- Exhibits113: Chart on China - Market size and forecast 2024-2029 ($ million)
- Exhibits114: Data Table on China - Market size and forecast 2024-2029 ($ million)
- Exhibits115: Chart on China - Year-over-year growth 2024-2029 (%)
- Exhibits116: Data Table on China - Year-over-year growth 2024-2029 (%)
- Exhibits117: Chart on UK - Market size and forecast 2024-2029 ($ million)
- Exhibits118: Data Table on UK - Market size and forecast 2024-2029 ($ million)
- Exhibits119: Chart on UK - Year-over-year growth 2024-2029 (%)
- Exhibits120: Data Table on UK - Year-over-year growth 2024-2029 (%)
- Exhibits121: Chart on France - Market size and forecast 2024-2029 ($ million)
- Exhibits122: Data Table on France - Market size and forecast 2024-2029 ($ million)
- Exhibits123: Chart on France - Year-over-year growth 2024-2029 (%)
- Exhibits124: Data Table on France - Year-over-year growth 2024-2029 (%)
- Exhibits125: Chart on Mexico - Market size and forecast 2024-2029 ($ million)
- Exhibits126: Data Table on Mexico - Market size and forecast 2024-2029 ($ million)
- Exhibits127: Chart on Mexico - Year-over-year growth 2024-2029 (%)
- Exhibits128: Data Table on Mexico - Year-over-year growth 2024-2029 (%)
- Exhibits129: Chart on Italy - Market size and forecast 2024-2029 ($ million)
- Exhibits130: Data Table on Italy - Market size and forecast 2024-2029 ($ million)
- Exhibits131: Chart on Italy - Year-over-year growth 2024-2029 (%)
- Exhibits132: Data Table on Italy - Year-over-year growth 2024-2029 (%)
- Exhibits133: Chart on India - Market size and forecast 2024-2029 ($ million)
- Exhibits134: Data Table on India - Market size and forecast 2024-2029 ($ million)
- Exhibits135: Chart on India - Year-over-year growth 2024-2029 (%)
- Exhibits136: Data Table on India - Year-over-year growth 2024-2029 (%)
- Exhibits137: Chart on Brazil - Market size and forecast 2024-2029 ($ million)
- Exhibits138: Data Table on Brazil - Market size and forecast 2024-2029 ($ million)
- Exhibits139: Chart on Brazil - Year-over-year growth 2024-2029 (%)
- Exhibits140: Data Table on Brazil - Year-over-year growth 2024-2029 (%)
- Exhibits141: Market opportunity By Geographical Landscape ($ million)
- Exhibits142: Data Tables on Market opportunity By Geographical Landscape ($ million)
- Exhibits143: Impact of drivers and challenges in 2024 and 2029
- Exhibits144: Overview on criticality of inputs and factors of differentiation
- Exhibits145: Overview on factors of disruption
- Exhibits146: Impact of key risks on business
- Exhibits147: Companies covered
- Exhibits148: Company ranking index
- Exhibits149: Matrix on companies position and classification
- Exhibits150: Artivion Inc. - Overview
- Exhibits151: Artivion Inc. - Business segments
- Exhibits152: Artivion Inc. - Key offerings
- Exhibits153: Artivion Inc. - Segment focus
- Exhibits154: SWOT
- Exhibits155: B.Braun SE - Overview
- Exhibits156: B.Braun SE - Product / Service
- Exhibits157: B.Braun SE - Key news
- Exhibits158: B.Braun SE - Key offerings
- Exhibits159: SWOT
- Exhibits160: Becton Dickinson and Co. - Overview
- Exhibits161: Becton Dickinson and Co. - Business segments
- Exhibits162: Becton Dickinson and Co. - Key news
- Exhibits163: Becton Dickinson and Co. - Key offerings
- Exhibits164: Becton Dickinson and Co. - Segment focus
- Exhibits165: SWOT
- Exhibits166: Bentley InnoMed GmbH - Overview
- Exhibits167: Bentley InnoMed GmbH - Product / Service
- Exhibits168: Bentley InnoMed GmbH - Key offerings
- Exhibits169: SWOT
- Exhibits170: Braile Biomedica - Overview
- Exhibits171: Braile Biomedica - Product / Service
- Exhibits172: Braile Biomedica - Key offerings
- Exhibits173: SWOT
- Exhibits174: Cardinal Health Inc. - Overview
- Exhibits175: Cardinal Health Inc. - Business segments
- Exhibits176: Cardinal Health Inc. - Key news
- Exhibits177: Cardinal Health Inc. - Key offerings
- Exhibits178: Cardinal Health Inc. - Segment focus
- Exhibits179: SWOT
- Exhibits180: Cook Group Inc. - Overview
- Exhibits181: Cook Group Inc. - Product / Service
- Exhibits182: Cook Group Inc. - Key offerings
- Exhibits183: SWOT
- Exhibits184: Endologix LLC - Overview
- Exhibits185: Endologix LLC - Product / Service
- Exhibits186: Endologix LLC - Key news
- Exhibits187: Endologix LLC - Key offerings
- Exhibits188: SWOT
- Exhibits189: Endospan Ltd. - Overview
- Exhibits190: Endospan Ltd. - Product / Service
- Exhibits191: Endospan Ltd. - Key offerings
- Exhibits192: SWOT
- Exhibits193: LeMaitre Vascular Inc. - Overview
- Exhibits194: LeMaitre Vascular Inc. - Product / Service
- Exhibits195: LeMaitre Vascular Inc. - Key offerings
- Exhibits196: SWOT
- Exhibits197: Lifetech Scientific Corp - Overview
- Exhibits198: Lifetech Scientific Corp - Business segments
- Exhibits199: Lifetech Scientific Corp - Key offerings
- Exhibits200: Lifetech Scientific Corp - Segment focus
- Exhibits201: SWOT
- Exhibits202: Medtronic Plc - Overview
- Exhibits203: Medtronic Plc - Business segments
- Exhibits204: Medtronic Plc - Key news
- Exhibits205: Medtronic Plc - Key offerings
- Exhibits206: Medtronic Plc - Segment focus
- Exhibits207: SWOT
- Exhibits208: MicroPort Scientific Corp. - Overview
- Exhibits209: MicroPort Scientific Corp. - Business segments
- Exhibits210: MicroPort Scientific Corp. - Key news
- Exhibits211: MicroPort Scientific Corp. - Key offerings
- Exhibits212: MicroPort Scientific Corp. - Segment focus
- Exhibits213: SWOT
- Exhibits214: Terumo Corp. - Overview
- Exhibits215: Terumo Corp. - Business segments
- Exhibits216: Terumo Corp. - Key news
- Exhibits217: Terumo Corp. - Key offerings
- Exhibits218: Terumo Corp. - Segment focus
- Exhibits219: SWOT
- Exhibits220: W. L. Gore and Associates Inc. - Overview
- Exhibits221: W. L. Gore and Associates Inc. - Product / Service
- Exhibits222: W. L. Gore and Associates Inc. - Key news
- Exhibits223: W. L. Gore and Associates Inc. - Key offerings
- Exhibits224: SWOT
- Exhibits225: Inclusions checklist
- Exhibits226: Exclusions checklist
- Exhibits227: Currency conversion rates for US$
- Exhibits228: Research methodology
- Exhibits229: Information sources
- Exhibits230: Data validation
- Exhibits231: Validation techniques employed for market sizing
- Exhibits232: Data synthesis
- Exhibits233: 360 degree market analysis
- Exhibits234: List of abbreviations
The aortic stent grafts market is forecasted to grow by USD 711.1 mn during 2024-2029, accelerating at a CAGR of 4.6% during the forecast period. The report on the aortic stent grafts market provides a holistic analysis, market size and forecast, trends, growth drivers, and challenges, as well as vendor analysis covering around 25 vendors.
The report offers an up-to-date analysis regarding the current market scenario, the latest trends and drivers, and the overall market environment. The market is driven by surge in endovascular surgeries, increase in healthcare expenditure to encourage market expansion, and rising incidence of aortic aneurysms.
| Market Scope | |
|---|---|
| Base Year | 2025 |
| End Year | 2029 |
| Series Year | 2025-2029 |
| Growth Momentum | Accelerate |
| YOY 2025 | 4.4% |
| CAGR | 4.6% |
| Incremental Value | $711.1 mn |
The study was conducted using an objective combination of primary and secondary information including inputs from key participants in the industry. The report contains a comprehensive market size data, segment with regional analysis and vendor landscape in addition to an analysis of the key companies. Reports have historic and forecast data.
Technavio's aortic stent grafts market is segmented as below:
By Product
- AAA
- TAA
By End-user
- Hospitals
- Ambulatory surgical centers
By Material
- Synthetic materials
- Allograft materials
By Geographical Landscape
- North America
- Europe
- Asia
- Rest of World (ROW)
This study identifies the developments in aortic stent grafts industry as one of the prime reasons driving the aortic stent grafts market growth during the next few years. Also, technological advances in aortic stent grafts and growth of telemedicine and remote patient monitoring will lead to sizable demand in the market.
The report on the aortic stent grafts market covers the following areas:
- Aortic Stent Grafts Market sizing
- Aortic Stent Grafts Market forecast
- Aortic Stent Grafts Market industry analysis
The robust vendor analysis is designed to help clients improve their market position, and in line with this, this report provides a detailed analysis of several leading aortic stent grafts market vendors that include Artivion Inc., B.Braun SE, Becton Dickinson and Co., Bentley InnoMed GmbH, Braile Biomedica, Cardinal Health Inc., Cook Group Inc., Corcym Srl, Edwards Lifesciences Corp., Endologix LLC, Endospan Ltd., InSitu Technologies Inc., LeMaitre Vascular Inc., Lifetech Scientific Corp, Medtronic Plc, Merit Medical Systems Inc., MicroPort Scientific Corp., Terumo Corp., and W. L. Gore and Associates Inc.. Also, the aortic stent grafts market analysis report includes information on upcoming trends and challenges that will influence market growth. This is to help companies strategize and leverage all forthcoming growth opportunities.
The publisher presents a detailed picture of the market by the way of study, synthesis, and summation of data from multiple sources by an analysis of key parameters such as profit, pricing, competition, and promotions. It presents various market facets by identifying the key industry influencers. The data presented is comprehensive, reliable, and a result of extensive primary and secondary research. The market research reports provide a complete competitive landscape and an in-depth vendor selection methodology and analysis using qualitative and quantitative research to forecast accurate market growth.
Table of Contents
1 Executive Summary
- 1.1 Market overview
- Executive Summary - Chart on Market Overview
- Executive Summary - Data Table on Market Overview
- Executive Summary - Chart on Global Market Characteristics
- Executive Summary - Chart on Market By Geographical Landscape
- Executive Summary - Chart on Market Segmentation by Product
- Executive Summary - Chart on Market Segmentation by End-user
- Executive Summary - Chart on Market Segmentation by Material
- Executive Summary - Chart on Incremental Growth
- Executive Summary - Data Table on Incremental Growth
- Executive Summary - Chart on Company Market Positioning
2 Technavio Analysis
- 2.1 Analysis of price sensitivity, lifecycle, customer purchase basket, adoption rates, and purchase criteria
- Analysis of price sensitivity, lifecycle, customer purchase basket, adoption rates, and purchase criteria
- 2.2 Criticality of inputs and Factors of differentiation
- Overview on criticality of inputs and factors of differentiation
- 2.3 Factors of disruption
- Overview on factors of disruption
- 2.4 Impact of drivers and challenges
- Impact of drivers and challenges in 2024 and 2029
3 Market Landscape
- 3.1 Market ecosystem
- Parent Market
- Data Table on - Parent Market
- 3.2 Market characteristics
- Market characteristics analysis
- 3.3 Value chain analysis
- Value chain analysis
4 Market Sizing
- 4.1 Market definition
- Offerings of companies included in the market definition
- 4.2 Market segment analysis
- Market segments
- 4.3 Market size 2024
- 4.4 Market outlook: Forecast for 2024-2029
- Chart on Global - Market size and forecast 2024-2029 ($ million)
- Data Table on Global - Market size and forecast 2024-2029 ($ million)
- Chart on Global Market: Year-over-year growth 2024-2029 (%)
- Data Table on Global Market: Year-over-year growth 2024-2029 (%)
5 Historic Market Size
- 5.1 Global Aortic Stent Grafts Market 2019 - 2023
- Historic Market Size - Data Table on Global Aortic Stent Grafts Market 2019 - 2023 ($ million)
- 5.2 Product segment analysis 2019 - 2023
- Historic Market Size - Product Segment 2019 - 2023 ($ million)
- 5.3 End-user segment analysis 2019 - 2023
- Historic Market Size - End-user Segment 2019 - 2023 ($ million)
- 5.4 Material segment analysis 2019 - 2023
- Historic Market Size - Material Segment 2019 - 2023 ($ million)
- 5.5 Geography segment analysis 2019 - 2023
- Historic Market Size - Geography Segment 2019 - 2023 ($ million)
- 5.6 Country segment analysis 2019 - 2023
- Historic Market Size - Country Segment 2019 - 2023 ($ million)
6 Qualitative Analysis
- 6.1 The AI impact on Global Aortic Stent Grafts Market
7 Five Forces Analysis
- 7.1 Five forces summary
- Five forces analysis - Comparison between 2024 and 2029
- 7.2 Bargaining power of buyers
- Bargaining power of buyers - Impact of key factors 2024 and 2029
- 7.3 Bargaining power of suppliers
- Bargaining power of suppliers - Impact of key factors in 2024 and 2029
- 7.4 Threat of new entrants
- Threat of new entrants - Impact of key factors in 2024 and 2029
- 7.5 Threat of substitutes
- Threat of substitutes - Impact of key factors in 2024 and 2029
- 7.6 Threat of rivalry
- Threat of rivalry - Impact of key factors in 2024 and 2029
- 7.7 Market condition
- Chart on Market condition - Five forces 2024 and 2029
8 Market Segmentation by Product
- 8.1 Market segments
- Chart on Product - Market share 2024-2029 (%)
- Data Table on Product - Market share 2024-2029 (%)
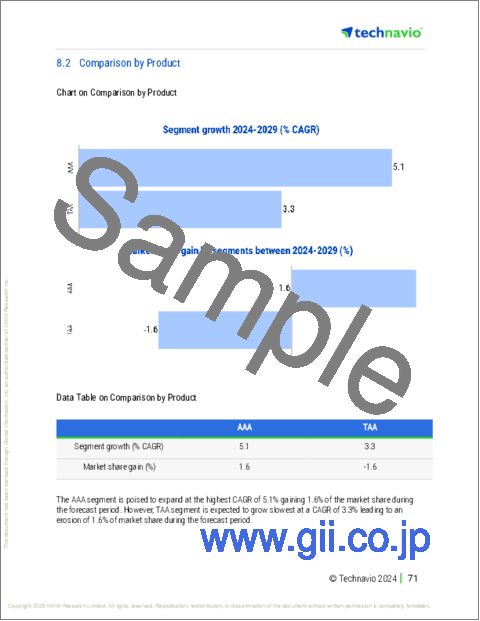
- 8.2 Comparison by Product
- Chart on Comparison by Product
- Data Table on Comparison by Product
- 8.3 AAA - Market size and forecast 2024-2029
- Chart on AAA - Market size and forecast 2024-2029 ($ million)
- Data Table on AAA - Market size and forecast 2024-2029 ($ million)
- Chart on AAA - Year-over-year growth 2024-2029 (%)
- Data Table on AAA - Year-over-year growth 2024-2029 (%)
- 8.4 TAA - Market size and forecast 2024-2029
- Chart on TAA - Market size and forecast 2024-2029 ($ million)
- Data Table on TAA - Market size and forecast 2024-2029 ($ million)
- Chart on TAA - Year-over-year growth 2024-2029 (%)
- Data Table on TAA - Year-over-year growth 2024-2029 (%)
- 8.5 Market opportunity by Product
- Market opportunity by Product ($ million)
- Data Table on Market opportunity by Product ($ million)
9 Market Segmentation by End-user
- 9.1 Market segments
- Chart on End-user - Market share 2024-2029 (%)
- Data Table on End-user - Market share 2024-2029 (%)
- 9.2 Comparison by End-user
- Chart on Comparison by End-user
- Data Table on Comparison by End-user
- 9.3 Hospitals - Market size and forecast 2024-2029
- Chart on Hospitals - Market size and forecast 2024-2029 ($ million)
- Data Table on Hospitals - Market size and forecast 2024-2029 ($ million)
- Chart on Hospitals - Year-over-year growth 2024-2029 (%)
- Data Table on Hospitals - Year-over-year growth 2024-2029 (%)
- 9.4 Ambulatory surgical centers - Market size and forecast 2024-2029
- Chart on Ambulatory surgical centers - Market size and forecast 2024-2029 ($ million)
- Data Table on Ambulatory surgical centers - Market size and forecast 2024-2029 ($ million)
- Chart on Ambulatory surgical centers - Year-over-year growth 2024-2029 (%)
- Data Table on Ambulatory surgical centers - Year-over-year growth 2024-2029 (%)
- 9.5 Market opportunity by End-user
- Market opportunity by End-user ($ million)
- Data Table on Market opportunity by End-user ($ million)
10 Market Segmentation by Material
- 10.1 Market segments
- Chart on Material - Market share 2024-2029 (%)
- Data Table on Material - Market share 2024-2029 (%)
- 10.2 Comparison by Material
- Chart on Comparison by Material
- Data Table on Comparison by Material
- 10.3 Synthetic materials - Market size and forecast 2024-2029
- Chart on Synthetic materials - Market size and forecast 2024-2029 ($ million)
- Data Table on Synthetic materials - Market size and forecast 2024-2029 ($ million)
- Chart on Synthetic materials - Year-over-year growth 2024-2029 (%)
- Data Table on Synthetic materials - Year-over-year growth 2024-2029 (%)
- 10.4 Allograft materials - Market size and forecast 2024-2029
- Chart on Allograft materials - Market size and forecast 2024-2029 ($ million)
- Data Table on Allograft materials - Market size and forecast 2024-2029 ($ million)
- Chart on Allograft materials - Year-over-year growth 2024-2029 (%)
- Data Table on Allograft materials - Year-over-year growth 2024-2029 (%)
- 10.5 Market opportunity by Material
- Market opportunity by Material ($ million)
- Data Table on Market opportunity by Material ($ million)
11 Customer Landscape
- 11.1 Customer landscape overview
- Analysis of price sensitivity, lifecycle, customer purchase basket, adoption rates, and purchase criteria
12 Geographic Landscape
- 12.1 Geographic segmentation
- Chart on Market share By Geographical Landscape 2024-2029 (%)
- Data Table on Market share By Geographical Landscape 2024-2029 (%)
- 12.2 Geographic comparison
- Chart on Geographic comparison
- Data Table on Geographic comparison
- 12.3 North America - Market size and forecast 2024-2029
- Chart on North America - Market size and forecast 2024-2029 ($ million)
- Data Table on North America - Market size and forecast 2024-2029 ($ million)
- Chart on North America - Year-over-year growth 2024-2029 (%)
- Data Table on North America - Year-over-year growth 2024-2029 (%)
- 12.4 Europe - Market size and forecast 2024-2029
- Chart on Europe - Market size and forecast 2024-2029 ($ million)
- Data Table on Europe - Market size and forecast 2024-2029 ($ million)
- Chart on Europe - Year-over-year growth 2024-2029 (%)
- Data Table on Europe - Year-over-year growth 2024-2029 (%)
- 12.5 Asia - Market size and forecast 2024-2029
- Chart on Asia - Market size and forecast 2024-2029 ($ million)
- Data Table on Asia - Market size and forecast 2024-2029 ($ million)
- Chart on Asia - Year-over-year growth 2024-2029 (%)
- Data Table on Asia - Year-over-year growth 2024-2029 (%)
- 12.6 Rest of World (ROW) - Market size and forecast 2024-2029
- Chart on Rest of World (ROW) - Market size and forecast 2024-2029 ($ million)
- Data Table on Rest of World (ROW) - Market size and forecast 2024-2029 ($ million)
- Chart on Rest of World (ROW) - Year-over-year growth 2024-2029 (%)
- Data Table on Rest of World (ROW) - Year-over-year growth 2024-2029 (%)
- 12.7 US - Market size and forecast 2024-2029
- Chart on US - Market size and forecast 2024-2029 ($ million)
- Data Table on US - Market size and forecast 2024-2029 ($ million)
- Chart on US - Year-over-year growth 2024-2029 (%)
- Data Table on US - Year-over-year growth 2024-2029 (%)
- 12.8 Canada - Market size and forecast 2024-2029
- Chart on Canada - Market size and forecast 2024-2029 ($ million)
- Data Table on Canada - Market size and forecast 2024-2029 ($ million)
- Chart on Canada - Year-over-year growth 2024-2029 (%)
- Data Table on Canada - Year-over-year growth 2024-2029 (%)
- 12.9 Germany - Market size and forecast 2024-2029
- Chart on Germany - Market size and forecast 2024-2029 ($ million)
- Data Table on Germany - Market size and forecast 2024-2029 ($ million)
- Chart on Germany - Year-over-year growth 2024-2029 (%)
- Data Table on Germany - Year-over-year growth 2024-2029 (%)
- 12.10 China - Market size and forecast 2024-2029
- Chart on China - Market size and forecast 2024-2029 ($ million)
- Data Table on China - Market size and forecast 2024-2029 ($ million)
- Chart on China - Year-over-year growth 2024-2029 (%)
- Data Table on China - Year-over-year growth 2024-2029 (%)
- 12.11 UK - Market size and forecast 2024-2029
- Chart on UK - Market size and forecast 2024-2029 ($ million)
- Data Table on UK - Market size and forecast 2024-2029 ($ million)
- Chart on UK - Year-over-year growth 2024-2029 (%)
- Data Table on UK - Year-over-year growth 2024-2029 (%)
- 12.12 France - Market size and forecast 2024-2029
- Chart on France - Market size and forecast 2024-2029 ($ million)
- Data Table on France - Market size and forecast 2024-2029 ($ million)
- Chart on France - Year-over-year growth 2024-2029 (%)
- Data Table on France - Year-over-year growth 2024-2029 (%)
- 12.13 Mexico - Market size and forecast 2024-2029
- Chart on Mexico - Market size and forecast 2024-2029 ($ million)
- Data Table on Mexico - Market size and forecast 2024-2029 ($ million)
- Chart on Mexico - Year-over-year growth 2024-2029 (%)
- Data Table on Mexico - Year-over-year growth 2024-2029 (%)
- 12.14 Italy - Market size and forecast 2024-2029
- Chart on Italy - Market size and forecast 2024-2029 ($ million)
- Data Table on Italy - Market size and forecast 2024-2029 ($ million)
- Chart on Italy - Year-over-year growth 2024-2029 (%)
- Data Table on Italy - Year-over-year growth 2024-2029 (%)
- 12.15 India - Market size and forecast 2024-2029
- Chart on India - Market size and forecast 2024-2029 ($ million)
- Data Table on India - Market size and forecast 2024-2029 ($ million)
- Chart on India - Year-over-year growth 2024-2029 (%)
- Data Table on India - Year-over-year growth 2024-2029 (%)
- 12.16 Brazil - Market size and forecast 2024-2029
- Chart on Brazil - Market size and forecast 2024-2029 ($ million)
- Data Table on Brazil - Market size and forecast 2024-2029 ($ million)
- Chart on Brazil - Year-over-year growth 2024-2029 (%)
- Data Table on Brazil - Year-over-year growth 2024-2029 (%)
- 12.17 Market opportunity By Geographical Landscape
- Market opportunity By Geographical Landscape ($ million)
- Data Tables on Market opportunity By Geographical Landscape ($ million)
13 Drivers, Challenges, and Opportunity/Restraints
- 13.1 Market drivers
- 13.2 Market challenges
- 13.3 Impact of drivers and challenges
- Impact of drivers and challenges in 2024 and 2029
- 13.4 Market opportunities/restraints
14 Competitive Landscape
- 14.1 Overview
- 14.2 Competitive Landscape
- Overview on criticality of inputs and factors of differentiation
- 14.3 Landscape disruption
- Overview on factors of disruption
- 14.4 Industry risks
- Impact of key risks on business
15 Competitive Analysis
- 15.1 Companies profiled
- Companies covered
- 15.2 Company ranking index
- Company ranking index
- 15.3 Market positioning of companies
- Matrix on companies position and classification
- 15.4 Artivion Inc.
- Artivion Inc. - Overview
- Artivion Inc. - Business segments
- Artivion Inc. - Key offerings
- Artivion Inc. - Segment focus
- SWOT
- 15.5 B.Braun SE
- B.Braun SE - Overview
- B.Braun SE - Product / Service
- B.Braun SE - Key news
- B.Braun SE - Key offerings
- SWOT
- 15.6 Becton Dickinson and Co.
- Becton Dickinson and Co. - Overview
- Becton Dickinson and Co. - Business segments
- Becton Dickinson and Co. - Key news
- Becton Dickinson and Co. - Key offerings
- Becton Dickinson and Co. - Segment focus
- SWOT
- 15.7 Bentley InnoMed GmbH
- Bentley InnoMed GmbH - Overview
- Bentley InnoMed GmbH - Product / Service
- Bentley InnoMed GmbH - Key offerings
- SWOT
- 15.8 Braile Biomedica
- Braile Biomedica - Overview
- Braile Biomedica - Product / Service
- Braile Biomedica - Key offerings
- SWOT
- 15.9 Cardinal Health Inc.
- Cardinal Health Inc. - Overview
- Cardinal Health Inc. - Business segments
- Cardinal Health Inc. - Key news
- Cardinal Health Inc. - Key offerings
- Cardinal Health Inc. - Segment focus
- SWOT
- 15.10 Cook Group Inc.
- Cook Group Inc. - Overview
- Cook Group Inc. - Product / Service
- Cook Group Inc. - Key offerings
- SWOT
- 15.11 Endologix LLC
- Endologix LLC - Overview
- Endologix LLC - Product / Service
- Endologix LLC - Key news
- Endologix LLC - Key offerings
- SWOT
- 15.12 Endospan Ltd.
- Endospan Ltd. - Overview
- Endospan Ltd. - Product / Service
- Endospan Ltd. - Key offerings
- SWOT
- 15.13 LeMaitre Vascular Inc.
- LeMaitre Vascular Inc. - Overview
- LeMaitre Vascular Inc. - Product / Service
- LeMaitre Vascular Inc. - Key offerings
- SWOT
- 15.14 Lifetech Scientific Corp
- Lifetech Scientific Corp - Overview
- Lifetech Scientific Corp - Business segments
- Lifetech Scientific Corp - Key offerings
- Lifetech Scientific Corp - Segment focus
- SWOT
- 15.15 Medtronic Plc
- Medtronic Plc - Overview
- Medtronic Plc - Business segments
- Medtronic Plc - Key news
- Medtronic Plc - Key offerings
- Medtronic Plc - Segment focus
- SWOT
- 15.16 MicroPort Scientific Corp.
- MicroPort Scientific Corp. - Overview
- MicroPort Scientific Corp. - Business segments
- MicroPort Scientific Corp. - Key news
- MicroPort Scientific Corp. - Key offerings
- MicroPort Scientific Corp. - Segment focus
- SWOT
- 15.17 Terumo Corp.
- Terumo Corp. - Overview
- Terumo Corp. - Business segments
- Terumo Corp. - Key news
- Terumo Corp. - Key offerings
- Terumo Corp. - Segment focus
- SWOT
- 15.18 W. L. Gore and Associates Inc.
- W. L. Gore and Associates Inc. - Overview
- W. L. Gore and Associates Inc. - Product / Service
- W. L. Gore and Associates Inc. - Key news
- W. L. Gore and Associates Inc. - Key offerings
- SWOT
16 Appendix
- 16.1 Scope of the report
- 16.2 Inclusions and exclusions checklist
- Inclusions checklist
- Exclusions checklist
- 16.3 Currency conversion rates for US$
- Currency conversion rates for US$
- 16.4 Research methodology
- Research methodology
- 16.5 Data procurement
- Information sources
- 16.6 Data validation
- Data validation
- 16.7 Validation techniques employed for market sizing
- Validation techniques employed for market sizing
- 16.8 Data synthesis
- Data synthesis
- 16.9 360 degree market analysis
- 360 degree market analysis
- 16.10 List of abbreviations
- List of abbreviations

