|
|
市場調査レポート
商品コード
1525108
オールテレーンクレーンの世界市場 2024-2028Global all-terrain crane market 2024-2028 |
||||||
|
|||||||
カスタマイズ可能
|
|||||||

| オールテレーンクレーンの世界市場 2024-2028 |
|
出版日: 2024年07月12日
発行: TechNavio
ページ情報: 英文 164 Pages
納期: 即納可能
|

全表示
- 概要
- 図表
- 目次
オールテレーンクレーン市場は2023-2028年に38億2,330万米ドル、予測期間中のCAGRは4.36%で成長すると予測されます。
当レポートでは、オールテレーンクレーン市場の全体的な分析、市場規模・予測、動向、成長促進要因、課題、約25のベンダーを網羅したベンダー分析などを掲載しています。
現在の市場シナリオ、最新動向と促進要因、市場環境全体に関する最新分析を提供しています。市場は、建設産業の成長、鉱業や電力資源産業からのオールテレーンクレーンの需要増加、公共事業分野からの需要増加が牽引しています。
| 市場範囲 | |
|---|---|
| 基準年 | 2024 |
| 終了年 | 2028 |
| 予測期間 | 2024-2028 |
| 成長モメンタム | 加速 |
| 前年比2024年 | 4.11% |
| CAGR | 4.36% |
| 増分額 | 38億2,330万米ドル |
本調査では、オールテレーンクレーンにおけるテレマティクスの普及が、今後数年間のオールテレーンクレーン市場成長を牽引する主要因の1つであると分析しています。また、安全性の重要性が高まり、オペレータトレーニングにVR(バーチャルリアリティ)技術が採用されることで、同市場には大きな需要が見込まれます。
目次
第1章 エグゼクティブサマリー
- 市場概要
第2章 市場情勢
- 市場エコシステム
- 市場の特徴
- バリューチェーン分析
第3章 市場規模の評価
- 市場の定義
- 市場セグメント分析
- 市場規模 2023
- 市場の見通し 2023-2028
第4章 市場規模実績
- 世界オールテレーンクレーン市場 2018-2022
- 容量別セグメント分析 2018-2022
- 用途別セグメント分析 2018-2022
- 地域別セグメント分析 2018-2022
- 国別セグメント分析 2018-2022
第5章 ファイブフォース分析
- ファイブフォースの要約
- 買い手の交渉力
- 供給企業の交渉力
- 新規参入業者の脅威
- 代替品の脅威
- 競争の脅威
- 市況
第6章 市場セグメンテーション:容量別
- 市場セグメンテーション
- 比較:容量別
- 200トン未満:市場規模と予測 2023-2028
- 200~500トン:市場規模と予測 2023-2028
- 500トン以上:市場規模と予測 2023-2028
- 市場機会:容量別
第7章 市場セグメンテーション:用途別
- 市場セグメンテーション
- 比較:用途別
- 建設:市場規模と予測 2023-2028
- 産業:市場規模と予測 2023-2028
- ユーティリティ:市場規模と予測 2023-2028
- 市場機会:用途別
第8章 顧客情勢
- 顧客情勢の概要
第9章 地域別情勢
- 地域別セグメンテーション
- 地域別比較
- アジア太平洋:市場規模と予測 2023-2028
- 欧州:市場規模と予測 2023-2028
- 北米:市場規模と予測 2023-2028
- 南米:市場規模と予測 2023-2028
- 中東・アフリカ:市場規模と予測 2023-2028
- 中国:市場規模と予測 2023-2028
- 日本:市場規模と予測 2023-2028
- 米国:市場規模と予測 2023-2028
- ドイツ:市場規模と予測 2023-2028
- フランス:市場規模と予測 2023-2028
- 市場機会:地域情勢別
第10章 促進要因・課題・機会・抑制要因
- 市場促進要因
- 市場の課題
- 促進要因と課題の影響
- 市場の機会・抑制要因
第11章 競合情勢
- 概要
- 競合情勢
- 混乱の状況
- 業界のリスク
第12章 競合分析
- 企業プロファイル
- 企業の市場ポジショニング
- Action Construction Equipment Ltd.
- Broderson Manufacturing Corp.
- Elliott Equipment Inc.
- FURUKAWA Co. Ltd.
- Guangxi Liugong Machinery Co. Ltd.
- Kobe Steel Ltd.
- Liebherr International AG
- Manitex Inc.
- Sany Group
- Sumitomo Heavy Industries Ltd.
- Tadano Ltd.
- Terex Corp.
- The Manitowoc Co. Inc.
- Xuzhou Construction Machinery Group Co. Ltd.
- Zoomlion Heavy Industry Science and Technology Co. Ltd.
第13章 付録
Exhibits:
- Exhibits1: Executive Summary - Chart on Market Overview
- Exhibits2: Executive Summary - Data Table on Market Overview
- Exhibits3: Executive Summary - Chart on Global Market Characteristics
- Exhibits4: Executive Summary - Chart on Market By Geographical Landscape
- Exhibits5: Executive Summary - Chart on Market Segmentation by Capacity
- Exhibits6: Executive Summary - Chart on Market Segmentation by Application
- Exhibits7: Executive Summary - Chart on Incremental Growth
- Exhibits8: Executive Summary - Data Table on Incremental Growth
- Exhibits9: Executive Summary - Chart on Company Market Positioning
- Exhibits10: Parent Market
- Exhibits11: Data Table on - Parent Market
- Exhibits12: Market characteristics analysis
- Exhibits13: Value Chain Analysis
- Exhibits14: Offerings of companies included in the market definition
- Exhibits15: Market segments
- Exhibits16: Chart on Global - Market size and forecast 2023-2028 ($ million)
- Exhibits17: Data Table on Global - Market size and forecast 2023-2028 ($ million)
- Exhibits18: Chart on Global Market: Year-over-year growth 2023-2028 (%)
- Exhibits19: Data Table on Global Market: Year-over-year growth 2023-2028 (%)
- Exhibits20: Historic Market Size - Data Table on Global All-Terrain Crane Market 2018 - 2022 ($ million)
- Exhibits21: Historic Market Size - Capacity Segment 2018 - 2022 ($ million)
- Exhibits22: Historic Market Size - Application Segment 2018 - 2022 ($ million)
- Exhibits23: Historic Market Size - Geography Segment 2018 - 2022 ($ million)
- Exhibits24: Historic Market Size - Country Segment 2018 - 2022 ($ million)
- Exhibits25: Five forces analysis - Comparison between 2023 and 2028
- Exhibits26: Bargaining power of buyers - Impact of key factors 2023 and 2028
- Exhibits27: Bargaining power of suppliers - Impact of key factors in 2023 and 2028
- Exhibits28: Threat of new entrants - Impact of key factors in 2023 and 2028
- Exhibits29: Threat of substitutes - Impact of key factors in 2023 and 2028
- Exhibits30: Threat of rivalry - Impact of key factors in 2023 and 2028
- Exhibits31: Chart on Market condition - Five forces 2023 and 2028
- Exhibits32: Chart on Capacity - Market share 2023-2028 (%)
- Exhibits33: Data Table on Capacity - Market share 2023-2028 (%)
- Exhibits34: Chart on Comparison by Capacity
- Exhibits35: Data Table on Comparison by Capacity
- Exhibits36: Chart on Less than 200 tons - Market size and forecast 2023-2028 ($ million)
- Exhibits37: Data Table on Less than 200 tons - Market size and forecast 2023-2028 ($ million)
- Exhibits38: Chart on Less than 200 tons - Year-over-year growth 2023-2028 (%)
- Exhibits39: Data Table on Less than 200 tons - Year-over-year growth 2023-2028 (%)
- Exhibits40: Chart on 200-500 tons - Market size and forecast 2023-2028 ($ million)
- Exhibits41: Data Table on 200-500 tons - Market size and forecast 2023-2028 ($ million)
- Exhibits42: Chart on 200-500 tons - Year-over-year growth 2023-2028 (%)
- Exhibits43: Data Table on 200-500 tons - Year-over-year growth 2023-2028 (%)
- Exhibits44: Chart on More than 500 tons - Market size and forecast 2023-2028 ($ million)
- Exhibits45: Data Table on More than 500 tons - Market size and forecast 2023-2028 ($ million)
- Exhibits46: Chart on More than 500 tons - Year-over-year growth 2023-2028 (%)
- Exhibits47: Data Table on More than 500 tons - Year-over-year growth 2023-2028 (%)
- Exhibits48: Market opportunity by Capacity ($ million)
- Exhibits49: Data Table on Market opportunity by Capacity ($ million)
- Exhibits50: Chart on Application - Market share 2023-2028 (%)
- Exhibits51: Data Table on Application - Market share 2023-2028 (%)
- Exhibits52: Chart on Comparison by Application
- Exhibits53: Data Table on Comparison by Application
- Exhibits54: Chart on Construction - Market size and forecast 2023-2028 ($ million)
- Exhibits55: Data Table on Construction - Market size and forecast 2023-2028 ($ million)
- Exhibits56: Chart on Construction - Year-over-year growth 2023-2028 (%)
- Exhibits57: Data Table on Construction - Year-over-year growth 2023-2028 (%)
- Exhibits58: Chart on Industrial - Market size and forecast 2023-2028 ($ million)
- Exhibits59: Data Table on Industrial - Market size and forecast 2023-2028 ($ million)
- Exhibits60: Chart on Industrial - Year-over-year growth 2023-2028 (%)
- Exhibits61: Data Table on Industrial - Year-over-year growth 2023-2028 (%)
- Exhibits62: Chart on Utilities - Market size and forecast 2023-2028 ($ million)
- Exhibits63: Data Table on Utilities - Market size and forecast 2023-2028 ($ million)
- Exhibits64: Chart on Utilities - Year-over-year growth 2023-2028 (%)
- Exhibits65: Data Table on Utilities - Year-over-year growth 2023-2028 (%)
- Exhibits66: Market opportunity by Application ($ million)
- Exhibits67: Data Table on Market opportunity by Application ($ million)
- Exhibits68: Analysis of price sensitivity, lifecycle, customer purchase basket, adoption rates, and purchase criteria
- Exhibits69: Chart on Market share By Geographical Landscape 2023-2028 (%)
- Exhibits70: Data Table on Market share By Geographical Landscape 2023-2028 (%)
- Exhibits71: Chart on Geographic comparison
- Exhibits72: Data Table on Geographic comparison
- Exhibits73: Chart on APAC - Market size and forecast 2023-2028 ($ million)
- Exhibits74: Data Table on APAC - Market size and forecast 2023-2028 ($ million)
- Exhibits75: Chart on APAC - Year-over-year growth 2023-2028 (%)
- Exhibits76: Data Table on APAC - Year-over-year growth 2023-2028 (%)
- Exhibits77: Chart on Europe - Market size and forecast 2023-2028 ($ million)
- Exhibits78: Data Table on Europe - Market size and forecast 2023-2028 ($ million)
- Exhibits79: Chart on Europe - Year-over-year growth 2023-2028 (%)
- Exhibits80: Data Table on Europe - Year-over-year growth 2023-2028 (%)
- Exhibits81: Chart on North America - Market size and forecast 2023-2028 ($ million)
- Exhibits82: Data Table on North America - Market size and forecast 2023-2028 ($ million)
- Exhibits83: Chart on North America - Year-over-year growth 2023-2028 (%)
- Exhibits84: Data Table on North America - Year-over-year growth 2023-2028 (%)
- Exhibits85: Chart on South America - Market size and forecast 2023-2028 ($ million)
- Exhibits86: Data Table on South America - Market size and forecast 2023-2028 ($ million)
- Exhibits87: Chart on South America - Year-over-year growth 2023-2028 (%)
- Exhibits88: Data Table on South America - Year-over-year growth 2023-2028 (%)
- Exhibits89: Chart on Middle East and Africa - Market size and forecast 2023-2028 ($ million)
- Exhibits90: Data Table on Middle East and Africa - Market size and forecast 2023-2028 ($ million)
- Exhibits91: Chart on Middle East and Africa - Year-over-year growth 2023-2028 (%)
- Exhibits92: Data Table on Middle East and Africa - Year-over-year growth 2023-2028 (%)
- Exhibits93: Chart on China - Market size and forecast 2023-2028 ($ million)
- Exhibits94: Data Table on China - Market size and forecast 2023-2028 ($ million)
- Exhibits95: Chart on China - Year-over-year growth 2023-2028 (%)
- Exhibits96: Data Table on China - Year-over-year growth 2023-2028 (%)
- Exhibits97: Chart on Japan - Market size and forecast 2023-2028 ($ million)
- Exhibits98: Data Table on Japan - Market size and forecast 2023-2028 ($ million)
- Exhibits99: Chart on Japan - Year-over-year growth 2023-2028 (%)
- Exhibits100: Data Table on Japan - Year-over-year growth 2023-2028 (%)
- Exhibits101: Chart on US - Market size and forecast 2023-2028 ($ million)
- Exhibits102: Data Table on US - Market size and forecast 2023-2028 ($ million)
- Exhibits103: Chart on US - Year-over-year growth 2023-2028 (%)
- Exhibits104: Data Table on US - Year-over-year growth 2023-2028 (%)
- Exhibits105: Chart on Germany - Market size and forecast 2023-2028 ($ million)
- Exhibits106: Data Table on Germany - Market size and forecast 2023-2028 ($ million)
- Exhibits107: Chart on Germany - Year-over-year growth 2023-2028 (%)
- Exhibits108: Data Table on Germany - Year-over-year growth 2023-2028 (%)
- Exhibits109: Chart on France - Market size and forecast 2023-2028 ($ million)
- Exhibits110: Data Table on France - Market size and forecast 2023-2028 ($ million)
- Exhibits111: Chart on France - Year-over-year growth 2023-2028 (%)
- Exhibits112: Data Table on France - Year-over-year growth 2023-2028 (%)
- Exhibits113: Market opportunity By Geographical Landscape ($ million)
- Exhibits114: Data Tables on Market opportunity By Geographical Landscape ($ million)
- Exhibits115: Impact of drivers and challenges in 2023 and 2028
- Exhibits116: Overview on criticality of inputs and factors of differentiation
- Exhibits117: Overview on factors of disruption
- Exhibits118: Impact of key risks on business
- Exhibits119: Companies covered
- Exhibits120: Matrix on companies position and classification
- Exhibits121: Action Construction Equipment Ltd. - Overview
- Exhibits122: Action Construction Equipment Ltd. - Business segments
- Exhibits123: Action Construction Equipment Ltd. - Key offerings
- Exhibits124: Action Construction Equipment Ltd. - Segment focus
- Exhibits125: Broderson Manufacturing Corp. - Overview
- Exhibits126: Broderson Manufacturing Corp. - Product / Service
- Exhibits127: Broderson Manufacturing Corp. - Key offerings
- Exhibits128: Elliott Equipment Inc. - Overview
- Exhibits129: Elliott Equipment Inc. - Product / Service
- Exhibits130: Elliott Equipment Inc. - Key offerings
- Exhibits131: FURUKAWA Co. Ltd. - Overview
- Exhibits132: FURUKAWA Co. Ltd. - Business segments
- Exhibits133: FURUKAWA Co. Ltd. - Key news
- Exhibits134: FURUKAWA Co. Ltd. - Key offerings
- Exhibits135: FURUKAWA Co. Ltd. - Segment focus
- Exhibits136: Guangxi Liugong Machinery Co. Ltd. - Overview
- Exhibits137: Guangxi Liugong Machinery Co. Ltd. - Product / Service
- Exhibits138: Guangxi Liugong Machinery Co. Ltd. - Key offerings
- Exhibits139: Kobe Steel Ltd. - Overview
- Exhibits140: Kobe Steel Ltd. - Business segments
- Exhibits141: Kobe Steel Ltd. - Key news
- Exhibits142: Kobe Steel Ltd. - Key offerings
- Exhibits143: Kobe Steel Ltd. - Segment focus
- Exhibits144: Liebherr International AG - Overview
- Exhibits145: Liebherr International AG - Product / Service
- Exhibits146: Liebherr International AG - Key news
- Exhibits147: Liebherr International AG - Key offerings
- Exhibits148: Manitex Inc. - Overview
- Exhibits149: Manitex Inc. - Product / Service
- Exhibits150: Manitex Inc. - Key offerings
- Exhibits151: Sany Group - Overview
- Exhibits152: Sany Group - Product / Service
- Exhibits153: Sany Group - Key news
- Exhibits154: Sany Group - Key offerings
- Exhibits155: Sumitomo Heavy Industries Ltd. - Overview
- Exhibits156: Sumitomo Heavy Industries Ltd. - Product / Service
- Exhibits157: Sumitomo Heavy Industries Ltd. - Key offerings
- Exhibits158: Tadano Ltd. - Overview
- Exhibits159: Tadano Ltd. - Business segments
- Exhibits160: Tadano Ltd. - Key offerings
- Exhibits161: Tadano Ltd. - Segment focus
- Exhibits162: Terex Corp. - Overview
- Exhibits163: Terex Corp. - Business segments
- Exhibits164: Terex Corp. - Key news
- Exhibits165: Terex Corp. - Key offerings
- Exhibits166: Terex Corp. - Segment focus
- Exhibits167: The Manitowoc Co. Inc. - Overview
- Exhibits168: The Manitowoc Co. Inc. - Business segments
- Exhibits169: The Manitowoc Co. Inc. - Key news
- Exhibits170: The Manitowoc Co. Inc. - Key offerings
- Exhibits171: The Manitowoc Co. Inc. - Segment focus
- Exhibits172: Xuzhou Construction Machinery Group Co. Ltd. - Overview
- Exhibits173: Xuzhou Construction Machinery Group Co. Ltd. - Product / Service
- Exhibits174: Xuzhou Construction Machinery Group Co. Ltd. - Key offerings
- Exhibits175: Zoomlion Heavy Industry Science and Technology Co. Ltd. - Overview
- Exhibits176: Zoomlion Heavy Industry Science and Technology Co. Ltd. - Business segments
- Exhibits177: Zoomlion Heavy Industry Science and Technology Co. Ltd. - Key offerings
- Exhibits178: Zoomlion Heavy Industry Science and Technology Co. Ltd. - Segment focus
- Exhibits179: Inclusions checklist
- Exhibits180: Exclusions checklist
- Exhibits181: Currency conversion rates for US$
- Exhibits182: Research methodology
- Exhibits183: Information sources
- Exhibits184: Data validation
- Exhibits185: Validation techniques employed for market sizing
- Exhibits186: Data synthesis
- Exhibits187: 360 degree market analysis
- Exhibits188: List of abbreviations
The all-terrain crane market is forecasted to grow by USD 3823.3 mn during 2023-2028, accelerating at a CAGR of 4.36% during the forecast period. The report on the all-terrain crane market provides a holistic analysis, market size and forecast, trends, growth drivers, and challenges, as well as vendor analysis covering around 25 vendors.
The report offers an up-to-date analysis regarding the current market scenario, the latest trends and drivers, and the overall market environment. The market is driven by growing construction industry, increasing demand of all-terrain cranes from mining and power resource industry, and growing demand from utilities sector.
Technavio's all-terrain crane market is segmented as below:
| Market Scope | |
|---|---|
| Base Year | 2024 |
| End Year | 2028 |
| Series Year | 2024-2028 |
| Growth Momentum | Accelerate |
| YOY 2024 | 4.11% |
| CAGR | 4.36% |
| Incremental Value | $3823.3mn |
By Capacity
- Less than 200 tons
- 200-500 tons
- More than 500 tons
By Application
- Construction
- Industrial
- Utilities
By Geographical Landscape
- APAC
- Europe
- North America
- South America
- Middle East and Africa
This study identifies the increasing popularity of telematics in all-terrain crane as one of the prime reasons driving the all-terrain crane market growth during the next few years. Also, increased importance of safety and adoption of vr (virtual reality) technology for operator training will lead to sizable demand in the market.
The report on the all-terrain crane market covers the following areas:
- All-terrain crane market sizing
- All-terrain crane market forecast
- All-terrain crane market industry analysis
The robust vendor analysis is designed to help clients improve their market position, and in line with this, this report provides a detailed analysis of several leading all-terrain crane market vendors that include Action Construction Equipment Ltd., Altec Inc., Bocker Maschinenwerke GmbH, Broderson Manufacturing Corp., Elliott Equipment Inc., FURUKAWA Co. Ltd., Guangxi Liugong Machinery Co. Ltd., KATO WORKS CO. LTD., Kobe Steel Ltd., Liebherr International AG, Manitex Inc., Sany Group, Sumitomo Heavy Industries Ltd., Tadano Ltd., Terex Corp., The Manitowoc Co. Inc., TIL Ltd., Xuzhou Construction Machinery Group Co. Ltd., and Zoomlion Heavy Industry Science and Technology Co. Ltd.. Also, the all-terrain crane market analysis report includes information on upcoming trends and challenges that will influence market growth. This is to help companies strategize and leverage all forthcoming growth opportunities.
The study was conducted using an objective combination of primary and secondary information including inputs from key participants in the industry. The report contains a comprehensive market and vendor landscape in addition to an analysis of the key vendors.
The publisher presents a detailed picture of the market by the way of study, synthesis, and summation of data from multiple sources by an analysis of key parameters such as profit, pricing, competition, and promotions. It presents various market facets by identifying the key industry influencers. The data presented is comprehensive, reliable, and a result of extensive research - both primary and secondary. The market research reports provide a complete competitive landscape and an in-depth vendor selection methodology and analysis using qualitative and quantitative research to forecast the accurate market growth.
Table of Contents
1 Executive Summary
- 1.1 Market overview
- Executive Summary - Chart on Market Overview
- Executive Summary - Data Table on Market Overview
- Executive Summary - Chart on Global Market Characteristics
- Executive Summary - Chart on Market By Geographical Landscape
- Executive Summary - Chart on Market Segmentation by Capacity
- Executive Summary - Chart on Market Segmentation by Application
- Executive Summary - Chart on Incremental Growth
- Executive Summary - Data Table on Incremental Growth
- Executive Summary - Chart on Company Market Positioning
2 Market Landscape
- 2.1 Market ecosystem
- Parent Market
- Data Table on - Parent Market
- 2.2 Market characteristics
- Market characteristics analysis
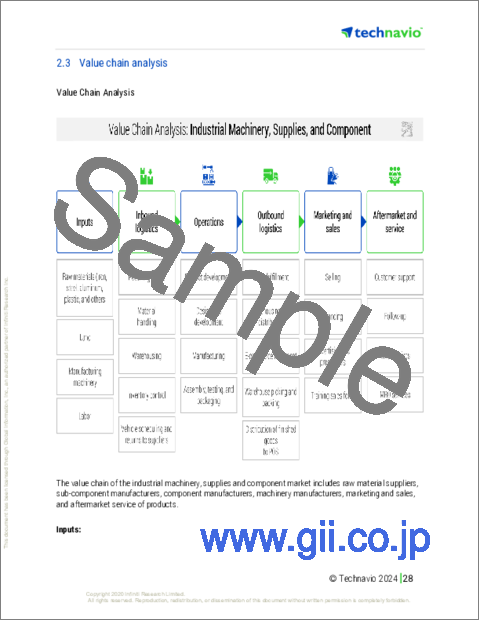
- 2.3 Value chain analysis
- Value Chain Analysis
3 Market Sizing
- 3.1 Market definition
- Offerings of companies included in the market definition
- 3.2 Market segment analysis
- Market segments
- 3.3 Market size 2023
- 3.4 Market outlook: Forecast for 2023-2028
- Chart on Global - Market size and forecast 2023-2028 ($ million)
- Data Table on Global - Market size and forecast 2023-2028 ($ million)
- Chart on Global Market: Year-over-year growth 2023-2028 (%)
- Data Table on Global Market: Year-over-year growth 2023-2028 (%)
4 Historic Market Size
- 4.1 Global All-Terrain Crane Market 2018 - 2022
- Historic Market Size - Data Table on Global All-Terrain Crane Market 2018 - 2022 ($ million)
- 4.2 Capacity segment analysis 2018 - 2022
- Historic Market Size - Capacity Segment 2018 - 2022 ($ million)
- 4.3 Application segment analysis 2018 - 2022
- Historic Market Size - Application Segment 2018 - 2022 ($ million)
- 4.4 Geography segment analysis 2018 - 2022
- Historic Market Size - Geography Segment 2018 - 2022 ($ million)
- 4.5 Country segment analysis 2018 - 2022
- Historic Market Size - Country Segment 2018 - 2022 ($ million)
5 Five Forces Analysis
- 5.1 Five forces summary
- Five forces analysis - Comparison between 2023 and 2028
- 5.2 Bargaining power of buyers
- Bargaining power of buyers - Impact of key factors 2023 and 2028
- 5.3 Bargaining power of suppliers
- Bargaining power of suppliers - Impact of key factors in 2023 and 2028
- 5.4 Threat of new entrants
- Threat of new entrants - Impact of key factors in 2023 and 2028
- 5.5 Threat of substitutes
- Threat of substitutes - Impact of key factors in 2023 and 2028
- 5.6 Threat of rivalry
- Threat of rivalry - Impact of key factors in 2023 and 2028
- 5.7 Market condition
- Chart on Market condition - Five forces 2023 and 2028
6 Market Segmentation by Capacity
- 6.1 Market segments
- Chart on Capacity - Market share 2023-2028 (%)
- Data Table on Capacity - Market share 2023-2028 (%)
- 6.2 Comparison by Capacity
- Chart on Comparison by Capacity
- Data Table on Comparison by Capacity
- 6.3 Less than 200 tons - Market size and forecast 2023-2028
- Chart on Less than 200 tons - Market size and forecast 2023-2028 ($ million)
- Data Table on Less than 200 tons - Market size and forecast 2023-2028 ($ million)
- Chart on Less than 200 tons - Year-over-year growth 2023-2028 (%)
- Data Table on Less than 200 tons - Year-over-year growth 2023-2028 (%)
- 6.4 200-500 tons - Market size and forecast 2023-2028
- Chart on 200-500 tons - Market size and forecast 2023-2028 ($ million)
- Data Table on 200-500 tons - Market size and forecast 2023-2028 ($ million)
- Chart on 200-500 tons - Year-over-year growth 2023-2028 (%)
- Data Table on 200-500 tons - Year-over-year growth 2023-2028 (%)
- 6.5 More than 500 tons - Market size and forecast 2023-2028
- Chart on More than 500 tons - Market size and forecast 2023-2028 ($ million)
- Data Table on More than 500 tons - Market size and forecast 2023-2028 ($ million)
- Chart on More than 500 tons - Year-over-year growth 2023-2028 (%)
- Data Table on More than 500 tons - Year-over-year growth 2023-2028 (%)
- 6.6 Market opportunity by Capacity
- Market opportunity by Capacity ($ million)
- Data Table on Market opportunity by Capacity ($ million)
7 Market Segmentation by Application
- 7.1 Market segments
- Chart on Application - Market share 2023-2028 (%)
- Data Table on Application - Market share 2023-2028 (%)
- 7.2 Comparison by Application
- Chart on Comparison by Application
- Data Table on Comparison by Application
- 7.3 Construction - Market size and forecast 2023-2028
- Chart on Construction - Market size and forecast 2023-2028 ($ million)
- Data Table on Construction - Market size and forecast 2023-2028 ($ million)
- Chart on Construction - Year-over-year growth 2023-2028 (%)
- Data Table on Construction - Year-over-year growth 2023-2028 (%)
- 7.4 Industrial - Market size and forecast 2023-2028
- Chart on Industrial - Market size and forecast 2023-2028 ($ million)
- Data Table on Industrial - Market size and forecast 2023-2028 ($ million)
- Chart on Industrial - Year-over-year growth 2023-2028 (%)
- Data Table on Industrial - Year-over-year growth 2023-2028 (%)
- 7.5 Utilities - Market size and forecast 2023-2028
- Chart on Utilities - Market size and forecast 2023-2028 ($ million)
- Data Table on Utilities - Market size and forecast 2023-2028 ($ million)
- Chart on Utilities - Year-over-year growth 2023-2028 (%)
- Data Table on Utilities - Year-over-year growth 2023-2028 (%)
- 7.6 Market opportunity by Application
- Market opportunity by Application ($ million)
- Data Table on Market opportunity by Application ($ million)
8 Customer Landscape
- 8.1 Customer landscape overview
- Analysis of price sensitivity, lifecycle, customer purchase basket, adoption rates, and purchase criteria
9 Geographic Landscape
- 9.1 Geographic segmentation
- Chart on Market share By Geographical Landscape 2023-2028 (%)
- Data Table on Market share By Geographical Landscape 2023-2028 (%)
- 9.2 Geographic comparison
- Chart on Geographic comparison
- Data Table on Geographic comparison
- 9.3 APAC - Market size and forecast 2023-2028
- Chart on APAC - Market size and forecast 2023-2028 ($ million)
- Data Table on APAC - Market size and forecast 2023-2028 ($ million)
- Chart on APAC - Year-over-year growth 2023-2028 (%)
- Data Table on APAC - Year-over-year growth 2023-2028 (%)
- 9.4 Europe - Market size and forecast 2023-2028
- Chart on Europe - Market size and forecast 2023-2028 ($ million)
- Data Table on Europe - Market size and forecast 2023-2028 ($ million)
- Chart on Europe - Year-over-year growth 2023-2028 (%)
- Data Table on Europe - Year-over-year growth 2023-2028 (%)
- 9.5 North America - Market size and forecast 2023-2028
- Chart on North America - Market size and forecast 2023-2028 ($ million)
- Data Table on North America - Market size and forecast 2023-2028 ($ million)
- Chart on North America - Year-over-year growth 2023-2028 (%)
- Data Table on North America - Year-over-year growth 2023-2028 (%)
- 9.6 South America - Market size and forecast 2023-2028
- Chart on South America - Market size and forecast 2023-2028 ($ million)
- Data Table on South America - Market size and forecast 2023-2028 ($ million)
- Chart on South America - Year-over-year growth 2023-2028 (%)
- Data Table on South America - Year-over-year growth 2023-2028 (%)
- 9.7 Middle East and Africa - Market size and forecast 2023-2028
- Chart on Middle East and Africa - Market size and forecast 2023-2028 ($ million)
- Data Table on Middle East and Africa - Market size and forecast 2023-2028 ($ million)
- Chart on Middle East and Africa - Year-over-year growth 2023-2028 (%)
- Data Table on Middle East and Africa - Year-over-year growth 2023-2028 (%)
- 9.8 China - Market size and forecast 2023-2028
- Chart on China - Market size and forecast 2023-2028 ($ million)
- Data Table on China - Market size and forecast 2023-2028 ($ million)
- Chart on China - Year-over-year growth 2023-2028 (%)
- Data Table on China - Year-over-year growth 2023-2028 (%)
- 9.9 Japan - Market size and forecast 2023-2028
- Chart on Japan - Market size and forecast 2023-2028 ($ million)
- Data Table on Japan - Market size and forecast 2023-2028 ($ million)
- Chart on Japan - Year-over-year growth 2023-2028 (%)
- Data Table on Japan - Year-over-year growth 2023-2028 (%)
- 9.10 US - Market size and forecast 2023-2028
- Chart on US - Market size and forecast 2023-2028 ($ million)
- Data Table on US - Market size and forecast 2023-2028 ($ million)
- Chart on US - Year-over-year growth 2023-2028 (%)
- Data Table on US - Year-over-year growth 2023-2028 (%)
- 9.11 Germany - Market size and forecast 2023-2028
- Chart on Germany - Market size and forecast 2023-2028 ($ million)
- Data Table on Germany - Market size and forecast 2023-2028 ($ million)
- Chart on Germany - Year-over-year growth 2023-2028 (%)
- Data Table on Germany - Year-over-year growth 2023-2028 (%)
- 9.12 France - Market size and forecast 2023-2028
- Chart on France - Market size and forecast 2023-2028 ($ million)
- Data Table on France - Market size and forecast 2023-2028 ($ million)
- Chart on France - Year-over-year growth 2023-2028 (%)
- Data Table on France - Year-over-year growth 2023-2028 (%)
- 9.13 Market opportunity By Geographical Landscape
- Market opportunity By Geographical Landscape ($ million)
- Data Tables on Market opportunity By Geographical Landscape ($ million)
10 Drivers, Challenges, and Opportunity/Restraints
- 10.1 Market drivers
- 10.2 Market challenges
- 10.3 Impact of drivers and challenges
- Impact of drivers and challenges in 2023 and 2028
- 10.4 Market opportunities/restraints
11 Competitive Landscape
- 11.1 Overview
- 11.2 Competitive Landscape
- Overview on criticality of inputs and factors of differentiation
- 11.3 Landscape disruption
- Overview on factors of disruption
- 11.4 Industry risks
- Impact of key risks on business
12 Competitive Analysis
- 12.1 Companies profiled
- Companies covered
- 12.2 Market positioning of companies
- Matrix on companies position and classification
- 12.3 Action Construction Equipment Ltd.
- Action Construction Equipment Ltd. - Overview
- Action Construction Equipment Ltd. - Business segments
- Action Construction Equipment Ltd. - Key offerings
- Action Construction Equipment Ltd. - Segment focus
- 12.4 Broderson Manufacturing Corp.
- Broderson Manufacturing Corp. - Overview
- Broderson Manufacturing Corp. - Product / Service
- Broderson Manufacturing Corp. - Key offerings
- 12.5 Elliott Equipment Inc.
- Elliott Equipment Inc. - Overview
- Elliott Equipment Inc. - Product / Service
- Elliott Equipment Inc. - Key offerings
- 12.6 FURUKAWA Co. Ltd.
- FURUKAWA Co. Ltd. - Overview
- FURUKAWA Co. Ltd. - Business segments
- FURUKAWA Co. Ltd. - Key news
- FURUKAWA Co. Ltd. - Key offerings
- FURUKAWA Co. Ltd. - Segment focus
- 12.7 Guangxi Liugong Machinery Co. Ltd.
- Guangxi Liugong Machinery Co. Ltd. - Overview
- Guangxi Liugong Machinery Co. Ltd. - Product / Service
- Guangxi Liugong Machinery Co. Ltd. - Key offerings
- 12.8 Kobe Steel Ltd.
- Kobe Steel Ltd. - Overview
- Kobe Steel Ltd. - Business segments
- Kobe Steel Ltd. - Key news
- Kobe Steel Ltd. - Key offerings
- Kobe Steel Ltd. - Segment focus
- 12.9 Liebherr International AG
- Liebherr International AG - Overview
- Liebherr International AG - Product / Service
- Liebherr International AG - Key news
- Liebherr International AG - Key offerings
- 12.10 Manitex Inc.
- Manitex Inc. - Overview
- Manitex Inc. - Product / Service
- Manitex Inc. - Key offerings
- 12.11 Sany Group
- Sany Group - Overview
- Sany Group - Product / Service
- Sany Group - Key news
- Sany Group - Key offerings
- 12.12 Sumitomo Heavy Industries Ltd.
- Sumitomo Heavy Industries Ltd. - Overview
- Sumitomo Heavy Industries Ltd. - Product / Service
- Sumitomo Heavy Industries Ltd. - Key offerings
- 12.13 Tadano Ltd.
- Tadano Ltd. - Overview
- Tadano Ltd. - Business segments
- Tadano Ltd. - Key offerings
- Tadano Ltd. - Segment focus
- 12.14 Terex Corp.
- Terex Corp. - Overview
- Terex Corp. - Business segments
- Terex Corp. - Key news
- Terex Corp. - Key offerings
- Terex Corp. - Segment focus
- 12.15 The Manitowoc Co. Inc.
- The Manitowoc Co. Inc. - Overview
- The Manitowoc Co. Inc. - Business segments
- The Manitowoc Co. Inc. - Key news
- The Manitowoc Co. Inc. - Key offerings
- The Manitowoc Co. Inc. - Segment focus
- 12.16 Xuzhou Construction Machinery Group Co. Ltd.
- Xuzhou Construction Machinery Group Co. Ltd. - Overview
- Xuzhou Construction Machinery Group Co. Ltd. - Product / Service
- Xuzhou Construction Machinery Group Co. Ltd. - Key offerings
- 12.17 Zoomlion Heavy Industry Science and Technology Co. Ltd.
- Zoomlion Heavy Industry Science and Technology Co. Ltd. - Overview
- Zoomlion Heavy Industry Science and Technology Co. Ltd. - Business segments
- Zoomlion Heavy Industry Science and Technology Co. Ltd. - Key offerings
- Zoomlion Heavy Industry Science and Technology Co. Ltd. - Segment focus
13 Appendix
- 13.1 Scope of the report
- 13.2 Inclusions and exclusions checklist
- Inclusions checklist
- Exclusions checklist
- 13.3 Currency conversion rates for US$
- Currency conversion rates for US$
- 13.4 Research methodology
- Research methodology
- 13.5 Data procurement
- Information sources
- 13.6 Data validation
- Data validation
- 13.7 Validation techniques employed for market sizing
- Validation techniques employed for market sizing
- 13.8 Data synthesis
- Data synthesis
- 13.9 360 degree market analysis
- 360 degree market analysis
- 13.10 List of abbreviations
- List of abbreviations

