|
|
市場調査レポート
商品コード
1524846
スマート教育ソフトウェアの世界市場 2024-2028Global smart education software market 2024-2028 |
||||||

|
|||||||
カスタマイズ可能
|
|||||||

| スマート教育ソフトウェアの世界市場 2024-2028 |
|
出版日: 2024年07月09日
発行: TechNavio
ページ情報: 英文 155 Pages
納期: 即納可能
|

全表示
- 概要
- 図表
- 目次
スマート教育ソフトウェア市場は2023-2028年に34兆1,835億米ドル、予測期間中のCAGRは16.6%と予測されています。
当レポートでは、スマート教育ソフトウェア市場の全体的な分析、市場規模・予測、動向、成長促進要因、課題、約25のベンダーを網羅したベンダー分析などを掲載しています。
現在の市場シナリオ、最新動向と促進要因、市場環境全体に関する最新分析を提供しています。eラーニングの採用拡大、学習プロセスを強化する魅力的なコースの市場開発、個別学習への注力などが市場を牽引しています。
| 市場範囲 | |
|---|---|
| 基準年 | 2024 |
| 終了年 | 2028 |
| 予測期間 | 2024-2028 |
| 成長モメンタム | 加速 |
| 前年比2024年 | 13.86% |
| CAGR | 16.6% |
| 増分額 | 34兆1,835億米ドル |
本調査では、今後数年間におけるスマート教育ソフトウェア市場の成長を促進する主な要因の1つとして、クラウドベースのソフトウェア採用の増加を挙げています。また、ゲーミフィケーションやアダプティブラーニングの採用が増加し、モバイルベースのラーニングの採用が増加していることも、同市場における大きな需要につながると思われます。
目次
第1章 エグゼクティブサマリー
- 市場概要
第2章 市場情勢
- 市場エコシステム
- 市場の特徴
- バリューチェーン分析
第3章 市場規模の評価
- 市場の定義
- 市場セグメント分析
- 市場規模 2023
- 市場の見通し 2023-2028
第4章 市場規模実績
- 世界スマート教育ソフトウェア市場 2018-2022
- 製品別セグメント分析 2018-2022
- 地域別セグメント分析 2018-2022
- 国別セグメント分析 2018-2022
第5章 ファイブフォース分析
- ファイブフォースの要約
- 買い手の交渉力
- 供給企業の交渉力
- 新規参入業者の脅威
- 代替品の脅威
- 競争の脅威
- 市況
第6章 市場セグメンテーション:製品別
- 市場セグメンテーション
- 比較:製品別
- コンテンツ:市場規模と予測 2023-2028
- 学習:市場規模と予測 2023-2028
- 評価:市場規模と予測 2023-2028
- 市場機会:製品別
第7章 顧客情勢
- 顧客情勢の概要
第8章 地域別情勢
- 地域別セグメンテーション
- 地域別比較
- 北米:市場規模と予測 2023-2028
- アジア太平洋:市場規模と予測 2023-2028
- 欧州:市場規模と予測 2023-2028
- 南米:市場規模と予測 2023-2028
- 中東・アフリカ:市場規模と予測 2023-2028
- 米国:市場規模と予測 2023-2028
- 中国:市場規模と予測 2023-2028
- カナダ:市場規模と予測 2023-2028
- ドイツ:市場規模と予測 2023-2028
- 英国:市場規模と予測 2023-2028
- 市場機会:地域情勢別
第9章 促進要因・課題・機会・抑制要因
- 市場促進要因
- 市場の課題
- 促進要因と課題の影響
- 市場の機会・抑制要因
第10章 競合情勢
- 概要
- 競合情勢
- 混乱の状況
- 業界のリスク
第11章 競合分析
- 企業プロファイル
- 企業の市場ポジショニング
- Adobe Inc.
- Anthology Inc.
- Cisco Systems Inc.
- Cornerstone OnDemand Inc.
- D2L Inc.
- Hon Hai Precision Industry Co. Ltd.
- John Wiley and Sons Inc.
- NetDragon Websoft Holdings Ltd
- Pearson Plc
- Thoma Bravo LP
第12章 付録
Exhibits:
- Exhibits1: Executive Summary - Chart on Market Overview
- Exhibits2: Executive Summary - Data Table on Market Overview
- Exhibits3: Executive Summary - Chart on Global Market Characteristics
- Exhibits4: Executive Summary - Chart on Market By Geographical Landscape
- Exhibits5: Executive Summary - Chart on Market Segmentation by Product
- Exhibits6: Executive Summary - Chart on Incremental Growth
- Exhibits7: Executive Summary - Data Table on Incremental Growth
- Exhibits8: Executive Summary - Chart on Company Market Positioning
- Exhibits9: Parent Market
- Exhibits10: Data Table on - Parent Market
- Exhibits11: Market characteristics analysis
- Exhibits12: Value Chain Analysis
- Exhibits13: Offerings of companies included in the market definition
- Exhibits14: Market segments
- Exhibits15: Chart on Global - Market size and forecast 2023-2028 ($ billion)
- Exhibits16: Data Table on Global - Market size and forecast 2023-2028 ($ billion)
- Exhibits17: Chart on Global Market: Year-over-year growth 2023-2028 (%)
- Exhibits18: Data Table on Global Market: Year-over-year growth 2023-2028 (%)
- Exhibits19: Historic Market Size - Data Table on Global Smart Education Software Market 2018 - 2022 ($ billion)
- Exhibits20: Historic Market Size - Product Segment 2018 - 2022 ($ billion)
- Exhibits21: Historic Market Size - Geography Segment 2018 - 2022 ($ billion)
- Exhibits22: Historic Market Size - Country Segment 2018 - 2022 ($ billion)
- Exhibits23: Five forces analysis - Comparison between 2023 and 2028
- Exhibits24: Bargaining power of buyers - Impact of key factors 2023 and 2028
- Exhibits25: Bargaining power of suppliers - Impact of key factors in 2023 and 2028
- Exhibits26: Threat of new entrants - Impact of key factors in 2023 and 2028
- Exhibits27: Threat of substitutes - Impact of key factors in 2023 and 2028
- Exhibits28: Threat of rivalry - Impact of key factors in 2023 and 2028
- Exhibits29: Chart on Market condition - Five forces 2023 and 2028
- Exhibits30: Chart on Product - Market share 2023-2028 (%)
- Exhibits31: Data Table on Product - Market share 2023-2028 (%)
- Exhibits32: Chart on Comparison by Product
- Exhibits33: Data Table on Comparison by Product
- Exhibits34: Chart on Content - Market size and forecast 2023-2028 ($ billion)
- Exhibits35: Data Table on Content - Market size and forecast 2023-2028 ($ billion)
- Exhibits36: Chart on Content - Year-over-year growth 2023-2028 (%)
- Exhibits37: Data Table on Content - Year-over-year growth 2023-2028 (%)
- Exhibits38: Chart on Learning - Market size and forecast 2023-2028 ($ billion)
- Exhibits39: Data Table on Learning - Market size and forecast 2023-2028 ($ billion)
- Exhibits40: Chart on Learning - Year-over-year growth 2023-2028 (%)
- Exhibits41: Data Table on Learning - Year-over-year growth 2023-2028 (%)
- Exhibits42: Chart on Assessment - Market size and forecast 2023-2028 ($ billion)
- Exhibits43: Data Table on Assessment - Market size and forecast 2023-2028 ($ billion)
- Exhibits44: Chart on Assessment - Year-over-year growth 2023-2028 (%)
- Exhibits45: Data Table on Assessment - Year-over-year growth 2023-2028 (%)
- Exhibits46: Market opportunity by Product ($ billion)
- Exhibits47: Data Table on Market opportunity by Product ($ billion)
- Exhibits48: Analysis of price sensitivity, lifecycle, customer purchase basket, adoption rates, and purchase criteria
- Exhibits49: Chart on Market share By Geographical Landscape 2023-2028 (%)
- Exhibits50: Data Table on Market share By Geographical Landscape 2023-2028 (%)
- Exhibits51: Chart on Geographic comparison
- Exhibits52: Data Table on Geographic comparison
- Exhibits53: Chart on North America - Market size and forecast 2023-2028 ($ billion)
- Exhibits54: Data Table on North America - Market size and forecast 2023-2028 ($ billion)
- Exhibits55: Chart on North America - Year-over-year growth 2023-2028 (%)
- Exhibits56: Data Table on North America - Year-over-year growth 2023-2028 (%)
- Exhibits57: Chart on APAC - Market size and forecast 2023-2028 ($ billion)
- Exhibits58: Data Table on APAC - Market size and forecast 2023-2028 ($ billion)
- Exhibits59: Chart on APAC - Year-over-year growth 2023-2028 (%)
- Exhibits60: Data Table on APAC - Year-over-year growth 2023-2028 (%)
- Exhibits61: Chart on Europe - Market size and forecast 2023-2028 ($ billion)
- Exhibits62: Data Table on Europe - Market size and forecast 2023-2028 ($ billion)
- Exhibits63: Chart on Europe - Year-over-year growth 2023-2028 (%)
- Exhibits64: Data Table on Europe - Year-over-year growth 2023-2028 (%)
- Exhibits65: Chart on South America - Market size and forecast 2023-2028 ($ billion)
- Exhibits66: Data Table on South America - Market size and forecast 2023-2028 ($ billion)
- Exhibits67: Chart on South America - Year-over-year growth 2023-2028 (%)
- Exhibits68: Data Table on South America - Year-over-year growth 2023-2028 (%)
- Exhibits69: Chart on Middle East and Africa - Market size and forecast 2023-2028 ($ billion)
- Exhibits70: Data Table on Middle East and Africa - Market size and forecast 2023-2028 ($ billion)
- Exhibits71: Chart on Middle East and Africa - Year-over-year growth 2023-2028 (%)
- Exhibits72: Data Table on Middle East and Africa - Year-over-year growth 2023-2028 (%)
- Exhibits73: Chart on US - Market size and forecast 2023-2028 ($ billion)
- Exhibits74: Data Table on US - Market size and forecast 2023-2028 ($ billion)
- Exhibits75: Chart on US - Year-over-year growth 2023-2028 (%)
- Exhibits76: Data Table on US - Year-over-year growth 2023-2028 (%)
- Exhibits77: Chart on China - Market size and forecast 2023-2028 ($ billion)
- Exhibits78: Data Table on China - Market size and forecast 2023-2028 ($ billion)
- Exhibits79: Chart on China - Year-over-year growth 2023-2028 (%)
- Exhibits80: Data Table on China - Year-over-year growth 2023-2028 (%)
- Exhibits81: Chart on Canada - Market size and forecast 2023-2028 ($ billion)
- Exhibits82: Data Table on Canada - Market size and forecast 2023-2028 ($ billion)
- Exhibits83: Chart on Canada - Year-over-year growth 2023-2028 (%)
- Exhibits84: Data Table on Canada - Year-over-year growth 2023-2028 (%)
- Exhibits85: Chart on Germany - Market size and forecast 2023-2028 ($ billion)
- Exhibits86: Data Table on Germany - Market size and forecast 2023-2028 ($ billion)
- Exhibits87: Chart on Germany - Year-over-year growth 2023-2028 (%)
- Exhibits88: Data Table on Germany - Year-over-year growth 2023-2028 (%)
- Exhibits89: Chart on UK - Market size and forecast 2023-2028 ($ billion)
- Exhibits90: Data Table on UK - Market size and forecast 2023-2028 ($ billion)
- Exhibits91: Chart on UK - Year-over-year growth 2023-2028 (%)
- Exhibits92: Data Table on UK - Year-over-year growth 2023-2028 (%)
- Exhibits93: Market opportunity By Geographical Landscape ($ billion)
- Exhibits94: Data Tables on Market opportunity By Geographical Landscape ($ billion)
- Exhibits95: Impact of drivers and challenges in 2023 and 2028
- Exhibits96: Overview on criticality of inputs and factors of differentiation
- Exhibits97: Overview on factors of disruption
- Exhibits98: Impact of key risks on business
- Exhibits99: Companies covered
- Exhibits100: Matrix on companies position and classification
- Exhibits101: Adobe Inc. - Overview
- Exhibits102: Adobe Inc. - Business segments
- Exhibits103: Adobe Inc. - Key news
- Exhibits104: Adobe Inc. - Key offerings
- Exhibits105: Adobe Inc. - Segment focus
- Exhibits106: Anthology Inc. - Overview
- Exhibits107: Anthology Inc. - Product / Service
- Exhibits108: Anthology Inc. - Key news
- Exhibits109: Anthology Inc. - Key offerings
- Exhibits110: Cisco Systems Inc. - Overview
- Exhibits111: Cisco Systems Inc. - Business segments
- Exhibits112: Cisco Systems Inc. - Key news
- Exhibits113: Cisco Systems Inc. - Key offerings
- Exhibits114: Cisco Systems Inc. - Segment focus
- Exhibits115: Cornerstone OnDemand Inc. - Overview
- Exhibits116: Cornerstone OnDemand Inc. - Product / Service
- Exhibits117: Cornerstone OnDemand Inc. - Key news
- Exhibits118: Cornerstone OnDemand Inc. - Key offerings
- Exhibits119: D2L Inc. - Overview
- Exhibits120: D2L Inc. - Product / Service
- Exhibits121: D2L Inc. - Key news
- Exhibits122: D2L Inc. - Key offerings
- Exhibits123: Hon Hai Precision Industry Co. Ltd. - Overview
- Exhibits124: Hon Hai Precision Industry Co. Ltd. - Product / Service
- Exhibits125: Hon Hai Precision Industry Co. Ltd. - Key offerings
- Exhibits126: John Wiley and Sons Inc. - Overview
- Exhibits127: John Wiley and Sons Inc. - Business segments
- Exhibits128: John Wiley and Sons Inc. - Key news
- Exhibits129: John Wiley and Sons Inc. - Key offerings
- Exhibits130: John Wiley and Sons Inc. - Segment focus
- Exhibits131: NetDragon Websoft Holdings Ltd - Overview
- Exhibits132: NetDragon Websoft Holdings Ltd - Business segments
- Exhibits133: NetDragon Websoft Holdings Ltd - Key offerings
- Exhibits134: NetDragon Websoft Holdings Ltd - Segment focus
- Exhibits135: Pearson Plc - Overview
- Exhibits136: Pearson Plc - Business segments
- Exhibits137: Pearson Plc - Key news
- Exhibits138: Pearson Plc - Key offerings
- Exhibits139: Pearson Plc - Segment focus
- Exhibits140: Thoma Bravo LP - Overview
- Exhibits141: Thoma Bravo LP - Product / Service
- Exhibits142: Thoma Bravo LP - Key offerings
- Exhibits143: Inclusions checklist
- Exhibits144: Exclusions checklist
- Exhibits145: Currency conversion rates for US$
- Exhibits146: Research methodology
- Exhibits147: Information sources
- Exhibits148: Data validation
- Exhibits149: Validation techniques employed for market sizing
- Exhibits150: Data synthesis
- Exhibits151: 360 degree market analysis
- Exhibits152: List of abbreviations
The smart education software market is forecasted to grow by USD 34183.5 bn during 2023-2028, accelerating at a CAGR of 16.6% during the forecast period. The report on the smart education software market provides a holistic analysis, market size and forecast, trends, growth drivers, and challenges, as well as vendor analysis covering around 25 vendors.
The report offers an up-to-date analysis regarding the current market scenario, the latest trends and drivers, and the overall market environment. The market is driven by growing adoption of e-learning, development of engaging courses to enhance learning process, and focus on personalized learning.
Technavio's smart education software market is segmented as below:
| Market Scope | |
|---|---|
| Base Year | 2024 |
| End Year | 2028 |
| Series Year | 2024-2028 |
| Growth Momentum | Accelerate |
| YOY 2024 | 13.86% |
| CAGR | 16.6% |
| Incremental Value | $34183.5bn |
By Product
- Content
- Learning
- Assessment
By Geographical Landscape
- North America
- APAC
- Europe
- South America
- Middle East and Africa
This study identifies the increasing adoption of cloud based software as one of the prime reasons driving the smart education software market growth during the next few years. Also, rising adoption of gamification and adaptive learning and increased adoption of mobile-based learning will lead to sizable demand in the market.
The report on the smart education software market covers the following areas:
- smart education software market sizing
- smart education software market forecast
- smart education software market industry analysis
The robust vendor analysis is designed to help clients improve their market position, and in line with this, this report provides a detailed analysis of several leading smart education software market vendors that include Adobe Inc., Anthology Inc., Apollo Asset Management Inc., Cisco Systems Inc., Cornerstone OnDemand Inc., D2L Inc., Educomp Solutions Ltd., Ellucian Co., Hon Hai Precision Industry Co. Ltd., John Wiley and Sons Inc., MPS Ltd., NetDragon Websoft Holdings Ltd, NIIT Ltd., Oracle Corp., Pearson PLC, Promethean World Ltd., SAP SE, Scholastic Corp., Skillsoft Corp., and Thoma Bravo LP. Also, the smart education software market analysis report includes information on upcoming trends and challenges that will influence market growth. This is to help companies strategize and leverage all forthcoming growth opportunities.
The study was conducted using an objective combination of primary and secondary information including inputs from key participants in the industry. The report contains a comprehensive market and vendor landscape in addition to an analysis of the key vendors.
The publisher presents a detailed picture of the market by the way of study, synthesis, and summation of data from multiple sources by an analysis of key parameters such as profit, pricing, competition, and promotions. IT presents various market facets by identifying the key industry influencers. The data presented is comprehensive, reliable, and a result of extensive research - both primary and secondary. The market research reports provide a complete competitive landscape and an in-depth vendor selection methodology and analysis using qualitative and quantitative research to forecast the accurate market growth.
Table of Contents
1 Executive Summary
- 1.1 Market overview
- Executive Summary - Chart on Market Overview
- Executive Summary - Data Table on Market Overview
- Executive Summary - Chart on Global Market Characteristics
- Executive Summary - Chart on Market By Geographical Landscape
- Executive Summary - Chart on Market Segmentation by Product
- Executive Summary - Chart on Incremental Growth
- Executive Summary - Data Table on Incremental Growth
- Executive Summary - Chart on Company Market Positioning
2 Market Landscape
- 2.1 Market ecosystem
- Parent Market
- Data Table on - Parent Market
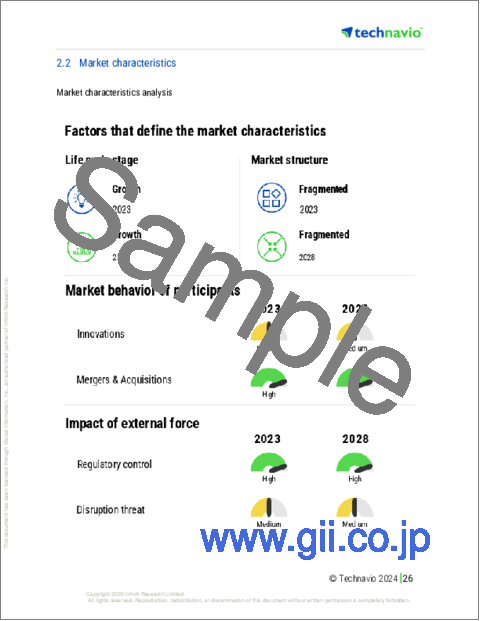
- 2.2 Market characteristics
- Market characteristics analysis
- 2.3 Value chain analysis
- Value Chain Analysis
3 Market Sizing
- 3.1 Market definition
- Offerings of companies included in the market definition
- 3.2 Market segment analysis
- Market segments
- 3.3 Market size 2023
- 3.4 Market outlook: Forecast for 2023-2028
- Chart on Global - Market size and forecast 2023-2028 ($ billion)
- Data Table on Global - Market size and forecast 2023-2028 ($ billion)
- Chart on Global Market: Year-over-year growth 2023-2028 (%)
- Data Table on Global Market: Year-over-year growth 2023-2028 (%)
4 Historic Market Size
- 4.1 Global Smart Education Software Market 2018 - 2022
- Historic Market Size - Data Table on Global Smart Education Software Market 2018 - 2022 ($ billion)
- 4.2 Product segment analysis 2018 - 2022
- Historic Market Size - Product Segment 2018 - 2022 ($ billion)
- 4.3 Geography segment analysis 2018 - 2022
- Historic Market Size - Geography Segment 2018 - 2022 ($ billion)
- 4.4 Country segment analysis 2018 - 2022
- Historic Market Size - Country Segment 2018 - 2022 ($ billion)
5 Five Forces Analysis
- 5.1 Five forces summary
- Five forces analysis - Comparison between 2023 and 2028
- 5.2 Bargaining power of buyers
- Bargaining power of buyers - Impact of key factors 2023 and 2028
- 5.3 Bargaining power of suppliers
- Bargaining power of suppliers - Impact of key factors in 2023 and 2028
- 5.4 Threat of new entrants
- Threat of new entrants - Impact of key factors in 2023 and 2028
- 5.5 Threat of substitutes
- Threat of substitutes - Impact of key factors in 2023 and 2028
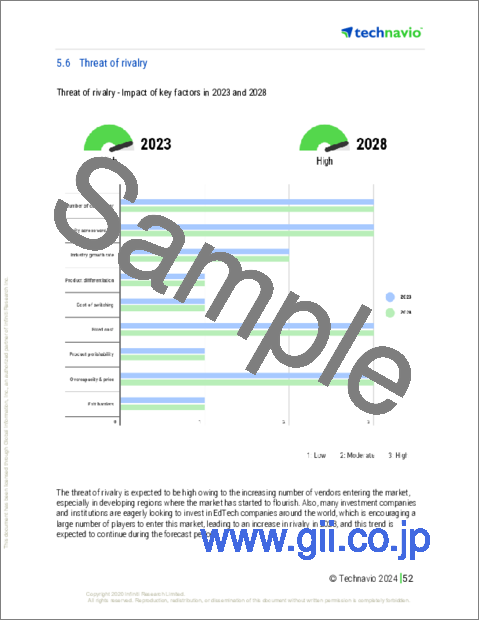
- 5.6 Threat of rivalry
- Threat of rivalry - Impact of key factors in 2023 and 2028
- 5.7 Market condition
- Chart on Market condition - Five forces 2023 and 2028
6 Market Segmentation by Product
- 6.1 Market segments
- Chart on Product - Market share 2023-2028 (%)
- Data Table on Product - Market share 2023-2028 (%)
- 6.2 Comparison by Product
- Chart on Comparison by Product
- Data Table on Comparison by Product
- 6.3 Content - Market size and forecast 2023-2028
- Chart on Content - Market size and forecast 2023-2028 ($ billion)
- Data Table on Content - Market size and forecast 2023-2028 ($ billion)
- Chart on Content - Year-over-year growth 2023-2028 (%)
- Data Table on Content - Year-over-year growth 2023-2028 (%)
- 6.4 Learning - Market size and forecast 2023-2028
- Chart on Learning - Market size and forecast 2023-2028 ($ billion)
- Data Table on Learning - Market size and forecast 2023-2028 ($ billion)
- Chart on Learning - Year-over-year growth 2023-2028 (%)
- Data Table on Learning - Year-over-year growth 2023-2028 (%)
- 6.5 Assessment - Market size and forecast 2023-2028
- Chart on Assessment - Market size and forecast 2023-2028 ($ billion)
- Data Table on Assessment - Market size and forecast 2023-2028 ($ billion)
- Chart on Assessment - Year-over-year growth 2023-2028 (%)
- Data Table on Assessment - Year-over-year growth 2023-2028 (%)
- 6.6 Market opportunity by Product
- Market opportunity by Product ($ billion)
- Data Table on Market opportunity by Product ($ billion)
7 Customer Landscape
- 7.1 Customer landscape overview
- Analysis of price sensitivity, lifecycle, customer purchase basket, adoption rates, and purchase criteria
8 Geographic Landscape
- 8.1 Geographic segmentation
- Chart on Market share By Geographical Landscape 2023-2028 (%)
- Data Table on Market share By Geographical Landscape 2023-2028 (%)
- 8.2 Geographic comparison
- Chart on Geographic comparison
- Data Table on Geographic comparison
- 8.3 North America - Market size and forecast 2023-2028
- Chart on North America - Market size and forecast 2023-2028 ($ billion)
- Data Table on North America - Market size and forecast 2023-2028 ($ billion)
- Chart on North America - Year-over-year growth 2023-2028 (%)
- Data Table on North America - Year-over-year growth 2023-2028 (%)
- 8.4 APAC - Market size and forecast 2023-2028
- Chart on APAC - Market size and forecast 2023-2028 ($ billion)
- Data Table on APAC - Market size and forecast 2023-2028 ($ billion)
- Chart on APAC - Year-over-year growth 2023-2028 (%)
- Data Table on APAC - Year-over-year growth 2023-2028 (%)
- 8.5 Europe - Market size and forecast 2023-2028
- Chart on Europe - Market size and forecast 2023-2028 ($ billion)
- Data Table on Europe - Market size and forecast 2023-2028 ($ billion)
- Chart on Europe - Year-over-year growth 2023-2028 (%)
- Data Table on Europe - Year-over-year growth 2023-2028 (%)
- 8.6 South America - Market size and forecast 2023-2028
- Chart on South America - Market size and forecast 2023-2028 ($ billion)
- Data Table on South America - Market size and forecast 2023-2028 ($ billion)
- Chart on South America - Year-over-year growth 2023-2028 (%)
- Data Table on South America - Year-over-year growth 2023-2028 (%)
- 8.7 Middle East and Africa - Market size and forecast 2023-2028
- Chart on Middle East and Africa - Market size and forecast 2023-2028 ($ billion)
- Data Table on Middle East and Africa - Market size and forecast 2023-2028 ($ billion)
- Chart on Middle East and Africa - Year-over-year growth 2023-2028 (%)
- Data Table on Middle East and Africa - Year-over-year growth 2023-2028 (%)
- 8.8 US - Market size and forecast 2023-2028
- Chart on US - Market size and forecast 2023-2028 ($ billion)
- Data Table on US - Market size and forecast 2023-2028 ($ billion)
- Chart on US - Year-over-year growth 2023-2028 (%)
- Data Table on US - Year-over-year growth 2023-2028 (%)
- 8.9 China - Market size and forecast 2023-2028
- Chart on China - Market size and forecast 2023-2028 ($ billion)
- Data Table on China - Market size and forecast 2023-2028 ($ billion)
- Chart on China - Year-over-year growth 2023-2028 (%)
- Data Table on China - Year-over-year growth 2023-2028 (%)
- 8.10 Canada - Market size and forecast 2023-2028
- Chart on Canada - Market size and forecast 2023-2028 ($ billion)
- Data Table on Canada - Market size and forecast 2023-2028 ($ billion)
- Chart on Canada - Year-over-year growth 2023-2028 (%)
- Data Table on Canada - Year-over-year growth 2023-2028 (%)
- 8.11 Germany - Market size and forecast 2023-2028
- Chart on Germany - Market size and forecast 2023-2028 ($ billion)
- Data Table on Germany - Market size and forecast 2023-2028 ($ billion)
- Chart on Germany - Year-over-year growth 2023-2028 (%)
- Data Table on Germany - Year-over-year growth 2023-2028 (%)
- 8.12 UK - Market size and forecast 2023-2028
- Chart on UK - Market size and forecast 2023-2028 ($ billion)
- Data Table on UK - Market size and forecast 2023-2028 ($ billion)
- Chart on UK - Year-over-year growth 2023-2028 (%)
- Data Table on UK - Year-over-year growth 2023-2028 (%)
- 8.13 Market opportunity By Geographical Landscape
- Market opportunity By Geographical Landscape ($ billion)
- Data Tables on Market opportunity By Geographical Landscape ($ billion)
9 Drivers, Challenges, and Opportunity/Restraints
- 9.1 Market drivers
- 9.2 Market challenges
- 9.3 Impact of drivers and challenges
- Impact of drivers and challenges in 2023 and 2028
- 9.4 Market opportunities/restraints
10 Competitive Landscape
- 10.1 Overview
- 10.2 Competitive Landscape
- Overview on criticality of inputs and factors of differentiation
- 10.3 Landscape disruption
- Overview on factors of disruption
- 10.4 Industry risks
- Impact of key risks on business
11 Competitive Analysis
- 11.1 Companies profiled
- Companies covered
- 11.2 Market positioning of companies
- Matrix on companies position and classification
- 11.3 Adobe Inc.
- Adobe Inc. - Overview
- Adobe Inc. - Business segments
- Adobe Inc. - Key news
- Adobe Inc. - Key offerings
- Adobe Inc. - Segment focus
- 11.4 Anthology Inc.
- Anthology Inc. - Overview
- Anthology Inc. - Product / Service
- Anthology Inc. - Key news
- Anthology Inc. - Key offerings
- 11.5 Cisco Systems Inc.
- Cisco Systems Inc. - Overview
- Cisco Systems Inc. - Business segments
- Cisco Systems Inc. - Key news
- Cisco Systems Inc. - Key offerings
- Cisco Systems Inc. - Segment focus
- 11.6 Cornerstone OnDemand Inc.
- Cornerstone OnDemand Inc. - Overview
- Cornerstone OnDemand Inc. - Product / Service
- Cornerstone OnDemand Inc. - Key news
- Cornerstone OnDemand Inc. - Key offerings
- 11.7 D2L Inc.
- D2L Inc. - Overview
- D2L Inc. - Product / Service
- D2L Inc. - Key news
- D2L Inc. - Key offerings
- 11.8 Hon Hai Precision Industry Co. Ltd.
- Hon Hai Precision Industry Co. Ltd. - Overview
- Hon Hai Precision Industry Co. Ltd. - Product / Service
- Hon Hai Precision Industry Co. Ltd. - Key offerings
- 11.9 John Wiley and Sons Inc.
- John Wiley and Sons Inc. - Overview
- John Wiley and Sons Inc. - Business segments
- John Wiley and Sons Inc. - Key news
- John Wiley and Sons Inc. - Key offerings
- John Wiley and Sons Inc. - Segment focus
- 11.10 NetDragon Websoft Holdings Ltd
- NetDragon Websoft Holdings Ltd - Overview
- NetDragon Websoft Holdings Ltd - Business segments
- NetDragon Websoft Holdings Ltd - Key offerings
- NetDragon Websoft Holdings Ltd - Segment focus
- 11.11 Pearson Plc
- Pearson Plc - Overview
- Pearson Plc - Business segments
- Pearson Plc - Key news
- Pearson Plc - Key offerings
- Pearson Plc - Segment focus
- 11.12 Thoma Bravo LP
- Thoma Bravo LP - Overview
- Thoma Bravo LP - Product / Service
- Thoma Bravo LP - Key offerings
12 Appendix
- 12.1 Scope of the report
- 12.2 Inclusions and exclusions checklist
- Inclusions checklist
- Exclusions checklist
- 12.3 Currency conversion rates for US$
- Currency conversion rates for US$
- 12.4 Research methodology
- Research methodology
- 12.5 Data procurement
- Information sources
- 12.6 Data validation
- Data validation
- 12.7 Validation techniques employed for market sizing
- Validation techniques employed for market sizing
- 12.8 Data synthesis
- Data synthesis
- 12.9 360 degree market analysis
- 360 degree market analysis
- 12.10 List of abbreviations
- List of abbreviations

