|
|
市場調査レポート
商品コード
1524764
一体型ギア式遠心圧縮機の世界市場 2024-2028Global integrally geared centrifugal compressor market 2024-2028 |
||||||

|
|||||||
カスタマイズ可能
|
|||||||

| 一体型ギア式遠心圧縮機の世界市場 2024-2028 |
|
出版日: 2024年07月09日
発行: TechNavio
ページ情報: 英文 189 Pages
納期: 即納可能
|

全表示
- 概要
- 図表
- 目次
一体型ギア式遠心圧縮機市場は2023-2028年に6億4,970万米ドル、予測期間中のCAGRは6.78%で成長すると予測されます。
この調査レポートは、一体型ギア式遠心圧縮機市場の全体分析、市場規模・予測、動向、成長促進要因、課題、約25のベンダーを網羅したベンダー分析などを掲載しています。
現在の市場シナリオ、最新動向と促進要因、市場環境全体に関する最新分析を提供しています。石油・ガス産業からの需要の高まり、エネルギー効率の高いコンプレッサーシステムに対するニーズの高まり、機械の効率向上と運用コスト削減の重要性の高まりが市場を牽引しています。
| 市場範囲 | |
|---|---|
| 基準年 | 2024 |
| 終了年 | 2028 |
| 予測期間 | 2024-2028 |
| 成長モメンタム | 加速 |
| 前年比2024年 | 6.24% |
| CAGR | 6.78% |
| 増分額 | 6億4,970万米ドル |
本調査では、今後数年間の一体型ギア式遠心圧縮機市場成長を牽引する主要因の1つとして、研究開発およびM&A(合併・買収)の増加を挙げています。また、Tier-4エンジンの使用増加や炭素回収プラントの普及が市場の大きな需要につながります。
目次
第1章 エグゼクティブサマリー
- 市場概要
第2章 市場情勢
- 市場エコシステム
- 市場の特徴
- バリューチェーン分析
第3章 市場規模の評価
- 市場の定義
- 市場セグメント分析
- 市場規模 2023
- 市場の見通し 2023-2028
第4章 市場規模実績
- 世界一体型ギア式遠心圧縮機市場 2018-2022
- 用途別セグメント分析 2018-2022
- タイプ別セグメント分析 2018-2022
- 地域別セグメント分析 2018-2022
- 国別セグメント分析 2018-2022
第5章 ファイブフォース分析
- ファイブフォースの要約
- 買い手の交渉力
- 供給企業の交渉力
- 新規参入業者の脅威
- 代替品の脅威
- 競争の脅威
- 市況
第6章 市場セグメンテーション:用途別
- 市場セグメンテーション
- 比較:用途別
- 石油・ガス:市場規模と予測 2023-2028
- 産業用ガス:市場規模と予測 2023-2028
- 化学・石油化学:市場規模と予測 2023-2028
- 発電:市場規模と予測 2023-2028
- その他:市場規模と予測 2023-2028
- 市場機会:用途別
第7章 市場セグメンテーション:タイプ別
- 市場セグメンテーション
- 比較:タイプ別
- カスタムベース:市場規模と予測 2023-2028
- モジュラー:市場規模と予測 2023-2028
- 市場機会:タイプ別
第8章 顧客情勢
- 顧客情勢の概要
第9章 地域別情勢
- 地域別セグメンテーション
- 地域別比較
- アジア太平洋:市場規模と予測 2023-2028
- 欧州:市場規模と予測 2023-2028
- 北米:市場規模と予測 2023-2028
- 中東・アフリカ:市場規模と予測 2023-2028
- 南米:市場規模と予測 2023-2028
- 米国:市場規模と予測 2023-2028
- 中国:市場規模と予測 2023-2028
- 日本:市場規模と予測 2023-2028
- インド:市場規模と予測 2023-2028
- カナダ:市場規模と予測 2023-2028
- 市場機会:地域情勢別
第10章 促進要因・課題・機会・抑制要因
- 市場促進要因
- 市場の課題
- 促進要因と課題の影響
- 市場の機会・抑制要因
第11章 競合情勢
- 概要
- 競合情勢
- 混乱の状況
- 業界のリスク
第12章 競合分析
- 企業プロファイル
- 企業の市場ポジショニング
- Atlas Copco AB
- Baker Hughes Co.
- Chart Industries Inc.
- Cryostar
- General Electric Co.
- Hanwha Corp.
- Hitachi Ltd.
- IHI Corp.
- Ingersoll Rand Inc.
- Kawasaki Heavy Industries Ltd.
- KNM Group Berhad
- Mitsubishi Heavy Industries Ltd.
- Siemens AG
- Sundyne LLC
- Volkswagen AG
第13章 付録
Exhibits:
- Exhibits1: Executive Summary - Chart on Market Overview
- Exhibits2: Executive Summary - Data Table on Market Overview
- Exhibits3: Executive Summary - Chart on Global Market Characteristics
- Exhibits4: Executive Summary - Chart on Market By Geographical Landscape
- Exhibits5: Executive Summary - Chart on Market Segmentation by Application
- Exhibits6: Executive Summary - Chart on Market Segmentation by Type
- Exhibits7: Executive Summary - Chart on Incremental Growth
- Exhibits8: Executive Summary - Data Table on Incremental Growth
- Exhibits9: Executive Summary - Chart on Company Market Positioning
- Exhibits10: Parent Market
- Exhibits11: Data Table on - Parent Market
- Exhibits12: Market characteristics analysis
- Exhibits13: Value Chain Analysis
- Exhibits14: Offerings of companies included in the market definition
- Exhibits15: Market segments
- Exhibits16: Chart on Global - Market size and forecast 2023-2028 ($ million)
- Exhibits17: Data Table on Global - Market size and forecast 2023-2028 ($ million)
- Exhibits18: Chart on Global Market: Year-over-year growth 2023-2028 (%)
- Exhibits19: Data Table on Global Market: Year-over-year growth 2023-2028 (%)
- Exhibits20: Historic Market Size - Data Table on Global Integrally Geared Centrifugal Compressor Market 2018 - 2022 ($ million)
- Exhibits21: Historic Market Size - Application Segment 2018 - 2022 ($ million)
- Exhibits22: Historic Market Size - Type Segment 2018 - 2022 ($ million)
- Exhibits23: Historic Market Size - Geography Segment 2018 - 2022 ($ million)
- Exhibits24: Historic Market Size - Country Segment 2018 - 2022 ($ million)
- Exhibits25: Five forces analysis - Comparison between 2023 and 2028
- Exhibits26: Bargaining power of buyers - Impact of key factors 2023 and 2028
- Exhibits27: Bargaining power of suppliers - Impact of key factors in 2023 and 2028
- Exhibits28: Threat of new entrants - Impact of key factors in 2023 and 2028
- Exhibits29: Threat of substitutes - Impact of key factors in 2023 and 2028
- Exhibits30: Threat of rivalry - Impact of key factors in 2023 and 2028
- Exhibits31: Chart on Market condition - Five forces 2023 and 2028
- Exhibits32: Chart on Application - Market share 2023-2028 (%)
- Exhibits33: Data Table on Application - Market share 2023-2028 (%)
- Exhibits34: Chart on Comparison by Application
- Exhibits35: Data Table on Comparison by Application
- Exhibits36: Chart on Oil and gas - Market size and forecast 2023-2028 ($ million)
- Exhibits37: Data Table on Oil and gas - Market size and forecast 2023-2028 ($ million)
- Exhibits38: Chart on Oil and gas - Year-over-year growth 2023-2028 (%)
- Exhibits39: Data Table on Oil and gas - Year-over-year growth 2023-2028 (%)
- Exhibits40: Chart on Industrial gases - Market size and forecast 2023-2028 ($ million)
- Exhibits41: Data Table on Industrial gases - Market size and forecast 2023-2028 ($ million)
- Exhibits42: Chart on Industrial gases - Year-over-year growth 2023-2028 (%)
- Exhibits43: Data Table on Industrial gases - Year-over-year growth 2023-2028 (%)
- Exhibits44: Chart on Chemical/petrochemical - Market size and forecast 2023-2028 ($ million)
- Exhibits45: Data Table on Chemical/petrochemical - Market size and forecast 2023-2028 ($ million)
- Exhibits46: Chart on Chemical/petrochemical - Year-over-year growth 2023-2028 (%)
- Exhibits47: Data Table on Chemical/petrochemical - Year-over-year growth 2023-2028 (%)
- Exhibits48: Chart on Power generation - Market size and forecast 2023-2028 ($ million)
- Exhibits49: Data Table on Power generation - Market size and forecast 2023-2028 ($ million)
- Exhibits50: Chart on Power generation - Year-over-year growth 2023-2028 (%)
- Exhibits51: Data Table on Power generation - Year-over-year growth 2023-2028 (%)
- Exhibits52: Chart on Others - Market size and forecast 2023-2028 ($ million)
- Exhibits53: Data Table on Others - Market size and forecast 2023-2028 ($ million)
- Exhibits54: Chart on Others - Year-over-year growth 2023-2028 (%)
- Exhibits55: Data Table on Others - Year-over-year growth 2023-2028 (%)
- Exhibits56: Market opportunity by Application ($ million)
- Exhibits57: Data Table on Market opportunity by Application ($ million)
- Exhibits58: Chart on Type - Market share 2023-2028 (%)
- Exhibits59: Data Table on Type - Market share 2023-2028 (%)
- Exhibits60: Chart on Comparison by Type
- Exhibits61: Data Table on Comparison by Type
- Exhibits62: Chart on Custom-based - Market size and forecast 2023-2028 ($ million)
- Exhibits63: Data Table on Custom-based - Market size and forecast 2023-2028 ($ million)
- Exhibits64: Chart on Custom-based - Year-over-year growth 2023-2028 (%)
- Exhibits65: Data Table on Custom-based - Year-over-year growth 2023-2028 (%)
- Exhibits66: Chart on Modular - Market size and forecast 2023-2028 ($ million)
- Exhibits67: Data Table on Modular - Market size and forecast 2023-2028 ($ million)
- Exhibits68: Chart on Modular - Year-over-year growth 2023-2028 (%)
- Exhibits69: Data Table on Modular - Year-over-year growth 2023-2028 (%)
- Exhibits70: Market opportunity by Type ($ million)
- Exhibits71: Data Table on Market opportunity by Type ($ million)
- Exhibits72: Analysis of price sensitivity, lifecycle, customer purchase basket, adoption rates, and purchase criteria
- Exhibits73: Chart on Market share By Geographical Landscape 2023-2028 (%)
- Exhibits74: Data Table on Market share By Geographical Landscape 2023-2028 (%)
- Exhibits75: Chart on Geographic comparison
- Exhibits76: Data Table on Geographic comparison
- Exhibits77: Chart on APAC - Market size and forecast 2023-2028 ($ million)
- Exhibits78: Data Table on APAC - Market size and forecast 2023-2028 ($ million)
- Exhibits79: Chart on APAC - Year-over-year growth 2023-2028 (%)
- Exhibits80: Data Table on APAC - Year-over-year growth 2023-2028 (%)
- Exhibits81: Chart on Europe - Market size and forecast 2023-2028 ($ million)
- Exhibits82: Data Table on Europe - Market size and forecast 2023-2028 ($ million)
- Exhibits83: Chart on Europe - Year-over-year growth 2023-2028 (%)
- Exhibits84: Data Table on Europe - Year-over-year growth 2023-2028 (%)
- Exhibits85: Chart on North America - Market size and forecast 2023-2028 ($ million)
- Exhibits86: Data Table on North America - Market size and forecast 2023-2028 ($ million)
- Exhibits87: Chart on North America - Year-over-year growth 2023-2028 (%)
- Exhibits88: Data Table on North America - Year-over-year growth 2023-2028 (%)
- Exhibits89: Chart on Middle East and Africa - Market size and forecast 2023-2028 ($ million)
- Exhibits90: Data Table on Middle East and Africa - Market size and forecast 2023-2028 ($ million)
- Exhibits91: Chart on Middle East and Africa - Year-over-year growth 2023-2028 (%)
- Exhibits92: Data Table on Middle East and Africa - Year-over-year growth 2023-2028 (%)
- Exhibits93: Chart on South America - Market size and forecast 2023-2028 ($ million)
- Exhibits94: Data Table on South America - Market size and forecast 2023-2028 ($ million)
- Exhibits95: Chart on South America - Year-over-year growth 2023-2028 (%)
- Exhibits96: Data Table on South America - Year-over-year growth 2023-2028 (%)
- Exhibits97: Chart on US - Market size and forecast 2023-2028 ($ million)
- Exhibits98: Data Table on US - Market size and forecast 2023-2028 ($ million)
- Exhibits99: Chart on US - Year-over-year growth 2023-2028 (%)
- Exhibits100: Data Table on US - Year-over-year growth 2023-2028 (%)
- Exhibits101: Chart on China - Market size and forecast 2023-2028 ($ million)
- Exhibits102: Data Table on China - Market size and forecast 2023-2028 ($ million)
- Exhibits103: Chart on China - Year-over-year growth 2023-2028 (%)
- Exhibits104: Data Table on China - Year-over-year growth 2023-2028 (%)
- Exhibits105: Chart on Japan - Market size and forecast 2023-2028 ($ million)
- Exhibits106: Data Table on Japan - Market size and forecast 2023-2028 ($ million)
- Exhibits107: Chart on Japan - Year-over-year growth 2023-2028 (%)
- Exhibits108: Data Table on Japan - Year-over-year growth 2023-2028 (%)
- Exhibits109: Chart on India - Market size and forecast 2023-2028 ($ million)
- Exhibits110: Data Table on India - Market size and forecast 2023-2028 ($ million)
- Exhibits111: Chart on India - Year-over-year growth 2023-2028 (%)
- Exhibits112: Data Table on India - Year-over-year growth 2023-2028 (%)
- Exhibits113: Chart on Canada - Market size and forecast 2023-2028 ($ million)
- Exhibits114: Data Table on Canada - Market size and forecast 2023-2028 ($ million)
- Exhibits115: Chart on Canada - Year-over-year growth 2023-2028 (%)
- Exhibits116: Data Table on Canada - Year-over-year growth 2023-2028 (%)
- Exhibits117: Market opportunity By Geographical Landscape ($ million)
- Exhibits118: Data Tables on Market opportunity By Geographical Landscape ($ million)
- Exhibits119: Impact of drivers and challenges in 2023 and 2028
- Exhibits120: Overview on criticality of inputs and factors of differentiation
- Exhibits121: Overview on factors of disruption
- Exhibits122: Impact of key risks on business
- Exhibits123: Companies covered
- Exhibits124: Matrix on companies position and classification
- Exhibits125: Atlas Copco AB - Overview
- Exhibits126: Atlas Copco AB - Business segments
- Exhibits127: Atlas Copco AB - Key news
- Exhibits128: Atlas Copco AB - Key offerings
- Exhibits129: Atlas Copco AB - Segment focus
- Exhibits130: Baker Hughes Co. - Overview
- Exhibits131: Baker Hughes Co. - Business segments
- Exhibits132: Baker Hughes Co. - Key news
- Exhibits133: Baker Hughes Co. - Key offerings
- Exhibits134: Baker Hughes Co. - Segment focus
- Exhibits135: Chart Industries Inc. - Overview
- Exhibits136: Chart Industries Inc. - Business segments
- Exhibits137: Chart Industries Inc. - Key news
- Exhibits138: Chart Industries Inc. - Key offerings
- Exhibits139: Chart Industries Inc. - Segment focus
- Exhibits140: Cryostar - Overview
- Exhibits141: Cryostar - Product / Service
- Exhibits142: Cryostar - Key offerings
- Exhibits143: General Electric Co. - Overview
- Exhibits144: General Electric Co. - Business segments
- Exhibits145: General Electric Co. - Key news
- Exhibits146: General Electric Co. - Key offerings
- Exhibits147: General Electric Co. - Segment focus
- Exhibits148: Hanwha Corp. - Overview
- Exhibits149: Hanwha Corp. - Product / Service
- Exhibits150: Hanwha Corp. - Key news
- Exhibits151: Hanwha Corp. - Key offerings
- Exhibits152: Hitachi Ltd. - Overview
- Exhibits153: Hitachi Ltd. - Business segments
- Exhibits154: Hitachi Ltd. - Key news
- Exhibits155: Hitachi Ltd. - Key offerings
- Exhibits156: Hitachi Ltd. - Segment focus
- Exhibits157: IHI Corp. - Overview
- Exhibits158: IHI Corp. - Business segments
- Exhibits159: IHI Corp. - Key offerings
- Exhibits160: IHI Corp. - Segment focus
- Exhibits161: Ingersoll Rand Inc. - Overview
- Exhibits162: Ingersoll Rand Inc. - Business segments
- Exhibits163: Ingersoll Rand Inc. - Key news
- Exhibits164: Ingersoll Rand Inc. - Key offerings
- Exhibits165: Ingersoll Rand Inc. - Segment focus
- Exhibits166: Kawasaki Heavy Industries Ltd. - Overview
- Exhibits167: Kawasaki Heavy Industries Ltd. - Business segments
- Exhibits168: Kawasaki Heavy Industries Ltd. - Key offerings
- Exhibits169: Kawasaki Heavy Industries Ltd. - Segment focus
- Exhibits170: KNM Group Berhad - Overview
- Exhibits171: KNM Group Berhad - Business segments
- Exhibits172: KNM Group Berhad - Key offerings
- Exhibits173: KNM Group Berhad - Segment focus
- Exhibits174: Mitsubishi Heavy Industries Ltd. - Overview
- Exhibits175: Mitsubishi Heavy Industries Ltd. - Business segments
- Exhibits176: Mitsubishi Heavy Industries Ltd. - Key news
- Exhibits177: Mitsubishi Heavy Industries Ltd. - Key offerings
- Exhibits178: Mitsubishi Heavy Industries Ltd. - Segment focus
- Exhibits179: Siemens AG - Overview
- Exhibits180: Siemens AG - Business segments
- Exhibits181: Siemens AG - Key news
- Exhibits182: Siemens AG - Key offerings
- Exhibits183: Siemens AG - Segment focus
- Exhibits184: Sundyne LLC - Overview
- Exhibits185: Sundyne LLC - Product / Service
- Exhibits186: Sundyne LLC - Key offerings
- Exhibits187: Volkswagen AG - Overview
- Exhibits188: Volkswagen AG - Business segments
- Exhibits189: Volkswagen AG - Key news
- Exhibits190: Volkswagen AG - Key offerings
- Exhibits191: Volkswagen AG - Segment focus
- Exhibits192: Inclusions checklist
- Exhibits193: Exclusions checklist
- Exhibits194: Currency conversion rates for US$
- Exhibits195: Research methodology
- Exhibits196: Information sources
- Exhibits197: Data validation
- Exhibits198: Validation techniques employed for market sizing
- Exhibits199: Data synthesis
- Exhibits200: 360 degree market analysis
- Exhibits201: List of abbreviations
The integrally geared centrifugal compressor market is forecasted to grow by USD 649.7 mn during 2023-2028, accelerating at a CAGR of 6.78% during the forecast period. The report on the integrally geared centrifugal compressor market provides a holistic analysis, market size and forecast, trends, growth drivers, and challenges, as well as vendor analysis covering around 25 vendors.
The report offers an up-to-date analysis regarding the current market scenario, the latest trends and drivers, and the overall market environment. The market is driven by rising demand from oil and gas industry, increasing need for energy-efficient compressor systems, and growing importance of increasing efficiency of machinery and reducing operational costs.
Technavio's integrally geared centrifugal compressor market is segmented as below:
| Market Scope | |
|---|---|
| Base Year | 2024 |
| End Year | 2028 |
| Series Year | 2024-2028 |
| Growth Momentum | Accelerate |
| YOY 2024 | 6.24% |
| CAGR | 6.78% |
| Incremental Value | $649.7mn |
By Application
- Oil and gas
- Industrial gases
- Chemical/petrochemical
- Power generation
- Others
By Type
- Custom-based
- Modular
By Geographical Landscape
- APAC
- Europe
- North America
- Middle East and Africa
- South America
This study identifies the increasing r and d and m and a (merger & acquisitions) as one of the prime reasons driving the integrally geared centrifugal compressor market growth during the next few years. Also, growing use of tier-4 engines and increasing prevalence of carbon capture plants will lead to sizable demand in the market.
The report on the integrally geared centrifugal compressor market covers the following areas:
- Integrally geared centrifugal compressor market sizing
- Integrally geared centrifugal compressor market forecast
- Integrally geared centrifugal compressor market industry analysis
The robust vendor analysis is designed to help clients improve their market position, and in line with this, this report provides a detailed analysis of several leading integrally geared centrifugal compressor market vendors that include Atlas Copco AB, Baker Hughes Co., Chart Industries Inc., Cryostar, FS ELLIOTT Co. LLC, Fu Sheng Industrial Co. Ltd., General Electric Co., Hanwha Corp., Hitachi Ltd., HMS Hydraulic Machines and Systems Group PLC, IHI Corp., Ingersoll Rand Inc., Kawasaki Heavy Industries Ltd., KNM Group Berhad, Kobe Steel Ltd., Mitsubishi Heavy Industries Ltd., Nanjing SAG Equipment Co. Ltd., Siemens AG, Sundyne LLC, and Volkswagen AG. Also, the integrally geared centrifugal compressor market analysis report includes information on upcoming trends and challenges that will influence market growth. This is to help companies strategize and leverage all forthcoming growth opportunities.
The study was conducted using an objective combination of primary and secondary information including inputs from key participants in the industry. The report contains a comprehensive market and vendor landscape in addition to an analysis of the key vendors.
The publisher presents a detailed picture of the market by the way of study, synthesis, and summation of data from multiple sources by an analysis of key parameters such as profit, pricing, competition, and promotions. It presents various market facets by identifying the key industry influencers. The data presented is comprehensive, reliable, and a result of extensive research - both primary and secondary. The market research reports provide a complete competitive landscape and an in-depth vendor selection methodology and analysis using qualitative and quantitative research to forecast the accurate market growth.
Table of Contents
1 Executive Summary
- 1.1 Market overview
- Executive Summary - Chart on Market Overview
- Executive Summary - Data Table on Market Overview
- Executive Summary - Chart on Global Market Characteristics
- Executive Summary - Chart on Market By Geographical Landscape
- Executive Summary - Chart on Market Segmentation by Application
- Executive Summary - Chart on Market Segmentation by Type
- Executive Summary - Chart on Incremental Growth
- Executive Summary - Data Table on Incremental Growth
- Executive Summary - Chart on Company Market Positioning
2 Market Landscape
- 2.1 Market ecosystem
- Parent Market
- Data Table on - Parent Market
- 2.2 Market characteristics
- Market characteristics analysis
- 2.3 Value chain analysis
- Value Chain Analysis
3 Market Sizing
- 3.1 Market definition
- Offerings of companies included in the market definition
- 3.2 Market segment analysis
- Market segments
- 3.3 Market size 2023
- 3.4 Market outlook: Forecast for 2023-2028
- Chart on Global - Market size and forecast 2023-2028 ($ million)
- Data Table on Global - Market size and forecast 2023-2028 ($ million)
- Chart on Global Market: Year-over-year growth 2023-2028 (%)
- Data Table on Global Market: Year-over-year growth 2023-2028 (%)
4 Historic Market Size
- 4.1 Global Integrally Geared Centrifugal Compressor Market 2018 - 2022
- Historic Market Size - Data Table on Global Integrally Geared Centrifugal Compressor Market 2018 - 2022 ($ million)
- 4.2 Application segment analysis 2018 - 2022
- Historic Market Size - Application Segment 2018 - 2022 ($ million)
- 4.3 Type segment analysis 2018 - 2022
- Historic Market Size - Type Segment 2018 - 2022 ($ million)
- 4.4 Geography segment analysis 2018 - 2022
- Historic Market Size - Geography Segment 2018 - 2022 ($ million)
- 4.5 Country segment analysis 2018 - 2022
- Historic Market Size - Country Segment 2018 - 2022 ($ million)
5 Five Forces Analysis
- 5.1 Five forces summary
- Five forces analysis - Comparison between 2023 and 2028
- 5.2 Bargaining power of buyers
- Bargaining power of buyers - Impact of key factors 2023 and 2028
- 5.3 Bargaining power of suppliers
- Bargaining power of suppliers - Impact of key factors in 2023 and 2028
- 5.4 Threat of new entrants
- Threat of new entrants - Impact of key factors in 2023 and 2028
- 5.5 Threat of substitutes
- Threat of substitutes - Impact of key factors in 2023 and 2028
- 5.6 Threat of rivalry
- Threat of rivalry - Impact of key factors in 2023 and 2028
- 5.7 Market condition
- Chart on Market condition - Five forces 2023 and 2028
6 Market Segmentation by Application
- 6.1 Market segments
- Chart on Application - Market share 2023-2028 (%)
- Data Table on Application - Market share 2023-2028 (%)
- 6.2 Comparison by Application
- Chart on Comparison by Application
- Data Table on Comparison by Application
- 6.3 Oil and gas - Market size and forecast 2023-2028
- Chart on Oil and gas - Market size and forecast 2023-2028 ($ million)
- Data Table on Oil and gas - Market size and forecast 2023-2028 ($ million)
- Chart on Oil and gas - Year-over-year growth 2023-2028 (%)
- Data Table on Oil and gas - Year-over-year growth 2023-2028 (%)
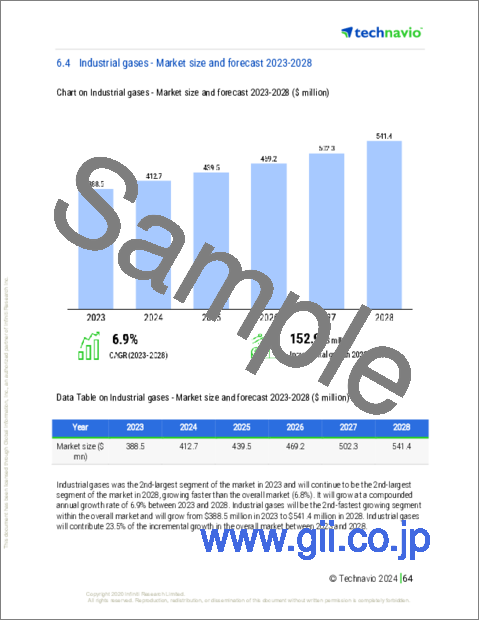
- 6.4 Industrial gases - Market size and forecast 2023-2028
- Chart on Industrial gases - Market size and forecast 2023-2028 ($ million)
- Data Table on Industrial gases - Market size and forecast 2023-2028 ($ million)
- Chart on Industrial gases - Year-over-year growth 2023-2028 (%)
- Data Table on Industrial gases - Year-over-year growth 2023-2028 (%)
- 6.5 Chemical/petrochemical - Market size and forecast 2023-2028
- Chart on Chemical/petrochemical - Market size and forecast 2023-2028 ($ million)
- Data Table on Chemical/petrochemical - Market size and forecast 2023-2028 ($ million)
- Chart on Chemical/petrochemical - Year-over-year growth 2023-2028 (%)
- Data Table on Chemical/petrochemical - Year-over-year growth 2023-2028 (%)
- 6.6 Power generation - Market size and forecast 2023-2028
- Chart on Power generation - Market size and forecast 2023-2028 ($ million)
- Data Table on Power generation - Market size and forecast 2023-2028 ($ million)
- Chart on Power generation - Year-over-year growth 2023-2028 (%)
- Data Table on Power generation - Year-over-year growth 2023-2028 (%)
- 6.7 Others - Market size and forecast 2023-2028
- Chart on Others - Market size and forecast 2023-2028 ($ million)
- Data Table on Others - Market size and forecast 2023-2028 ($ million)
- Chart on Others - Year-over-year growth 2023-2028 (%)
- Data Table on Others - Year-over-year growth 2023-2028 (%)
- 6.8 Market opportunity by Application
- Market opportunity by Application ($ million)
- Data Table on Market opportunity by Application ($ million)
7 Market Segmentation by Type
- 7.1 Market segments
- Chart on Type - Market share 2023-2028 (%)
- Data Table on Type - Market share 2023-2028 (%)
- 7.2 Comparison by Type
- Chart on Comparison by Type
- Data Table on Comparison by Type
- 7.3 Custom-based - Market size and forecast 2023-2028
- Chart on Custom-based - Market size and forecast 2023-2028 ($ million)
- Data Table on Custom-based - Market size and forecast 2023-2028 ($ million)
- Chart on Custom-based - Year-over-year growth 2023-2028 (%)
- Data Table on Custom-based - Year-over-year growth 2023-2028 (%)
- 7.4 Modular - Market size and forecast 2023-2028
- Chart on Modular - Market size and forecast 2023-2028 ($ million)
- Data Table on Modular - Market size and forecast 2023-2028 ($ million)
- Chart on Modular - Year-over-year growth 2023-2028 (%)
- Data Table on Modular - Year-over-year growth 2023-2028 (%)
- 7.5 Market opportunity by Type
- Market opportunity by Type ($ million)
- Data Table on Market opportunity by Type ($ million)
8 Customer Landscape
- 8.1 Customer landscape overview
- Analysis of price sensitivity, lifecycle, customer purchase basket, adoption rates, and purchase criteria
9 Geographic Landscape
- 9.1 Geographic segmentation
- Chart on Market share By Geographical Landscape 2023-2028 (%)
- Data Table on Market share By Geographical Landscape 2023-2028 (%)
- 9.2 Geographic comparison
- Chart on Geographic comparison
- Data Table on Geographic comparison
- 9.3 APAC - Market size and forecast 2023-2028
- Chart on APAC - Market size and forecast 2023-2028 ($ million)
- Data Table on APAC - Market size and forecast 2023-2028 ($ million)
- Chart on APAC - Year-over-year growth 2023-2028 (%)
- Data Table on APAC - Year-over-year growth 2023-2028 (%)
- 9.4 Europe - Market size and forecast 2023-2028
- Chart on Europe - Market size and forecast 2023-2028 ($ million)
- Data Table on Europe - Market size and forecast 2023-2028 ($ million)
- Chart on Europe - Year-over-year growth 2023-2028 (%)
- Data Table on Europe - Year-over-year growth 2023-2028 (%)
- 9.5 North America - Market size and forecast 2023-2028
- Chart on North America - Market size and forecast 2023-2028 ($ million)
- Data Table on North America - Market size and forecast 2023-2028 ($ million)
- Chart on North America - Year-over-year growth 2023-2028 (%)
- Data Table on North America - Year-over-year growth 2023-2028 (%)
- 9.6 Middle East and Africa - Market size and forecast 2023-2028
- Chart on Middle East and Africa - Market size and forecast 2023-2028 ($ million)
- Data Table on Middle East and Africa - Market size and forecast 2023-2028 ($ million)
- Chart on Middle East and Africa - Year-over-year growth 2023-2028 (%)
- Data Table on Middle East and Africa - Year-over-year growth 2023-2028 (%)
- 9.7 South America - Market size and forecast 2023-2028
- Chart on South America - Market size and forecast 2023-2028 ($ million)
- Data Table on South America - Market size and forecast 2023-2028 ($ million)
- Chart on South America - Year-over-year growth 2023-2028 (%)
- Data Table on South America - Year-over-year growth 2023-2028 (%)
- 9.8 US - Market size and forecast 2023-2028
- Chart on US - Market size and forecast 2023-2028 ($ million)
- Data Table on US - Market size and forecast 2023-2028 ($ million)
- Chart on US - Year-over-year growth 2023-2028 (%)
- Data Table on US - Year-over-year growth 2023-2028 (%)
- 9.9 China - Market size and forecast 2023-2028
- Chart on China - Market size and forecast 2023-2028 ($ million)
- Data Table on China - Market size and forecast 2023-2028 ($ million)
- Chart on China - Year-over-year growth 2023-2028 (%)
- Data Table on China - Year-over-year growth 2023-2028 (%)
- 9.10 Japan - Market size and forecast 2023-2028
- Chart on Japan - Market size and forecast 2023-2028 ($ million)
- Data Table on Japan - Market size and forecast 2023-2028 ($ million)
- Chart on Japan - Year-over-year growth 2023-2028 (%)
- Data Table on Japan - Year-over-year growth 2023-2028 (%)
- 9.11 India - Market size and forecast 2023-2028
- Chart on India - Market size and forecast 2023-2028 ($ million)
- Data Table on India - Market size and forecast 2023-2028 ($ million)
- Chart on India - Year-over-year growth 2023-2028 (%)
- Data Table on India - Year-over-year growth 2023-2028 (%)
- 9.12 Canada - Market size and forecast 2023-2028
- Chart on Canada - Market size and forecast 2023-2028 ($ million)
- Data Table on Canada - Market size and forecast 2023-2028 ($ million)
- Chart on Canada - Year-over-year growth 2023-2028 (%)
- Data Table on Canada - Year-over-year growth 2023-2028 (%)
- 9.13 Market opportunity By Geographical Landscape
- Market opportunity By Geographical Landscape ($ million)
- Data Tables on Market opportunity By Geographical Landscape ($ million)
10 Drivers, Challenges, and Opportunity/Restraints
- 10.1 Market drivers
- 10.2 Market challenges
- 10.3 Impact of drivers and challenges
- Impact of drivers and challenges in 2023 and 2028
- 10.4 Market opportunities/restraints
11 Competitive Landscape
- 11.1 Overview
- 11.2 Competitive Landscape
- Overview on criticality of inputs and factors of differentiation
- 11.3 Landscape disruption
- Overview on factors of disruption
- 11.4 Industry risks
- Impact of key risks on business
12 Competitive Analysis
- 12.1 Companies profiled
- Companies covered
- 12.2 Market positioning of companies
- Matrix on companies position and classification
- 12.3 Atlas Copco AB
- Atlas Copco AB - Overview
- Atlas Copco AB - Business segments
- Atlas Copco AB - Key news
- Atlas Copco AB - Key offerings
- Atlas Copco AB - Segment focus
- 12.4 Baker Hughes Co.
- Baker Hughes Co. - Overview
- Baker Hughes Co. - Business segments
- Baker Hughes Co. - Key news
- Baker Hughes Co. - Key offerings
- Baker Hughes Co. - Segment focus
- 12.5 Chart Industries Inc.
- Chart Industries Inc. - Overview
- Chart Industries Inc. - Business segments
- Chart Industries Inc. - Key news
- Chart Industries Inc. - Key offerings
- Chart Industries Inc. - Segment focus
- 12.6 Cryostar
- Cryostar - Overview
- Cryostar - Product / Service
- Cryostar - Key offerings
- 12.7 General Electric Co.
- General Electric Co. - Overview
- General Electric Co. - Business segments
- General Electric Co. - Key news
- General Electric Co. - Key offerings
- General Electric Co. - Segment focus
- 12.8 Hanwha Corp.
- Hanwha Corp. - Overview
- Hanwha Corp. - Product / Service
- Hanwha Corp. - Key news
- Hanwha Corp. - Key offerings
- 12.9 Hitachi Ltd.
- Hitachi Ltd. - Overview
- Hitachi Ltd. - Business segments
- Hitachi Ltd. - Key news
- Hitachi Ltd. - Key offerings
- Hitachi Ltd. - Segment focus
- 12.10 IHI Corp.
- IHI Corp. - Overview
- IHI Corp. - Business segments
- IHI Corp. - Key offerings
- IHI Corp. - Segment focus
- 12.11 Ingersoll Rand Inc.
- Ingersoll Rand Inc. - Overview
- Ingersoll Rand Inc. - Business segments
- Ingersoll Rand Inc. - Key news
- Ingersoll Rand Inc. - Key offerings
- Ingersoll Rand Inc. - Segment focus
- 12.12 Kawasaki Heavy Industries Ltd.
- Kawasaki Heavy Industries Ltd. - Overview
- Kawasaki Heavy Industries Ltd. - Business segments
- Kawasaki Heavy Industries Ltd. - Key offerings
- Kawasaki Heavy Industries Ltd. - Segment focus
- 12.13 KNM Group Berhad
- KNM Group Berhad - Overview
- KNM Group Berhad - Business segments
- KNM Group Berhad - Key offerings
- KNM Group Berhad - Segment focus
- 12.14 Mitsubishi Heavy Industries Ltd.
- Mitsubishi Heavy Industries Ltd. - Overview
- Mitsubishi Heavy Industries Ltd. - Business segments
- Mitsubishi Heavy Industries Ltd. - Key news
- Mitsubishi Heavy Industries Ltd. - Key offerings
- Mitsubishi Heavy Industries Ltd. - Segment focus
- 12.15 Siemens AG
- Siemens AG - Overview
- Siemens AG - Business segments
- Siemens AG - Key news
- Siemens AG - Key offerings
- Siemens AG - Segment focus
- 12.16 Sundyne LLC
- Sundyne LLC - Overview
- Sundyne LLC - Product / Service
- Sundyne LLC - Key offerings
- 12.17 Volkswagen AG
- Volkswagen AG - Overview
- Volkswagen AG - Business segments
- Volkswagen AG - Key news
- Volkswagen AG - Key offerings
- Volkswagen AG - Segment focus
13 Appendix
- 13.1 Scope of the report
- 13.2 Inclusions and exclusions checklist
- Inclusions checklist
- Exclusions checklist
- 13.3 Currency conversion rates for US$
- Currency conversion rates for US$
- 13.4 Research methodology
- Research methodology
- 13.5 Data procurement
- Information sources
- 13.6 Data validation
- Data validation
- 13.7 Validation techniques employed for market sizing
- Validation techniques employed for market sizing
- 13.8 Data synthesis
- Data synthesis
- 13.9 360 degree market analysis
- 360 degree market analysis
- 13.10 List of abbreviations
- List of abbreviations
