|
|
市場調査レポート
商品コード
1727134
海水淡水化の世界市場 2025-2029Global Desalination Market 2025-2029 |
||||||

|
|||||||
カスタマイズ可能
|
|||||||

| 海水淡水化の世界市場 2025-2029 |
|
出版日: 2025年05月08日
発行: TechNavio
ページ情報: 英文 219 Pages
納期: 即納可能
|

全表示
- 概要
- 図表
- 目次
海水淡水化市場は2024-2029年に104億1,320万米ドル、予測期間中のCAGRは8.9%で成長すると予測されます。
当レポートでは、海水淡水化市場の全体的な分析、市場規模・予測、動向、成長促進要因、課題、約25のベンダーを網羅したベンダー分析などを掲載しています。
現在の市場シナリオ、最新動向と促進要因、市場環境全体に関する最新分析を提供しています。市場を牽引するのは、人口増加と飲料水需要の増加、気候条件の変化と投資の増加、膜技術に対する需要の増加などです。
| 市場範囲 | |
|---|---|
| 基準年 | 2025 |
| 終了年 | 2029 |
| 予測期間 | 2025-2029 |
| 成長モメンタム | 加速 |
| 前年比 | 8% |
| CAGR | 8.9% |
| 増分額 | 104億1,320万米ドル |
本調査は、業界の主要参加者からのインプットを含め、一次情報と二次情報を客観的に組み合わせて実施しました。レポートには、主要企業の分析に加え、包括的な市場規模データ、地域別分析によるセグメント、ベンダー情勢が含まれています。レポートには過去データと予測データがあります。
本調査では、今後数年間における海水淡水化市場の成長を促進する主な要因の一つとして、再生可能電源の利用増加を挙げています。また、順浸透、ナノろ過、その他の高性能膜ベースの技術の人気の高まりとエネルギー回収技術の進歩は、市場の大きな需要につながります。
目次
第1章 エグゼクティブサマリー
- 市場概要
第2章 Technavio分析
- 価格・ライフサイクル・顧客購入バスケット・採用率・購入基準の分析
- インプットの重要性と差別化の要因
- 混乱の要因
- 促進要因と課題の影響
第3章 市場情勢
- 市場エコシステム
- 市場の特徴
- バリューチェーン分析
第4章 市場規模
- 市場の定義
- 市場セグメント分析
- 市場規模 2024
- 市場の見通し 2024-2029
第5章 市場規模実績
- 海水淡水化の世界市場 2019-2023
- 技術セグメント分析 2019-2023
- 用途別セグメント分析 2019-2023
- ソースセグメント分析 2019-2023
- 地域別セグメント分析 2019-2023
- 国別セグメント分析 2019-2023
第6章 定性分析
- AIの影響:海水淡水化の世界市場
第7章 ファイブフォース分析
- ファイブフォースの要約
- 買い手の交渉力
- 供給企業の交渉力
- 新規参入業者の脅威
- 代替品の脅威
- 競争の脅威
- 市況
第8章 市場セグメンテーション:技術別
- 市場セグメント
- 比較:技術別
- 膜:市場規模と予測 2024-2029
- サーマル:市場規模と予測 2024-2029
- 市場機会:技術別
第9章 市場セグメンテーション:用途別
- 市場セグメント
- 比較:用途別
- 市営:市場規模と予測 2024-2029
- 産業:市場規模と予測 2024-2029
- その他:市場規模と予測 2024-2029
- 市場機会:用途別
第10章 市場セグメンテーション:ソース別
- 市場セグメント
- 比較:ソース別
- 海水:市場規模と予測 2024-2029
- 汽水:市場規模と予測 2024-2029
- 市場機会:ソース別
第11章 顧客情勢
- 顧客情勢の概要
第12章 地域別情勢
- 地域別セグメンテーション
- 地域別比較
- 中東・アフリカ:市場規模と予測 2024-2029
- アジア太平洋:市場規模と予測 2024-2029
- 北米:市場規模と予測 2024-2029
- 欧州:市場規模と予測 2024-2029
- 南米:市場規模と予測 2024-2029
- サウジアラビア:市場規模と予測 2024-2029
- アラブ首長国連邦:市場規模と予測 2024-2029
- 米国:市場規模と予測 2024-2029
- 南アフリカ:市場規模と予測 2024-2029
- 中国:市場規模と予測 2024-2029
- エジプト:市場規模と予測 2024-2029
- 日本:市場規模と予測 2024-2029
- ナイジェリア:市場規模と予測 2024-2029
- 韓国:市場規模と予測 2024-2029
- インド:市場規模と予測 2024-2029
- 市場機会:地域情勢別
第13章 促進要因・課題・機会・抑制要因
- 市場促進要因
- 市場の課題
- 促進要因と課題の影響
- 市場の機会・抑制要因
第14章 競合情勢
- 概要
- 競合情勢
- 混乱の状況
- 業界のリスク
第15章 競合分析
- 企業プロファイル
- 企業ランキング指数
- 企業の市場ポジショニング
- Acciona SA
- Asahi Kasei Corp.
- Bechtel Corp.
- Biwater Holdings Ltd.
- Consolidated Water Co. Ltd.
- Doosan Corp.
- DuPont de Nemours Inc.
- Ferrovial SA
- IDE Water Technologies
- Kurita Water Industries Ltd
- Mitsubishi Heavy Industries Ltd.
- Poseidon Water LLC
- RAI Amsterdam Aquatech
- Toyobo Co. Ltd.
- Veolia Environnement SA
第16章 付録
Exhibits:
- Exhibits1: Executive Summary - Chart on Market Overview
- Exhibits2: Executive Summary - Data Table on Market Overview
- Exhibits3: Executive Summary - Chart on Global Market Characteristics
- Exhibits4: Executive Summary - Chart on Market By Geographical Landscape
- Exhibits5: Executive Summary - Chart on Market Segmentation by Technology
- Exhibits6: Executive Summary - Chart on Market Segmentation by Application
- Exhibits7: Executive Summary - Chart on Market Segmentation by Source
- Exhibits8: Executive Summary - Chart on Incremental Growth
- Exhibits9: Executive Summary - Data Table on Incremental Growth
- Exhibits10: Executive Summary - Chart on Company Market Positioning
- Exhibits11: Analysis of price sensitivity, lifecycle, customer purchase basket, adoption rates, and purchase criteria
- Exhibits12: Overview on criticality of inputs and factors of differentiation
- Exhibits13: Overview on factors of disruption
- Exhibits14: Impact of drivers and challenges in 2024 and 2029
- Exhibits15: Parent Market
- Exhibits16: Data Table on - Parent Market
- Exhibits17: Market characteristics analysis
- Exhibits18: Value chain analysis
- Exhibits19: Offerings of companies included in the market definition
- Exhibits20: Market segments
- Exhibits21: Chart on Global - Market size and forecast 2024-2029 ($ million)
- Exhibits22: Data Table on Global - Market size and forecast 2024-2029 ($ million)
- Exhibits23: Chart on Global Market: Year-over-year growth 2024-2029 (%)
- Exhibits24: Data Table on Global Market: Year-over-year growth 2024-2029 (%)
- Exhibits25: Historic Market Size - Data Table on Global Desalination Market 2019 - 2023 ($ million)
- Exhibits26: Historic Market Size - Technology Segment 2019 - 2023 ($ million)
- Exhibits27: Historic Market Size - Application Segment 2019 - 2023 ($ million)
- Exhibits28: Historic Market Size - Source Segment 2019 - 2023 ($ million)
- Exhibits29: Historic Market Size - Geography Segment 2019 - 2023 ($ million)
- Exhibits30: Historic Market Size - Country Segment 2019 - 2023 ($ million)
- Exhibits31: Five forces analysis - Comparison between 2024 and 2029
- Exhibits32: Bargaining power of buyers - Impact of key factors 2024 and 2029
- Exhibits33: Bargaining power of suppliers - Impact of key factors in 2024 and 2029
- Exhibits34: Threat of new entrants - Impact of key factors in 2024 and 2029
- Exhibits35: Threat of substitutes - Impact of key factors in 2024 and 2029
- Exhibits36: Threat of rivalry - Impact of key factors in 2024 and 2029
- Exhibits37: Chart on Market condition - Five forces 2024 and 2029
- Exhibits38: Chart on Technology - Market share 2024-2029 (%)
- Exhibits39: Data Table on Technology - Market share 2024-2029 (%)
- Exhibits40: Chart on Comparison by Technology
- Exhibits41: Data Table on Comparison by Technology
- Exhibits42: Chart on Membrane - Market size and forecast 2024-2029 ($ million)
- Exhibits43: Data Table on Membrane - Market size and forecast 2024-2029 ($ million)
- Exhibits44: Chart on Membrane - Year-over-year growth 2024-2029 (%)
- Exhibits45: Data Table on Membrane - Year-over-year growth 2024-2029 (%)
- Exhibits46: Chart on Thermal - Market size and forecast 2024-2029 ($ million)
- Exhibits47: Data Table on Thermal - Market size and forecast 2024-2029 ($ million)
- Exhibits48: Chart on Thermal - Year-over-year growth 2024-2029 (%)
- Exhibits49: Data Table on Thermal - Year-over-year growth 2024-2029 (%)
- Exhibits50: Market opportunity by Technology ($ million)
- Exhibits51: Data Table on Market opportunity by Technology ($ million)
- Exhibits52: Chart on Application - Market share 2024-2029 (%)
- Exhibits53: Data Table on Application - Market share 2024-2029 (%)
- Exhibits54: Chart on Comparison by Application
- Exhibits55: Data Table on Comparison by Application
- Exhibits56: Chart on Municipal - Market size and forecast 2024-2029 ($ million)
- Exhibits57: Data Table on Municipal - Market size and forecast 2024-2029 ($ million)
- Exhibits58: Chart on Municipal - Year-over-year growth 2024-2029 (%)
- Exhibits59: Data Table on Municipal - Year-over-year growth 2024-2029 (%)
- Exhibits60: Chart on Industrial - Market size and forecast 2024-2029 ($ million)
- Exhibits61: Data Table on Industrial - Market size and forecast 2024-2029 ($ million)
- Exhibits62: Chart on Industrial - Year-over-year growth 2024-2029 (%)
- Exhibits63: Data Table on Industrial - Year-over-year growth 2024-2029 (%)
- Exhibits64: Chart on Others - Market size and forecast 2024-2029 ($ million)
- Exhibits65: Data Table on Others - Market size and forecast 2024-2029 ($ million)
- Exhibits66: Chart on Others - Year-over-year growth 2024-2029 (%)
- Exhibits67: Data Table on Others - Year-over-year growth 2024-2029 (%)
- Exhibits68: Market opportunity by Application ($ million)
- Exhibits69: Data Table on Market opportunity by Application ($ million)
- Exhibits70: Chart on Source - Market share 2024-2029 (%)
- Exhibits71: Data Table on Source - Market share 2024-2029 (%)
- Exhibits72: Chart on Comparison by Source
- Exhibits73: Data Table on Comparison by Source
- Exhibits74: Chart on Seawater - Market size and forecast 2024-2029 ($ million)
- Exhibits75: Data Table on Seawater - Market size and forecast 2024-2029 ($ million)
- Exhibits76: Chart on Seawater - Year-over-year growth 2024-2029 (%)
- Exhibits77: Data Table on Seawater - Year-over-year growth 2024-2029 (%)
- Exhibits78: Chart on Brackish water - Market size and forecast 2024-2029 ($ million)
- Exhibits79: Data Table on Brackish water - Market size and forecast 2024-2029 ($ million)
- Exhibits80: Chart on Brackish water - Year-over-year growth 2024-2029 (%)
- Exhibits81: Data Table on Brackish water - Year-over-year growth 2024-2029 (%)
- Exhibits82: Market opportunity by Source ($ million)
- Exhibits83: Data Table on Market opportunity by Source ($ million)
- Exhibits84: Analysis of price sensitivity, lifecycle, customer purchase basket, adoption rates, and purchase criteria
- Exhibits85: Chart on Market share By Geographical Landscape 2024-2029 (%)
- Exhibits86: Data Table on Market share By Geographical Landscape 2024-2029 (%)
- Exhibits87: Chart on Geographic comparison
- Exhibits88: Data Table on Geographic comparison
- Exhibits89: Chart on Middle East and Africa - Market size and forecast 2024-2029 ($ million)
- Exhibits90: Data Table on Middle East and Africa - Market size and forecast 2024-2029 ($ million)
- Exhibits91: Chart on Middle East and Africa - Year-over-year growth 2024-2029 (%)
- Exhibits92: Data Table on Middle East and Africa - Year-over-year growth 2024-2029 (%)
- Exhibits93: Chart on APAC - Market size and forecast 2024-2029 ($ million)
- Exhibits94: Data Table on APAC - Market size and forecast 2024-2029 ($ million)
- Exhibits95: Chart on APAC - Year-over-year growth 2024-2029 (%)
- Exhibits96: Data Table on APAC - Year-over-year growth 2024-2029 (%)
- Exhibits97: Chart on North America - Market size and forecast 2024-2029 ($ million)
- Exhibits98: Data Table on North America - Market size and forecast 2024-2029 ($ million)
- Exhibits99: Chart on North America - Year-over-year growth 2024-2029 (%)
- Exhibits100: Data Table on North America - Year-over-year growth 2024-2029 (%)
- Exhibits101: Chart on Europe - Market size and forecast 2024-2029 ($ million)
- Exhibits102: Data Table on Europe - Market size and forecast 2024-2029 ($ million)
- Exhibits103: Chart on Europe - Year-over-year growth 2024-2029 (%)
- Exhibits104: Data Table on Europe - Year-over-year growth 2024-2029 (%)
- Exhibits105: Chart on South America - Market size and forecast 2024-2029 ($ million)
- Exhibits106: Data Table on South America - Market size and forecast 2024-2029 ($ million)
- Exhibits107: Chart on South America - Year-over-year growth 2024-2029 (%)
- Exhibits108: Data Table on South America - Year-over-year growth 2024-2029 (%)
- Exhibits109: Chart on Saudi Arabia - Market size and forecast 2024-2029 ($ million)
- Exhibits110: Data Table on Saudi Arabia - Market size and forecast 2024-2029 ($ million)
- Exhibits111: Chart on Saudi Arabia - Year-over-year growth 2024-2029 (%)
- Exhibits112: Data Table on Saudi Arabia - Year-over-year growth 2024-2029 (%)
- Exhibits113: Chart on United Arab Emirates - Market size and forecast 2024-2029 ($ million)
- Exhibits114: Data Table on United Arab Emirates - Market size and forecast 2024-2029 ($ million)
- Exhibits115: Chart on United Arab Emirates - Year-over-year growth 2024-2029 (%)
- Exhibits116: Data Table on United Arab Emirates - Year-over-year growth 2024-2029 (%)
- Exhibits117: Chart on US - Market size and forecast 2024-2029 ($ million)
- Exhibits118: Data Table on US - Market size and forecast 2024-2029 ($ million)
- Exhibits119: Chart on US - Year-over-year growth 2024-2029 (%)
- Exhibits120: Data Table on US - Year-over-year growth 2024-2029 (%)
- Exhibits121: Chart on South Africa - Market size and forecast 2024-2029 ($ million)
- Exhibits122: Data Table on South Africa - Market size and forecast 2024-2029 ($ million)
- Exhibits123: Chart on South Africa - Year-over-year growth 2024-2029 (%)
- Exhibits124: Data Table on South Africa - Year-over-year growth 2024-2029 (%)
- Exhibits125: Chart on China - Market size and forecast 2024-2029 ($ million)
- Exhibits126: Data Table on China - Market size and forecast 2024-2029 ($ million)
- Exhibits127: Chart on China - Year-over-year growth 2024-2029 (%)
- Exhibits128: Data Table on China - Year-over-year growth 2024-2029 (%)
- Exhibits129: Chart on Egypt - Market size and forecast 2024-2029 ($ million)
- Exhibits130: Data Table on Egypt - Market size and forecast 2024-2029 ($ million)
- Exhibits131: Chart on Egypt - Year-over-year growth 2024-2029 (%)
- Exhibits132: Data Table on Egypt - Year-over-year growth 2024-2029 (%)
- Exhibits133: Chart on Japan - Market size and forecast 2024-2029 ($ million)
- Exhibits134: Data Table on Japan - Market size and forecast 2024-2029 ($ million)
- Exhibits135: Chart on Japan - Year-over-year growth 2024-2029 (%)
- Exhibits136: Data Table on Japan - Year-over-year growth 2024-2029 (%)
- Exhibits137: Chart on Nigeria - Market size and forecast 2024-2029 ($ million)
- Exhibits138: Data Table on Nigeria - Market size and forecast 2024-2029 ($ million)
- Exhibits139: Chart on Nigeria - Year-over-year growth 2024-2029 (%)
- Exhibits140: Data Table on Nigeria - Year-over-year growth 2024-2029 (%)
- Exhibits141: Chart on South Korea - Market size and forecast 2024-2029 ($ million)
- Exhibits142: Data Table on South Korea - Market size and forecast 2024-2029 ($ million)
- Exhibits143: Chart on South Korea - Year-over-year growth 2024-2029 (%)
- Exhibits144: Data Table on South Korea - Year-over-year growth 2024-2029 (%)
- Exhibits145: Chart on India - Market size and forecast 2024-2029 ($ million)
- Exhibits146: Data Table on India - Market size and forecast 2024-2029 ($ million)
- Exhibits147: Chart on India - Year-over-year growth 2024-2029 (%)
- Exhibits148: Data Table on India - Year-over-year growth 2024-2029 (%)
- Exhibits149: Market opportunity By Geographical Landscape ($ million)
- Exhibits150: Data Tables on Market opportunity By Geographical Landscape ($ million)
- Exhibits151: Impact of drivers and challenges in 2024 and 2029
- Exhibits152: Overview on criticality of inputs and factors of differentiation
- Exhibits153: Overview on factors of disruption
- Exhibits154: Impact of key risks on business
- Exhibits155: Companies covered
- Exhibits156: Company ranking index
- Exhibits157: Matrix on companies position and classification
- Exhibits158: Acciona SA - Overview
- Exhibits159: Acciona SA - Business segments
- Exhibits160: Acciona SA - Key news
- Exhibits161: Acciona SA - Key offerings
- Exhibits162: Acciona SA - Segment focus
- Exhibits163: SWOT
- Exhibits164: Asahi Kasei Corp. - Overview
- Exhibits165: Asahi Kasei Corp. - Business segments
- Exhibits166: Asahi Kasei Corp. - Key news
- Exhibits167: Asahi Kasei Corp. - Key offerings
- Exhibits168: Asahi Kasei Corp. - Segment focus
- Exhibits169: SWOT
- Exhibits170: Bechtel Corp. - Overview
- Exhibits171: Bechtel Corp. - Product / Service
- Exhibits172: Bechtel Corp. - Key news
- Exhibits173: Bechtel Corp. - Key offerings
- Exhibits174: SWOT
- Exhibits175: Biwater Holdings Ltd. - Overview
- Exhibits176: Biwater Holdings Ltd. - Product / Service
- Exhibits177: Biwater Holdings Ltd. - Key offerings
- Exhibits178: SWOT
- Exhibits179: Consolidated Water Co. Ltd. - Overview
- Exhibits180: Consolidated Water Co. Ltd. - Business segments
- Exhibits181: Consolidated Water Co. Ltd. - Key offerings
- Exhibits182: Consolidated Water Co. Ltd. - Segment focus
- Exhibits183: SWOT
- Exhibits184: Doosan Corp. - Overview
- Exhibits185: Doosan Corp. - Business segments
- Exhibits186: Doosan Corp. - Key news
- Exhibits187: Doosan Corp. - Key offerings
- Exhibits188: Doosan Corp. - Segment focus
- Exhibits189: SWOT
- Exhibits190: DuPont de Nemours Inc. - Overview
- Exhibits191: DuPont de Nemours Inc. - Business segments
- Exhibits192: DuPont de Nemours Inc. - Key news
- Exhibits193: DuPont de Nemours Inc. - Key offerings
- Exhibits194: DuPont de Nemours Inc. - Segment focus
- Exhibits195: SWOT
- Exhibits196: Ferrovial SA - Overview
- Exhibits197: Ferrovial SA - Business segments
- Exhibits198: Ferrovial SA - Key offerings
- Exhibits199: Ferrovial SA - Segment focus
- Exhibits200: SWOT
- Exhibits201: IDE Water Technologies - Overview
- Exhibits202: IDE Water Technologies - Product / Service
- Exhibits203: IDE Water Technologies - Key offerings
- Exhibits204: SWOT
- Exhibits205: Kurita Water Industries Ltd - Overview
- Exhibits206: Kurita Water Industries Ltd - Business segments
- Exhibits207: Kurita Water Industries Ltd - Key offerings
- Exhibits208: Kurita Water Industries Ltd - Segment focus
- Exhibits209: SWOT
- Exhibits210: Mitsubishi Heavy Industries Ltd. - Overview
- Exhibits211: Mitsubishi Heavy Industries Ltd. - Business segments
- Exhibits212: Mitsubishi Heavy Industries Ltd. - Key news
- Exhibits213: Mitsubishi Heavy Industries Ltd. - Key offerings
- Exhibits214: Mitsubishi Heavy Industries Ltd. - Segment focus
- Exhibits215: SWOT
- Exhibits216: Poseidon Water LLC - Overview
- Exhibits217: Poseidon Water LLC - Product / Service
- Exhibits218: Poseidon Water LLC - Key offerings
- Exhibits219: SWOT
- Exhibits220: RAI Amsterdam Aquatech - Overview
- Exhibits221: RAI Amsterdam Aquatech - Product / Service
- Exhibits222: RAI Amsterdam Aquatech - Key offerings
- Exhibits223: SWOT
- Exhibits224: Toyobo Co. Ltd. - Overview
- Exhibits225: Toyobo Co. Ltd. - Business segments
- Exhibits226: Toyobo Co. Ltd. - Key news
- Exhibits227: Toyobo Co. Ltd. - Key offerings
- Exhibits228: Toyobo Co. Ltd. - Segment focus
- Exhibits229: SWOT
- Exhibits230: Veolia Environnement SA - Overview
- Exhibits231: Veolia Environnement SA - Business segments
- Exhibits232: Veolia Environnement SA - Key offerings
- Exhibits233: Veolia Environnement SA - Segment focus
- Exhibits234: SWOT
- Exhibits235: Inclusions checklist
- Exhibits236: Exclusions checklist
- Exhibits237: Currency conversion rates for US$
- Exhibits238: Research methodology
- Exhibits239: Information sources
- Exhibits240: Data validation
- Exhibits241: Validation techniques employed for market sizing
- Exhibits242: Data synthesis
- Exhibits243: 360 degree market analysis
- Exhibits244: List of abbreviations
The desalination market is forecasted to grow by USD 10,413.2 mn during 2024-2029, accelerating at a CAGR of 8.9% during the forecast period. The report on the desalination market provides a holistic analysis, market size and forecast, trends, growth drivers, and challenges, as well as vendor analysis covering around 25 vendors.
The report offers an up-to-date analysis regarding the current market scenario, the latest trends and drivers, and the overall market environment. The market is driven by increase in population and rise in demand for consumable water, change in climatic conditions and increased investments, and increase in demand for membrane technology.
| Market Scope | |
|---|---|
| Base Year | 2025 |
| End Year | 2029 |
| Series Year | 2025-2029 |
| Growth Momentum | Accelerate |
| YOY 2025 | 8% |
| CAGR | 8.9% |
| Incremental Value | $10,413.2 mn |
The study was conducted using an objective combination of primary and secondary information including inputs from key participants in the industry. The report contains a comprehensive market size data, segment with regional analysis and vendor landscape in addition to an analysis of the key companies. Reports have historic and forecast data.
Technavio's desalination market is segmented as below:
By Technology
- Membrane
- Thermal
By Application
- Municipal
- Industrial
- Others
By Source
- Seawater
- Brackish water
By Geographical Landscape
- Middle East and Africa
- APAC
- North America
- Europe
- South America
This study identifies the increasing use of renewable power sources as one of the prime reasons driving the desalination market growth during the next few years. Also, rising popularity of forward osmosis, nanofiltration, and other high-performance membrane-based technologies and advances in energy-recovery techniques will lead to sizable demand in the market.
The report on the desalination market covers the following areas:
- Desalination Market sizing
- Desalination Market forecast
- Desalination Market industry analysis
The robust vendor analysis is designed to help clients improve their market position, and in line with this, this report provides a detailed analysis of several leading desalination market vendors that include Acciona SA, Asahi Kasei Corp., Bechtel Corp., Biwater Holdings Ltd., Consolidated Water Co. Ltd., Doosan Corp., DuPont de Nemours Inc., Ferrovial SA, IDE Water Technologies, Kurita Water Industries Ltd, Mitsubishi Heavy Industries Ltd., Osmoflo, Poseidon Water LLC, ProMinent GmbH, RAI Amsterdam Aquatech, TEMAK SA, Toyobo Co. Ltd., Veolia Environnement SA, and Webuild. Also, the desalination market analysis report includes information on upcoming trends and challenges that will influence market growth. This is to help companies strategize and leverage all forthcoming growth opportunities.
The publisher presents a detailed picture of the market by the way of study, synthesis, and summation of data from multiple sources by an analysis of key parameters such as profit, pricing, competition, and promotions. It presents various market facets by identifying the key industry influencers. The data presented is comprehensive, reliable, and a result of extensive primary and secondary research. The market research reports provide a complete competitive landscape and an in-depth vendor selection methodology and analysis using qualitative and quantitative research to forecast accurate market growth.
Table of Contents
1 Executive Summary
- 1.1 Market overview
- Executive Summary - Chart on Market Overview
- Executive Summary - Data Table on Market Overview
- Executive Summary - Chart on Global Market Characteristics
- Executive Summary - Chart on Market By Geographical Landscape
- Executive Summary - Chart on Market Segmentation by Technology
- Executive Summary - Chart on Market Segmentation by Application
- Executive Summary - Chart on Market Segmentation by Source
- Executive Summary - Chart on Incremental Growth
- Executive Summary - Data Table on Incremental Growth
- Executive Summary - Chart on Company Market Positioning
2 Technavio Analysis
- 2.1 Analysis of price sensitivity, lifecycle, customer purchase basket, adoption rates, and purchase criteria
- Analysis of price sensitivity, lifecycle, customer purchase basket, adoption rates, and purchase criteria
- 2.2 Criticality of inputs and Factors of differentiation
- Overview on criticality of inputs and factors of differentiation
- 2.3 Factors of disruption
- Overview on factors of disruption
- 2.4 Impact of drivers and challenges
- Impact of drivers and challenges in 2024 and 2029
3 Market Landscape
- 3.1 Market ecosystem
- Parent Market
- Data Table on - Parent Market
- 3.2 Market characteristics
- Market characteristics analysis
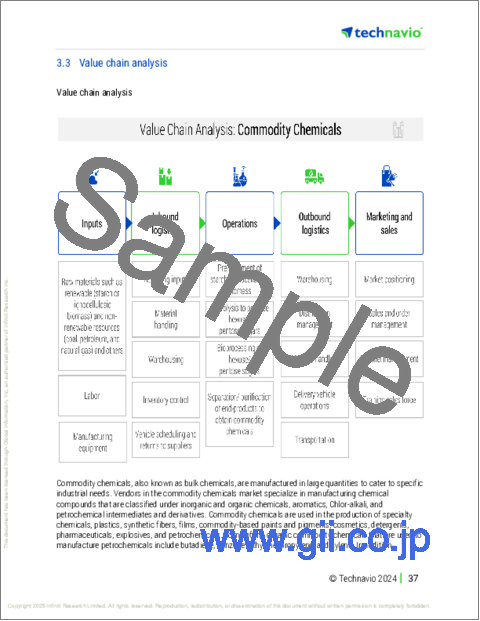
- 3.3 Value chain analysis
- Value chain analysis
4 Market Sizing
- 4.1 Market definition
- Offerings of companies included in the market definition
- 4.2 Market segment analysis
- Market segments
- 4.3 Market size 2024
- 4.4 Market outlook: Forecast for 2024-2029
- Chart on Global - Market size and forecast 2024-2029 ($ million)
- Data Table on Global - Market size and forecast 2024-2029 ($ million)
- Chart on Global Market: Year-over-year growth 2024-2029 (%)
- Data Table on Global Market: Year-over-year growth 2024-2029 (%)
5 Historic Market Size
- 5.1 Global Desalination Market 2019 - 2023
- Historic Market Size - Data Table on Global Desalination Market 2019 - 2023 ($ million)
- 5.2 Technology segment analysis 2019 - 2023
- Historic Market Size - Technology Segment 2019 - 2023 ($ million)
- 5.3 Application segment analysis 2019 - 2023
- Historic Market Size - Application Segment 2019 - 2023 ($ million)
- 5.4 Source segment analysis 2019 - 2023
- Historic Market Size - Source Segment 2019 - 2023 ($ million)
- 5.5 Geography segment analysis 2019 - 2023
- Historic Market Size - Geography Segment 2019 - 2023 ($ million)
- 5.6 Country segment analysis 2019 - 2023
- Historic Market Size - Country Segment 2019 - 2023 ($ million)
6 Qualitative Analysis
- 6.1 The impact of AI in global desalination market
7 Five Forces Analysis
- 7.1 Five forces summary
- Five forces analysis - Comparison between 2024 and 2029
- 7.2 Bargaining power of buyers
- Bargaining power of buyers - Impact of key factors 2024 and 2029
- 7.3 Bargaining power of suppliers
- Bargaining power of suppliers - Impact of key factors in 2024 and 2029
- 7.4 Threat of new entrants
- Threat of new entrants - Impact of key factors in 2024 and 2029
- 7.5 Threat of substitutes
- Threat of substitutes - Impact of key factors in 2024 and 2029
- 7.6 Threat of rivalry
- Threat of rivalry - Impact of key factors in 2024 and 2029
- 7.7 Market condition
- Chart on Market condition - Five forces 2024 and 2029
8 Market Segmentation by Technology
- 8.1 Market segments
- Chart on Technology - Market share 2024-2029 (%)
- Data Table on Technology - Market share 2024-2029 (%)
- 8.2 Comparison by Technology
- Chart on Comparison by Technology
- Data Table on Comparison by Technology
- 8.3 Membrane - Market size and forecast 2024-2029
- Chart on Membrane - Market size and forecast 2024-2029 ($ million)
- Data Table on Membrane - Market size and forecast 2024-2029 ($ million)
- Chart on Membrane - Year-over-year growth 2024-2029 (%)
- Data Table on Membrane - Year-over-year growth 2024-2029 (%)
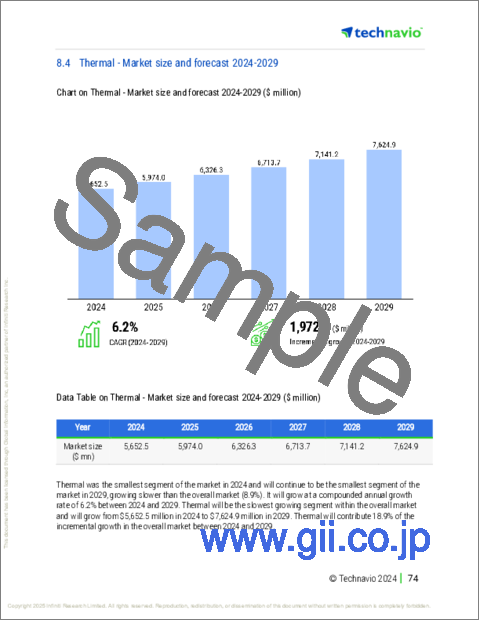
- 8.4 Thermal - Market size and forecast 2024-2029
- Chart on Thermal - Market size and forecast 2024-2029 ($ million)
- Data Table on Thermal - Market size and forecast 2024-2029 ($ million)
- Chart on Thermal - Year-over-year growth 2024-2029 (%)
- Data Table on Thermal - Year-over-year growth 2024-2029 (%)
- 8.5 Market opportunity by Technology
- Market opportunity by Technology ($ million)
- Data Table on Market opportunity by Technology ($ million)
9 Market Segmentation by Application
- 9.1 Market segments
- Chart on Application - Market share 2024-2029 (%)
- Data Table on Application - Market share 2024-2029 (%)
- 9.2 Comparison by Application
- Chart on Comparison by Application
- Data Table on Comparison by Application
- 9.3 Municipal - Market size and forecast 2024-2029
- Chart on Municipal - Market size and forecast 2024-2029 ($ million)
- Data Table on Municipal - Market size and forecast 2024-2029 ($ million)
- Chart on Municipal - Year-over-year growth 2024-2029 (%)
- Data Table on Municipal - Year-over-year growth 2024-2029 (%)
- 9.4 Industrial - Market size and forecast 2024-2029
- Chart on Industrial - Market size and forecast 2024-2029 ($ million)
- Data Table on Industrial - Market size and forecast 2024-2029 ($ million)
- Chart on Industrial - Year-over-year growth 2024-2029 (%)
- Data Table on Industrial - Year-over-year growth 2024-2029 (%)
- 9.5 Others - Market size and forecast 2024-2029
- Chart on Others - Market size and forecast 2024-2029 ($ million)
- Data Table on Others - Market size and forecast 2024-2029 ($ million)
- Chart on Others - Year-over-year growth 2024-2029 (%)
- Data Table on Others - Year-over-year growth 2024-2029 (%)
- 9.6 Market opportunity by Application
- Market opportunity by Application ($ million)
- Data Table on Market opportunity by Application ($ million)
10 Market Segmentation by Source
- 10.1 Market segments
- Chart on Source - Market share 2024-2029 (%)
- Data Table on Source - Market share 2024-2029 (%)
- 10.2 Comparison by Source
- Chart on Comparison by Source
- Data Table on Comparison by Source
- 10.3 Seawater - Market size and forecast 2024-2029
- Chart on Seawater - Market size and forecast 2024-2029 ($ million)
- Data Table on Seawater - Market size and forecast 2024-2029 ($ million)
- Chart on Seawater - Year-over-year growth 2024-2029 (%)
- Data Table on Seawater - Year-over-year growth 2024-2029 (%)
- 10.4 Brackish water - Market size and forecast 2024-2029
- Chart on Brackish water - Market size and forecast 2024-2029 ($ million)
- Data Table on Brackish water - Market size and forecast 2024-2029 ($ million)
- Chart on Brackish water - Year-over-year growth 2024-2029 (%)
- Data Table on Brackish water - Year-over-year growth 2024-2029 (%)
- 10.5 Market opportunity by Source
- Market opportunity by Source ($ million)
- Data Table on Market opportunity by Source ($ million)
11 Customer Landscape
- 11.1 Customer landscape overview
- Analysis of price sensitivity, lifecycle, customer purchase basket, adoption rates, and purchase criteria
12 Geographic Landscape
- 12.1 Geographic segmentation
- Chart on Market share By Geographical Landscape 2024-2029 (%)
- Data Table on Market share By Geographical Landscape 2024-2029 (%)
- 12.2 Geographic comparison
- Chart on Geographic comparison
- Data Table on Geographic comparison
- 12.3 Middle East and Africa - Market size and forecast 2024-2029
- Chart on Middle East and Africa - Market size and forecast 2024-2029 ($ million)
- Data Table on Middle East and Africa - Market size and forecast 2024-2029 ($ million)
- Chart on Middle East and Africa - Year-over-year growth 2024-2029 (%)
- Data Table on Middle East and Africa - Year-over-year growth 2024-2029 (%)
- 12.4 APAC - Market size and forecast 2024-2029
- Chart on APAC - Market size and forecast 2024-2029 ($ million)
- Data Table on APAC - Market size and forecast 2024-2029 ($ million)
- Chart on APAC - Year-over-year growth 2024-2029 (%)
- Data Table on APAC - Year-over-year growth 2024-2029 (%)
- 12.5 North America - Market size and forecast 2024-2029
- Chart on North America - Market size and forecast 2024-2029 ($ million)
- Data Table on North America - Market size and forecast 2024-2029 ($ million)
- Chart on North America - Year-over-year growth 2024-2029 (%)
- Data Table on North America - Year-over-year growth 2024-2029 (%)
- 12.6 Europe - Market size and forecast 2024-2029
- Chart on Europe - Market size and forecast 2024-2029 ($ million)
- Data Table on Europe - Market size and forecast 2024-2029 ($ million)
- Chart on Europe - Year-over-year growth 2024-2029 (%)
- Data Table on Europe - Year-over-year growth 2024-2029 (%)
- 12.7 South America - Market size and forecast 2024-2029
- Chart on South America - Market size and forecast 2024-2029 ($ million)
- Data Table on South America - Market size and forecast 2024-2029 ($ million)
- Chart on South America - Year-over-year growth 2024-2029 (%)
- Data Table on South America - Year-over-year growth 2024-2029 (%)
- 12.8 Saudi Arabia - Market size and forecast 2024-2029
- Chart on Saudi Arabia - Market size and forecast 2024-2029 ($ million)
- Data Table on Saudi Arabia - Market size and forecast 2024-2029 ($ million)
- Chart on Saudi Arabia - Year-over-year growth 2024-2029 (%)
- Data Table on Saudi Arabia - Year-over-year growth 2024-2029 (%)
- 12.9 United Arab Emirates - Market size and forecast 2024-2029
- Chart on United Arab Emirates - Market size and forecast 2024-2029 ($ million)
- Data Table on United Arab Emirates - Market size and forecast 2024-2029 ($ million)
- Chart on United Arab Emirates - Year-over-year growth 2024-2029 (%)
- Data Table on United Arab Emirates - Year-over-year growth 2024-2029 (%)
- 12.10 US - Market size and forecast 2024-2029
- Chart on US - Market size and forecast 2024-2029 ($ million)
- Data Table on US - Market size and forecast 2024-2029 ($ million)
- Chart on US - Year-over-year growth 2024-2029 (%)
- Data Table on US - Year-over-year growth 2024-2029 (%)
- 12.11 South Africa - Market size and forecast 2024-2029
- Chart on South Africa - Market size and forecast 2024-2029 ($ million)
- Data Table on South Africa - Market size and forecast 2024-2029 ($ million)
- Chart on South Africa - Year-over-year growth 2024-2029 (%)
- Data Table on South Africa - Year-over-year growth 2024-2029 (%)
- 12.12 China - Market size and forecast 2024-2029
- Chart on China - Market size and forecast 2024-2029 ($ million)
- Data Table on China - Market size and forecast 2024-2029 ($ million)
- Chart on China - Year-over-year growth 2024-2029 (%)
- Data Table on China - Year-over-year growth 2024-2029 (%)
- 12.13 Egypt - Market size and forecast 2024-2029
- Chart on Egypt - Market size and forecast 2024-2029 ($ million)
- Data Table on Egypt - Market size and forecast 2024-2029 ($ million)
- Chart on Egypt - Year-over-year growth 2024-2029 (%)
- Data Table on Egypt - Year-over-year growth 2024-2029 (%)
- 12.14 Japan - Market size and forecast 2024-2029
- Chart on Japan - Market size and forecast 2024-2029 ($ million)
- Data Table on Japan - Market size and forecast 2024-2029 ($ million)
- Chart on Japan - Year-over-year growth 2024-2029 (%)
- Data Table on Japan - Year-over-year growth 2024-2029 (%)
- 12.15 Nigeria - Market size and forecast 2024-2029
- Chart on Nigeria - Market size and forecast 2024-2029 ($ million)
- Data Table on Nigeria - Market size and forecast 2024-2029 ($ million)
- Chart on Nigeria - Year-over-year growth 2024-2029 (%)
- Data Table on Nigeria - Year-over-year growth 2024-2029 (%)
- 12.16 South Korea - Market size and forecast 2024-2029
- Chart on South Korea - Market size and forecast 2024-2029 ($ million)
- Data Table on South Korea - Market size and forecast 2024-2029 ($ million)
- Chart on South Korea - Year-over-year growth 2024-2029 (%)
- Data Table on South Korea - Year-over-year growth 2024-2029 (%)
- 12.17 India - Market size and forecast 2024-2029
- Chart on India - Market size and forecast 2024-2029 ($ million)
- Data Table on India - Market size and forecast 2024-2029 ($ million)
- Chart on India - Year-over-year growth 2024-2029 (%)
- Data Table on India - Year-over-year growth 2024-2029 (%)
- 12.18 Market opportunity By Geographical Landscape
- Market opportunity By Geographical Landscape ($ million)
- Data Tables on Market opportunity By Geographical Landscape ($ million)
13 Drivers, Challenges, and Opportunity/Restraints
- 13.1 Market drivers
- 13.2 Market challenges
- 13.3 Impact of drivers and challenges
- Impact of drivers and challenges in 2024 and 2029
- 13.4 Market opportunities/restraints
14 Competitive Landscape
- 14.1 Overview
- 14.2 Competitive Landscape
- Overview on criticality of inputs and factors of differentiation
- 14.3 Landscape disruption
- Overview on factors of disruption
- 14.4 Industry risks
- Impact of key risks on business
15 Competitive Analysis
- 15.1 Companies profiled
- Companies covered
- 15.2 Company ranking index
- Company ranking index
- 15.3 Market positioning of companies
- Matrix on companies position and classification
- 15.4 Acciona SA
- Acciona SA - Overview
- Acciona SA - Business segments
- Acciona SA - Key news
- Acciona SA - Key offerings
- Acciona SA - Segment focus
- SWOT
- 15.5 Asahi Kasei Corp.
- Asahi Kasei Corp. - Overview
- Asahi Kasei Corp. - Business segments
- Asahi Kasei Corp. - Key news
- Asahi Kasei Corp. - Key offerings
- Asahi Kasei Corp. - Segment focus
- SWOT
- 15.6 Bechtel Corp.
- Bechtel Corp. - Overview
- Bechtel Corp. - Product / Service
- Bechtel Corp. - Key news
- Bechtel Corp. - Key offerings
- SWOT
- 15.7 Biwater Holdings Ltd.
- Biwater Holdings Ltd. - Overview
- Biwater Holdings Ltd. - Product / Service
- Biwater Holdings Ltd. - Key offerings
- SWOT
- 15.8 Consolidated Water Co. Ltd.
- Consolidated Water Co. Ltd. - Overview
- Consolidated Water Co. Ltd. - Business segments
- Consolidated Water Co. Ltd. - Key offerings
- Consolidated Water Co. Ltd. - Segment focus
- SWOT
- 15.9 Doosan Corp.
- Doosan Corp. - Overview
- Doosan Corp. - Business segments
- Doosan Corp. - Key news
- Doosan Corp. - Key offerings
- Doosan Corp. - Segment focus
- SWOT
- 15.10 DuPont de Nemours Inc.
- DuPont de Nemours Inc. - Overview
- DuPont de Nemours Inc. - Business segments
- DuPont de Nemours Inc. - Key news
- DuPont de Nemours Inc. - Key offerings
- DuPont de Nemours Inc. - Segment focus
- SWOT
- 15.11 Ferrovial SA
- Ferrovial SA - Overview
- Ferrovial SA - Business segments
- Ferrovial SA - Key offerings
- Ferrovial SA - Segment focus
- SWOT
- 15.12 IDE Water Technologies
- IDE Water Technologies - Overview
- IDE Water Technologies - Product / Service
- IDE Water Technologies - Key offerings
- SWOT
- 15.13 Kurita Water Industries Ltd
- Kurita Water Industries Ltd - Overview
- Kurita Water Industries Ltd - Business segments
- Kurita Water Industries Ltd - Key offerings
- Kurita Water Industries Ltd - Segment focus
- SWOT
- 15.14 Mitsubishi Heavy Industries Ltd.
- Mitsubishi Heavy Industries Ltd. - Overview
- Mitsubishi Heavy Industries Ltd. - Business segments
- Mitsubishi Heavy Industries Ltd. - Key news
- Mitsubishi Heavy Industries Ltd. - Key offerings
- Mitsubishi Heavy Industries Ltd. - Segment focus
- SWOT
- 15.15 Poseidon Water LLC
- Poseidon Water LLC - Overview
- Poseidon Water LLC - Product / Service
- Poseidon Water LLC - Key offerings
- SWOT
- 15.16 RAI Amsterdam Aquatech
- RAI Amsterdam Aquatech - Overview
- RAI Amsterdam Aquatech - Product / Service
- RAI Amsterdam Aquatech - Key offerings
- SWOT
- 15.17 Toyobo Co. Ltd.
- Toyobo Co. Ltd. - Overview
- Toyobo Co. Ltd. - Business segments
- Toyobo Co. Ltd. - Key news
- Toyobo Co. Ltd. - Key offerings
- Toyobo Co. Ltd. - Segment focus
- SWOT
- 15.18 Veolia Environnement SA
- Veolia Environnement SA - Overview
- Veolia Environnement SA - Business segments
- Veolia Environnement SA - Key offerings
- Veolia Environnement SA - Segment focus
- SWOT
16 Appendix
- 16.1 Scope of the report
- 16.2 Inclusions and exclusions checklist
- Inclusions checklist
- Exclusions checklist
- 16.3 Currency conversion rates for US$
- Currency conversion rates for US$
- 16.4 Research methodology
- Research methodology
- 16.5 Data procurement
- Information sources
- 16.6 Data validation
- Data validation
- 16.7 Validation techniques employed for market sizing
- Validation techniques employed for market sizing
- 16.8 Data synthesis
- Data synthesis
- 16.9 360 degree market analysis
- 360 degree market analysis
- 16.10 List of abbreviations
- List of abbreviations

