|
|
市場調査レポート
商品コード
1516485
フラックスタックの世界市場 2024-2028Global frac stack market 2024-2028 |
||||||
|
|||||||
カスタマイズ可能
|
|||||||

| フラックスタックの世界市場 2024-2028 |
|
出版日: 2024年06月12日
発行: TechNavio
ページ情報: 英文 166 Pages
納期: 即納可能
|

全表示
- 概要
- 図表
- 目次
フラックスタック市場は2023-2028年に84億9,000万米ドル、予測期間中のCAGRは4.36%で成長すると予測されます。
当レポートでは、フラックスタック市場の全体的な分析、市場規模・予測、動向、成長促進要因、課題、約25のベンダーを網羅したベンダー分析などを掲載しています。
現在の市場シナリオ、最新動向と促進要因、市場環境全体に関する最新分析を提供しています。非在来型石油・ガス資源の豊富さ、石油・ガスインフラへの投資の増加、オフショア探査・生産の増加が市場を牽引しています。
| 市場範囲 | |
|---|---|
| 基準年 | 2024 |
| 終了年 | 2028 |
| 予測期間 | 2024-2028 |
| 成長モメンタム | 加速 |
| 前年比2024年 | 4.11% |
| CAGR | 4.36% |
| 増分額 | 84億9,000万米ドル |
本調査では、今後数年間のフラックスタック市場の成長を促進する主な要因の1つとして、グリーンフラッキング法の採用増加を挙げています。また、石油・ガス事業へのモノのインターネット(IoT)の統合や水圧破砕技術の進歩の高まりは、市場の大きな需要につながります。
目次
第1章 エグゼクティブサマリー
- 市場概要
第2章 市場情勢
- 市場エコシステム
- 市場の特徴
- バリューチェーン分析
第3章 市場規模の評価
- 市場の定義
- 市場セグメント分析
- 市場規模 2023
- 市場の見通し 2023-2028
第4章 市場規模実績
- 世界フラックスタック市場 2018-2022
- 展開別セグメント分析 2018-2022
- タイプ別セグメント分析 2018-2022
- 地域別セグメント分析 2018-2022
- 国別セグメント分析 2018-2022
第5章 ファイブフォース分析
- ファイブフォースの要約
- 買い手の交渉力
- 供給企業の交渉力
- 新規参入業者の脅威
- 代替品の脅威
- 競争の脅威
- 市況
第6章 市場セグメンテーション:展開別
- 市場セグメンテーション
- 比較:展開別
- オンショア:市場規模と予測 2023-2028
- オフショア:市場規模と予測 2023-2028
- 市場機会:展開別
第7章 市場セグメンテーション:タイプ別
- 市場セグメンテーション
- 比較:タイプ別
- 水平と偏向:市場規模と予測 2023-2028
- 垂直:市場規模と予測 2023-2028
- 市場機会:タイプ別
第8章 顧客情勢
- 顧客情勢の概要
第9章 地域別情勢
- 地域別セグメンテーション
- 地域別比較
- 北米:市場規模と予測 2023-2028
- 欧州:市場規模と予測 2023-2028
- アジア太平洋:市場規模と予測 2023-2028
- 南米:市場規模と予測 2023-2028
- 中東・アフリカ:市場規模と予測 2023-2028
- 米国:市場規模と予測 2023-2028
- 中国:市場規模と予測 2023-2028
- カナダ:市場規模と予測 2023-2028
- アルゼンチン:市場規模と予測 2023-2028
- オーストラリア:市場規模と予測 2023-2028
- 市場機会:地域別
第10章 促進要因・課題・機会・抑制要因
- 市場促進要因
- 市場の課題
- 促進要因と課題の影響
- 市場の機会・抑制要因
第11章 競合情勢
- 概要
- 競合情勢
- 混乱の状況
- 業界のリスク
第12章 競合分析
- 企業プロファイル
- 企業の市場ポジショニング
- AWC Frac Technology
- Baker Hughes Co.
- Calfrac Well Services Ltd.
- Caterpillar Inc.
- CCSC Petroleum Equipment Co. Ltd.
- Covenant Testing Technologies LLC
- Halliburton Co.
- Moto Mechanics Argentina SA
- Oil States International Inc.
- REIN PROCESS EQUIPMENT JIANGSU CO. LTD.
- Schlumberger Ltd.
- SHAANXI KERGY MECHANICAL EQUIPMENT CO. LTD.
- Worldwide Oilfield Machine Inc.
- Yancheng Qihang Petroleum Machinery Co. Ltd.
- Yantai Jereh Oilfield Services Group Co. Ltd.
第13章 付録
Exhibits:
- Exhibits1: Executive Summary - Chart on Market Overview
- Exhibits2: Executive Summary - Data Table on Market Overview
- Exhibits3: Executive Summary - Chart on Global Market Characteristics
- Exhibits4: Executive Summary - Chart on Market by Geography
- Exhibits5: Executive Summary - Chart on Market Segmentation by Deployment
- Exhibits6: Executive Summary - Chart on Market Segmentation by Type
- Exhibits7: Executive Summary - Chart on Incremental Growth
- Exhibits8: Executive Summary - Data Table on Incremental Growth
- Exhibits9: Executive Summary - Chart on Company Market Positioning
- Exhibits10: Parent Market
- Exhibits11: Data Table on - Parent Market
- Exhibits12: Market characteristics analysis
- Exhibits13: Value Chain Analysis
- Exhibits14: Offerings of companies included in the market definition
- Exhibits15: Market segments
- Exhibits16: Chart on Global - Market size and forecast 2023-2028 ($ billion)
- Exhibits17: Data Table on Global - Market size and forecast 2023-2028 ($ billion)
- Exhibits18: Chart on Global Market: Year-over-year growth 2023-2028 (%)
- Exhibits19: Data Table on Global Market: Year-over-year growth 2023-2028 (%)
- Exhibits20: Historic Market Size - Data Table on Global Frac Stack Market 2018 - 2022 ($ billion)
- Exhibits21: Historic Market Size - Deployment Segment 2018 - 2022 ($ billion)
- Exhibits22: Historic Market Size - Type Segment 2018 - 2022 ($ billion)
- Exhibits23: Historic Market Size - Geography Segment 2018 - 2022 ($ billion)
- Exhibits24: Historic Market Size - Country Segment 2018 - 2022 ($ billion)
- Exhibits25: Five forces analysis - Comparison between 2023 and 2028
- Exhibits26: Bargaining power of buyers - Impact of key factors 2023 and 2028
- Exhibits27: Bargaining power of suppliers - Impact of key factors in 2023 and 2028
- Exhibits28: Threat of new entrants - Impact of key factors in 2023 and 2028
- Exhibits29: Threat of substitutes - Impact of key factors in 2023 and 2028
- Exhibits30: Threat of rivalry - Impact of key factors in 2023 and 2028
- Exhibits31: Chart on Market condition - Five forces 2023 and 2028
- Exhibits32: Chart on Deployment - Market share 2023-2028 (%)
- Exhibits33: Data Table on Deployment - Market share 2023-2028 (%)
- Exhibits34: Chart on Comparison by Deployment
- Exhibits35: Data Table on Comparison by Deployment
- Exhibits36: Chart on Onshore - Market size and forecast 2023-2028 ($ billion)
- Exhibits37: Data Table on Onshore - Market size and forecast 2023-2028 ($ billion)
- Exhibits38: Chart on Onshore - Year-over-year growth 2023-2028 (%)
- Exhibits39: Data Table on Onshore - Year-over-year growth 2023-2028 (%)
- Exhibits40: Chart on Offshore - Market size and forecast 2023-2028 ($ billion)
- Exhibits41: Data Table on Offshore - Market size and forecast 2023-2028 ($ billion)
- Exhibits42: Chart on Offshore - Year-over-year growth 2023-2028 (%)
- Exhibits43: Data Table on Offshore - Year-over-year growth 2023-2028 (%)
- Exhibits44: Market opportunity by Deployment ($ billion)
- Exhibits45: Data Table on Market opportunity by Deployment ($ billion)
- Exhibits46: Chart on Type - Market share 2023-2028 (%)
- Exhibits47: Data Table on Type - Market share 2023-2028 (%)
- Exhibits48: Chart on Comparison by Type
- Exhibits49: Data Table on Comparison by Type
- Exhibits50: Chart on Horizontal and deviated - Market size and forecast 2023-2028 ($ billion)
- Exhibits51: Data Table on Horizontal and deviated - Market size and forecast 2023-2028 ($ billion)
- Exhibits52: Chart on Horizontal and deviated - Year-over-year growth 2023-2028 (%)
- Exhibits53: Data Table on Horizontal and deviated - Year-over-year growth 2023-2028 (%)
- Exhibits54: Chart on Vertical - Market size and forecast 2023-2028 ($ billion)
- Exhibits55: Data Table on Vertical - Market size and forecast 2023-2028 ($ billion)
- Exhibits56: Chart on Vertical - Year-over-year growth 2023-2028 (%)
- Exhibits57: Data Table on Vertical - Year-over-year growth 2023-2028 (%)
- Exhibits58: Market opportunity by Type ($ billion)
- Exhibits59: Data Table on Market opportunity by Type ($ billion)
- Exhibits60: Analysis of price sensitivity, lifecycle, customer purchase basket, adoption rates, and purchase criteria
- Exhibits61: Chart on Market share by geography 2023-2028 (%)
- Exhibits62: Data Table on Market share by geography 2023-2028 (%)
- Exhibits63: Chart on Geographic comparison
- Exhibits64: Data Table on Geographic comparison
- Exhibits65: Chart on North America - Market size and forecast 2023-2028 ($ billion)
- Exhibits66: Data Table on North America - Market size and forecast 2023-2028 ($ billion)
- Exhibits67: Chart on North America - Year-over-year growth 2023-2028 (%)
- Exhibits68: Data Table on North America - Year-over-year growth 2023-2028 (%)
- Exhibits69: Chart on Europe - Market size and forecast 2023-2028 ($ billion)
- Exhibits70: Data Table on Europe - Market size and forecast 2023-2028 ($ billion)
- Exhibits71: Chart on Europe - Year-over-year growth 2023-2028 (%)
- Exhibits72: Data Table on Europe - Year-over-year growth 2023-2028 (%)
- Exhibits73: Chart on APAC - Market size and forecast 2023-2028 ($ billion)
- Exhibits74: Data Table on APAC - Market size and forecast 2023-2028 ($ billion)
- Exhibits75: Chart on APAC - Year-over-year growth 2023-2028 (%)
- Exhibits76: Data Table on APAC - Year-over-year growth 2023-2028 (%)
- Exhibits77: Chart on South America - Market size and forecast 2023-2028 ($ billion)
- Exhibits78: Data Table on South America - Market size and forecast 2023-2028 ($ billion)
- Exhibits79: Chart on South America - Year-over-year growth 2023-2028 (%)
- Exhibits80: Data Table on South America - Year-over-year growth 2023-2028 (%)
- Exhibits81: Chart on Middle East and Africa - Market size and forecast 2023-2028 ($ billion)
- Exhibits82: Data Table on Middle East and Africa - Market size and forecast 2023-2028 ($ billion)
- Exhibits83: Chart on Middle East and Africa - Year-over-year growth 2023-2028 (%)
- Exhibits84: Data Table on Middle East and Africa - Year-over-year growth 2023-2028 (%)
- Exhibits85: Chart on US - Market size and forecast 2023-2028 ($ billion)
- Exhibits86: Data Table on US - Market size and forecast 2023-2028 ($ billion)
- Exhibits87: Chart on US - Year-over-year growth 2023-2028 (%)
- Exhibits88: Data Table on US - Year-over-year growth 2023-2028 (%)
- Exhibits89: Chart on China - Market size and forecast 2023-2028 ($ billion)
- Exhibits90: Data Table on China - Market size and forecast 2023-2028 ($ billion)
- Exhibits91: Chart on China - Year-over-year growth 2023-2028 (%)
- Exhibits92: Data Table on China - Year-over-year growth 2023-2028 (%)
- Exhibits93: Chart on Canada - Market size and forecast 2023-2028 ($ billion)
- Exhibits94: Data Table on Canada - Market size and forecast 2023-2028 ($ billion)
- Exhibits95: Chart on Canada - Year-over-year growth 2023-2028 (%)
- Exhibits96: Data Table on Canada - Year-over-year growth 2023-2028 (%)
- Exhibits97: Chart on Argentina - Market size and forecast 2023-2028 ($ billion)
- Exhibits98: Data Table on Argentina - Market size and forecast 2023-2028 ($ billion)
- Exhibits99: Chart on Argentina - Year-over-year growth 2023-2028 (%)
- Exhibits100: Data Table on Argentina - Year-over-year growth 2023-2028 (%)
- Exhibits101: Chart on Australia - Market size and forecast 2023-2028 ($ billion)
- Exhibits102: Data Table on Australia - Market size and forecast 2023-2028 ($ billion)
- Exhibits103: Chart on Australia - Year-over-year growth 2023-2028 (%)
- Exhibits104: Data Table on Australia - Year-over-year growth 2023-2028 (%)
- Exhibits105: Market opportunity by geography ($ billion)
- Exhibits106: Data Tables on Market opportunity by geography ($ billion)
- Exhibits107: Impact of drivers and challenges in 2023 and 2028
- Exhibits108: Overview on criticality of inputs and factors of differentiation
- Exhibits109: Overview on factors of disruption
- Exhibits110: Impact of key risks on business
- Exhibits111: Companies covered
- Exhibits112: Matrix on companies position and classification
- Exhibits113: AWC Frac Technology - Overview
- Exhibits114: AWC Frac Technology - Product / Service
- Exhibits115: AWC Frac Technology - Key offerings
- Exhibits116: Baker Hughes Co. - Overview
- Exhibits117: Baker Hughes Co. - Business segments
- Exhibits118: Baker Hughes Co. - Key news
- Exhibits119: Baker Hughes Co. - Key offerings
- Exhibits120: Baker Hughes Co. - Segment focus
- Exhibits121: Calfrac Well Services Ltd. - Overview
- Exhibits122: Calfrac Well Services Ltd. - Business segments
- Exhibits123: Calfrac Well Services Ltd. - Key offerings
- Exhibits124: Calfrac Well Services Ltd. - Segment focus
- Exhibits125: Caterpillar Inc. - Overview
- Exhibits126: Caterpillar Inc. - Business segments
- Exhibits127: Caterpillar Inc. - Key news
- Exhibits128: Caterpillar Inc. - Key offerings
- Exhibits129: Caterpillar Inc. - Segment focus
- Exhibits130: CCSC Petroleum Equipment Co. Ltd. - Overview
- Exhibits131: CCSC Petroleum Equipment Co. Ltd. - Product / Service
- Exhibits132: CCSC Petroleum Equipment Co. Ltd. - Key offerings
- Exhibits133: Covenant Testing Technologies LLC - Overview
- Exhibits134: Covenant Testing Technologies LLC - Product / Service
- Exhibits135: Covenant Testing Technologies LLC - Key offerings
- Exhibits136: Halliburton Co. - Overview
- Exhibits137: Halliburton Co. - Business segments
- Exhibits138: Halliburton Co. - Key news
- Exhibits139: Halliburton Co. - Key offerings
- Exhibits140: Halliburton Co. - Segment focus
- Exhibits141: Moto Mechanics Argentina SA - Overview
- Exhibits142: Moto Mechanics Argentina SA - Product / Service
- Exhibits143: Moto Mechanics Argentina SA - Key offerings
- Exhibits144: Oil States International Inc. - Overview
- Exhibits145: Oil States International Inc. - Business segments
- Exhibits146: Oil States International Inc. - Key offerings
- Exhibits147: Oil States International Inc. - Segment focus
- Exhibits148: REIN PROCESS EQUIPMENT JIANGSU CO. LTD. - Overview
- Exhibits149: REIN PROCESS EQUIPMENT JIANGSU CO. LTD. - Product / Service
- Exhibits150: REIN PROCESS EQUIPMENT JIANGSU CO. LTD. - Key offerings
- Exhibits151: Schlumberger Ltd. - Overview
- Exhibits152: Schlumberger Ltd. - Business segments
- Exhibits153: Schlumberger Ltd. - Key news
- Exhibits154: Schlumberger Ltd. - Key offerings
- Exhibits155: Schlumberger Ltd. - Segment focus
- Exhibits156: SHAANXI KERGY MECHANICAL EQUIPMENT CO. LTD. - Overview
- Exhibits157: SHAANXI KERGY MECHANICAL EQUIPMENT CO. LTD. - Product / Service
- Exhibits158: SHAANXI KERGY MECHANICAL EQUIPMENT CO. LTD. - Key offerings
- Exhibits159: Worldwide Oilfield Machine Inc. - Overview
- Exhibits160: Worldwide Oilfield Machine Inc. - Product / Service
- Exhibits161: Worldwide Oilfield Machine Inc. - Key offerings
- Exhibits162: Yancheng Qihang Petroleum Machinery Co. Ltd. - Overview
- Exhibits163: Yancheng Qihang Petroleum Machinery Co. Ltd. - Product / Service
- Exhibits164: Yancheng Qihang Petroleum Machinery Co. Ltd. - Key offerings
- Exhibits165: Yantai Jereh Oilfield Services Group Co. Ltd. - Overview
- Exhibits166: Yantai Jereh Oilfield Services Group Co. Ltd. - Product / Service
- Exhibits167: Yantai Jereh Oilfield Services Group Co. Ltd. - Key offerings
- Exhibits168: Inclusions checklist
- Exhibits169: Exclusions checklist
- Exhibits170: Currency conversion rates for US$
- Exhibits171: Research methodology
- Exhibits172: Information sources
- Exhibits173: Data validation
- Exhibits174: Validation techniques employed for market sizing
- Exhibits175: Data synthesis
- Exhibits176: 360 degree market analysis
- Exhibits177: List of abbreviations
The frac stack market is forecasted to grow by USD 8.49 bn during 2023-2028, accelerating AT a CAGR of 4.36% during the forecast period. The report on the frac stack market provides a holistic analysis, market size and forecast, trends, growth drivers, and challenges, as well as vendor analysis covering around 25 vendors.
The report offers an up-to-date analysis regarding the current market scenario, the latest trends and drivers, and the overall market environment. The market is driven by abundance of unconventional oil and gas resources, rising investments in oil and gas infrastructure, and increasing offshore exploration and production.
Technavio's frac stack market is segmented as below:
| Market Scope | |
|---|---|
| Base Year | 2024 |
| End Year | 2028 |
| Series Year | 2024-2028 |
| Growth Momentum | Accelerate |
| YOY 2024 | 4.11% |
| CAGR | 4.36% |
| Incremental Value | $8.49bn |
By Deployment
- Onshore
- Offshore
By Type
- Horizontal and deviated
- Vertical
By Geography
- North America
- Europe
- APAC
- South America
- Middle East and Africa
This study identifies the rise in adoption of green fracking methods as one of the prime reasons driving the frac stack market growth during the next few years. Also, integration of internet of things (IoT) into oil and gas operations and growing advancements in hydraulic fracturing techniques will lead to sizable demand in the market.
The report on the frac stack market covers the following areas:
- Frac stack market sizing
- Frac stack market forecast
- Frac stack market industry analysis
The robust vendor analysis is designed to help clients improve their market position, and in line with this, this report provides a detailed analysis of several leading frac stack market vendors that include AWC Frac Technology, Baker Hughes Co., Calfrac Well Services Ltd., Caterpillar Inc., CCSC Petroleum Equipment Co. Ltd., Covenant Testing Technologies LLC, Halliburton Co., Jiangsu Hongxun Oil Equipment Co. Ltd., KLX Energy Services Holdings Inc., Moto Mechanics Argentina SA, Oil States International Inc., REIN PROCESS EQUIPMENT JIANGSU CO. LTD., Schlumberger Ltd., SHAANXI KERGY MECHANICAL EQUIPMENT CO. LTD., Sunnda Corp., Trican Well Service Ltd., Universal Wellhead Services Holdings LLC, Worldwide Oilfield Machine Inc., Yancheng Qihang Petroleum Machinery Co. Ltd., and Yantai Jereh Oilfield Services Group Co. Ltd.. Also, the frac stack market analysis report includes information on upcoming trends and challenges that will influence market growth. This is to help companies strategize and leverage all forthcoming growth opportunities.
The study was conducted using an objective combination of primary and secondary information including inputs from key participants in the industry. The report contains a comprehensive market and vendor landscape in addition to an analysis of the key vendors.
The publisher presents a detailed picture of the market by the way of study, synthesis, and summation of data from multiple sources by an analysis of key parameters such as profit, pricing, competition, and promotions. IT presents various market facets by identifying the key industry influencers. The data presented is comprehensive, reliable, and a result of extensive research - both primary and secondary. The market research reports provide a complete competitive landscape and an in-depth vendor selection methodology and analysis using qualitative and quantitative research to forecast the accurate market growth.
Table of Contents
1 Executive Summary
- 1.1 Market overview
- Executive Summary - Chart on Market Overview
- Executive Summary - Data Table on Market Overview
- Executive Summary - Chart on Global Market Characteristics
- Executive Summary - Chart on Market by Geography
- Executive Summary - Chart on Market Segmentation by Deployment
- Executive Summary - Chart on Market Segmentation by Type
- Executive Summary - Chart on Incremental Growth
- Executive Summary - Data Table on Incremental Growth
- Executive Summary - Chart on Company Market Positioning
2 Market Landscape
- 2.1 Market ecosystem
- Parent Market
- Data Table on - Parent Market
- 2.2 Market characteristics
- Market characteristics analysis
- 2.3 Value chain analysis
- Value Chain Analysis
3 Market Sizing
- 3.1 Market definition
- Offerings of companies included in the market definition
- 3.2 Market segment analysis
- Market segments
- 3.3 Market size 2023
- 3.4 Market outlook: Forecast for 2023-2028
- Chart on Global - Market size and forecast 2023-2028 ($ billion)
- Data Table on Global - Market size and forecast 2023-2028 ($ billion)
- Chart on Global Market: Year-over-year growth 2023-2028 (%)
- Data Table on Global Market: Year-over-year growth 2023-2028 (%)
4 Historic Market Size
- 4.1 Global Frac Stack Market 2018 - 2022
- Historic Market Size - Data Table on Global Frac Stack Market 2018 - 2022 ($ billion)
- 4.2 Deployment segment analysis 2018 - 2022
- Historic Market Size - Deployment Segment 2018 - 2022 ($ billion)
- 4.3 Type segment analysis 2018 - 2022
- Historic Market Size - Type Segment 2018 - 2022 ($ billion)
- 4.4 Geography segment analysis 2018 - 2022
- Historic Market Size - Geography Segment 2018 - 2022 ($ billion)
- 4.5 Country segment analysis 2018 - 2022
- Historic Market Size - Country Segment 2018 - 2022 ($ billion)
5 Five Forces Analysis
- 5.1 Five forces summary
- Five forces analysis - Comparison between 2023 and 2028
- 5.2 Bargaining power of buyers
- Bargaining power of buyers - Impact of key factors 2023 and 2028
- 5.3 Bargaining power of suppliers
- Bargaining power of suppliers - Impact of key factors in 2023 and 2028
- 5.4 Threat of new entrants
- Threat of new entrants - Impact of key factors in 2023 and 2028
- 5.5 Threat of substitutes
- Threat of substitutes - Impact of key factors in 2023 and 2028
- 5.6 Threat of rivalry
- Threat of rivalry - Impact of key factors in 2023 and 2028
- 5.7 Market condition
- Chart on Market condition - Five forces 2023 and 2028
6 Market Segmentation by Deployment
- 6.1 Market segments
- Chart on Deployment - Market share 2023-2028 (%)
- Data Table on Deployment - Market share 2023-2028 (%)
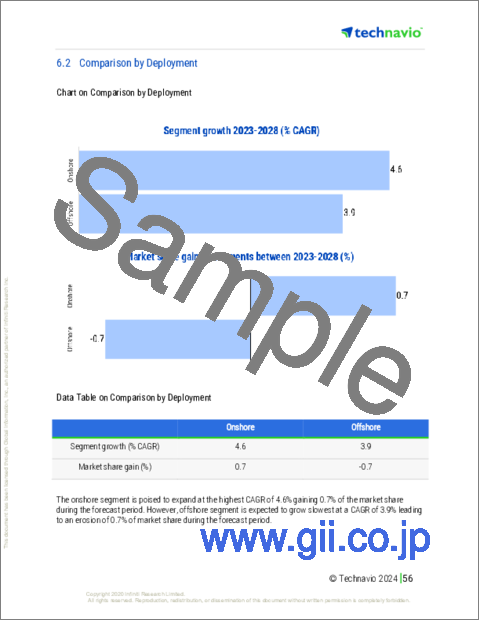
- 6.2 Comparison by Deployment
- Chart on Comparison by Deployment
- Data Table on Comparison by Deployment
- 6.3 Onshore - Market size and forecast 2023-2028
- Chart on Onshore - Market size and forecast 2023-2028 ($ billion)
- Data Table on Onshore - Market size and forecast 2023-2028 ($ billion)
- Chart on Onshore - Year-over-year growth 2023-2028 (%)
- Data Table on Onshore - Year-over-year growth 2023-2028 (%)
- 6.4 Offshore - Market size and forecast 2023-2028
- Chart on Offshore - Market size and forecast 2023-2028 ($ billion)
- Data Table on Offshore - Market size and forecast 2023-2028 ($ billion)
- Chart on Offshore - Year-over-year growth 2023-2028 (%)
- Data Table on Offshore - Year-over-year growth 2023-2028 (%)
- 6.5 Market opportunity by Deployment
- Market opportunity by Deployment ($ billion)
- Data Table on Market opportunity by Deployment ($ billion)
7 Market Segmentation by Type
- 7.1 Market segments
- Chart on Type - Market share 2023-2028 (%)
- Data Table on Type - Market share 2023-2028 (%)
- 7.2 Comparison by Type
- Chart on Comparison by Type
- Data Table on Comparison by Type
- 7.3 Horizontal and deviated - Market size and forecast 2023-2028
- Chart on Horizontal and deviated - Market size and forecast 2023-2028 ($ billion)
- Data Table on Horizontal and deviated - Market size and forecast 2023-2028 ($ billion)
- Chart on Horizontal and deviated - Year-over-year growth 2023-2028 (%)
- Data Table on Horizontal and deviated - Year-over-year growth 2023-2028 (%)
- 7.4 Vertical - Market size and forecast 2023-2028
- Chart on Vertical - Market size and forecast 2023-2028 ($ billion)
- Data Table on Vertical - Market size and forecast 2023-2028 ($ billion)
- Chart on Vertical - Year-over-year growth 2023-2028 (%)
- Data Table on Vertical - Year-over-year growth 2023-2028 (%)
- 7.5 Market opportunity by Type
- Market opportunity by Type ($ billion)
- Data Table on Market opportunity by Type ($ billion)
8 Customer Landscape
- 8.1 Customer landscape overview
- Analysis of price sensitivity, lifecycle, customer purchase basket, adoption rates, and purchase criteria
9 Geographic Landscape
- 9.1 Geographic segmentation
- Chart on Market share by geography 2023-2028 (%)
- Data Table on Market share by geography 2023-2028 (%)
- 9.2 Geographic comparison
- Chart on Geographic comparison
- Data Table on Geographic comparison
- 9.3 North America - Market size and forecast 2023-2028
- Chart on North America - Market size and forecast 2023-2028 ($ billion)
- Data Table on North America - Market size and forecast 2023-2028 ($ billion)
- Chart on North America - Year-over-year growth 2023-2028 (%)
- Data Table on North America - Year-over-year growth 2023-2028 (%)
- 9.4 Europe - Market size and forecast 2023-2028
- Chart on Europe - Market size and forecast 2023-2028 ($ billion)
- Data Table on Europe - Market size and forecast 2023-2028 ($ billion)
- Chart on Europe - Year-over-year growth 2023-2028 (%)
- Data Table on Europe - Year-over-year growth 2023-2028 (%)
- 9.5 APAC - Market size and forecast 2023-2028
- Chart on APAC - Market size and forecast 2023-2028 ($ billion)
- Data Table on APAC - Market size and forecast 2023-2028 ($ billion)
- Chart on APAC - Year-over-year growth 2023-2028 (%)
- Data Table on APAC - Year-over-year growth 2023-2028 (%)
- 9.6 South America - Market size and forecast 2023-2028
- Chart on South America - Market size and forecast 2023-2028 ($ billion)
- Data Table on South America - Market size and forecast 2023-2028 ($ billion)
- Chart on South America - Year-over-year growth 2023-2028 (%)
- Data Table on South America - Year-over-year growth 2023-2028 (%)
- 9.7 Middle East and Africa - Market size and forecast 2023-2028
- Chart on Middle East and Africa - Market size and forecast 2023-2028 ($ billion)
- Data Table on Middle East and Africa - Market size and forecast 2023-2028 ($ billion)
- Chart on Middle East and Africa - Year-over-year growth 2023-2028 (%)
- Data Table on Middle East and Africa - Year-over-year growth 2023-2028 (%)
- 9.8 US - Market size and forecast 2023-2028
- Chart on US - Market size and forecast 2023-2028 ($ billion)
- Data Table on US - Market size and forecast 2023-2028 ($ billion)
- Chart on US - Year-over-year growth 2023-2028 (%)
- Data Table on US - Year-over-year growth 2023-2028 (%)
- 9.9 China - Market size and forecast 2023-2028
- Chart on China - Market size and forecast 2023-2028 ($ billion)
- Data Table on China - Market size and forecast 2023-2028 ($ billion)
- Chart on China - Year-over-year growth 2023-2028 (%)
- Data Table on China - Year-over-year growth 2023-2028 (%)
- 9.10 Canada - Market size and forecast 2023-2028
- Chart on Canada - Market size and forecast 2023-2028 ($ billion)
- Data Table on Canada - Market size and forecast 2023-2028 ($ billion)
- Chart on Canada - Year-over-year growth 2023-2028 (%)
- Data Table on Canada - Year-over-year growth 2023-2028 (%)
- 9.11 Argentina - Market size and forecast 2023-2028
- Chart on Argentina - Market size and forecast 2023-2028 ($ billion)
- Data Table on Argentina - Market size and forecast 2023-2028 ($ billion)
- Chart on Argentina - Year-over-year growth 2023-2028 (%)
- Data Table on Argentina - Year-over-year growth 2023-2028 (%)
- 9.12 Australia - Market size and forecast 2023-2028
- Chart on Australia - Market size and forecast 2023-2028 ($ billion)
- Data Table on Australia - Market size and forecast 2023-2028 ($ billion)
- Chart on Australia - Year-over-year growth 2023-2028 (%)
- Data Table on Australia - Year-over-year growth 2023-2028 (%)
- 9.13 Market opportunity by geography
- Market opportunity by geography ($ billion)
- Data Tables on Market opportunity by geography ($ billion)
10 Drivers, Challenges, and Opportunity/Restraints
- 10.1 Market drivers
- 10.2 Market challenges
- 10.3 Impact of drivers and challenges
- Impact of drivers and challenges in 2023 and 2028
- 10.4 Market opportunities/restraints
11 Competitive Landscape
- 11.1 Overview
- 11.2 Competitive Landscape
- Overview on criticality of inputs and factors of differentiation
- 11.3 Landscape disruption
- Overview on factors of disruption
- 11.4 Industry risks
- Impact of key risks on business
12 Competitive Analysis
- 12.1 Companies profiled
- Companies covered
- 12.2 Market positioning of companies
- Matrix on companies position and classification
- 12.3 AWC Frac Technology
- AWC Frac Technology - Overview
- AWC Frac Technology - Product / Service
- AWC Frac Technology - Key offerings
- 12.4 Baker Hughes Co.
- Baker Hughes Co. - Overview
- Baker Hughes Co. - Business segments
- Baker Hughes Co. - Key news
- Baker Hughes Co. - Key offerings
- Baker Hughes Co. - Segment focus
- 12.5 Calfrac Well Services Ltd.
- Calfrac Well Services Ltd. - Overview
- Calfrac Well Services Ltd. - Business segments
- Calfrac Well Services Ltd. - Key offerings
- Calfrac Well Services Ltd. - Segment focus
- 12.6 Caterpillar Inc.
- Caterpillar Inc. - Overview
- Caterpillar Inc. - Business segments
- Caterpillar Inc. - Key news
- Caterpillar Inc. - Key offerings
- Caterpillar Inc. - Segment focus
- 12.7 CCSC Petroleum Equipment Co. Ltd.
- CCSC Petroleum Equipment Co. Ltd. - Overview
- CCSC Petroleum Equipment Co. Ltd. - Product / Service
- CCSC Petroleum Equipment Co. Ltd. - Key offerings
- 12.8 Covenant Testing Technologies LLC
- Covenant Testing Technologies LLC - Overview
- Covenant Testing Technologies LLC - Product / Service
- Covenant Testing Technologies LLC - Key offerings
- 12.9 Halliburton Co.
- Halliburton Co. - Overview
- Halliburton Co. - Business segments
- Halliburton Co. - Key news
- Halliburton Co. - Key offerings
- Halliburton Co. - Segment focus
- 12.10 Moto Mechanics Argentina SA
- Moto Mechanics Argentina SA - Overview
- Moto Mechanics Argentina SA - Product / Service
- Moto Mechanics Argentina SA - Key offerings
- 12.11 Oil States International Inc.
- Oil States International Inc. - Overview
- Oil States International Inc. - Business segments
- Oil States International Inc. - Key offerings
- Oil States International Inc. - Segment focus
- 12.12 REIN PROCESS EQUIPMENT JIANGSU CO. LTD.
- REIN PROCESS EQUIPMENT JIANGSU CO. LTD. - Overview
- REIN PROCESS EQUIPMENT JIANGSU CO. LTD. - Product / Service
- REIN PROCESS EQUIPMENT JIANGSU CO. LTD. - Key offerings
- 12.13 Schlumberger Ltd.
- Schlumberger Ltd. - Overview
- Schlumberger Ltd. - Business segments
- Schlumberger Ltd. - Key news
- Schlumberger Ltd. - Key offerings
- Schlumberger Ltd. - Segment focus
- 12.14 SHAANXI KERGY MECHANICAL EQUIPMENT CO. LTD.
- SHAANXI KERGY MECHANICAL EQUIPMENT CO. LTD. - Overview
- SHAANXI KERGY MECHANICAL EQUIPMENT CO. LTD. - Product / Service
- SHAANXI KERGY MECHANICAL EQUIPMENT CO. LTD. - Key offerings
- 12.15 Worldwide Oilfield Machine Inc.
- Worldwide Oilfield Machine Inc. - Overview
- Worldwide Oilfield Machine Inc. - Product / Service
- Worldwide Oilfield Machine Inc. - Key offerings
- 12.16 Yancheng Qihang Petroleum Machinery Co. Ltd.
- Yancheng Qihang Petroleum Machinery Co. Ltd. - Overview
- Yancheng Qihang Petroleum Machinery Co. Ltd. - Product / Service
- Yancheng Qihang Petroleum Machinery Co. Ltd. - Key offerings
- 12.17 Yantai Jereh Oilfield Services Group Co. Ltd.
- Yantai Jereh Oilfield Services Group Co. Ltd. - Overview
- Yantai Jereh Oilfield Services Group Co. Ltd. - Product / Service
- Yantai Jereh Oilfield Services Group Co. Ltd. - Key offerings
13 Appendix
- 13.1 Scope of the report
- 13.2 Inclusions and exclusions checklist
- Inclusions checklist
- Exclusions checklist
- 13.3 Currency conversion rates for US$
- Currency conversion rates for US$
- 13.4 Research methodology
- Research methodology
- 13.5 Data procurement
- Information sources
- 13.6 Data validation
- Data validation
- 13.7 Validation techniques employed for market sizing
- Validation techniques employed for market sizing
- 13.8 Data synthesis
- Data synthesis
- 13.9 360 degree market analysis
- 360 degree market analysis
- 13.10 List of abbreviations
- List of abbreviations
