|
|
市場調査レポート
商品コード
1516458
蛍光光度計の世界市場 2024-2028Global Fluorometers Market 2024-2028 |
||||||
|
|||||||
カスタマイズ可能
|
|||||||

| 蛍光光度計の世界市場 2024-2028 |
|
出版日: 2024年05月29日
発行: TechNavio
ページ情報: 英文 170 Pages
納期: 即納可能
|

全表示
- 概要
- 図表
- 目次
蛍光光度計市場は2023-2028年に1億5,188万米ドル、予測期間中のCAGRは6.71%で成長すると予測されます。
当レポートでは、蛍光光度計市場の全体的な分析、市場規模・予測、動向、成長促進要因、課題、約25のベンダーを網羅したベンダー分析などを掲載しています。
現在の市場シナリオ、最新動向と促進要因、市場環境全体に関する最新分析を提供しています。市場は、蛍光技術の進歩、小型化・ポータブル化に対する需要の高まり、個別化医療に対する認識と導入の高まりが牽引しています。
| 市場範囲 | |
|---|---|
| 基準年 | 2024 |
| 終了年 | 2028 |
| 予測期間 | 2024-2028 |
| 成長モメンタム | 加速 |
| 前年比2024年 | 6.57% |
| CAGR | 6.71% |
| 増分額 | 1億5,188万米ドル |
全反射蛍光(TIRF)顕微鏡の登場は、今後数年間の蛍光光度計市場成長を牽引する主要因の一つです。また、新規蛍光色素の市場開発、ライフサイエンス業界における自動化とワークフロー合理化への注目の高まりは、市場の大きな需要につながります。
目次
第1章 エグゼクティブサマリー
- 市場概要
第2章 市場情勢
- 市場エコシステム
第3章 市場規模の評価
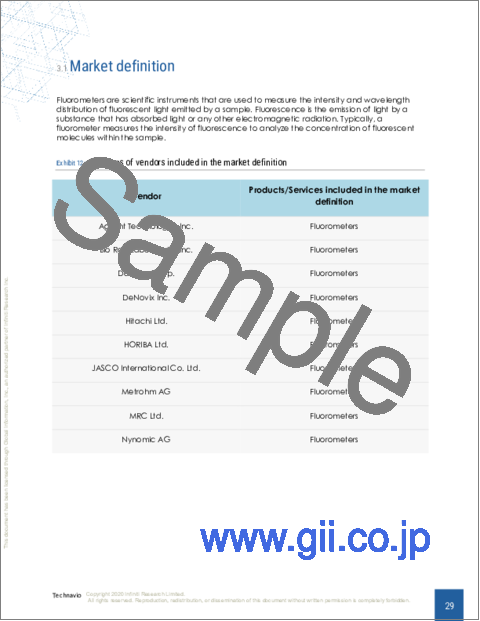
- 市場の定義
- 市場セグメント分析
- 市場規模 2023
- 市場の見通し 2023-2028
第4章 市場規模実績
- 蛍光光度計の世界市場 2018-2022
- タイプ別セグメント分析 2018-2022
- エンドユーザー別セグメント分析 2018-2022
- 地域別セグメント分析 2018-2022
- 国別セグメント分析 2018-2022
第5章 ファイブフォース分析
- ファイブフォースの要約
- 買い手の交渉力
- 供給企業の交渉力
- 新規参入業者の脅威
- 代替品の脅威
- 競争の脅威
- 市況
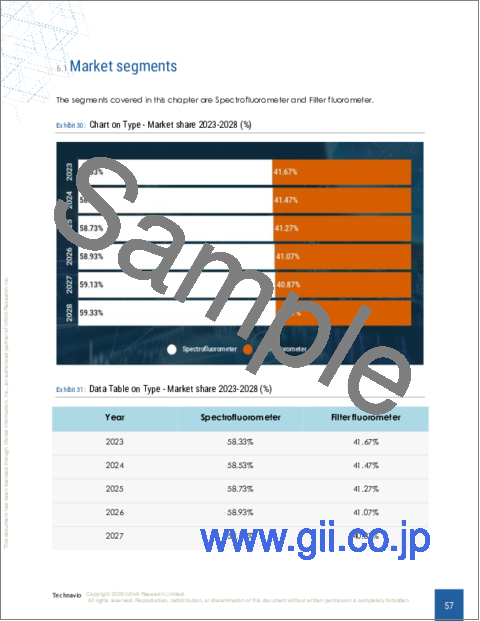
第6章 市場セグメンテーション:タイプ別
- 市場セグメンテーション
- 比較:タイプ別
- 分光蛍光計:市場規模と予測 2023-2028
- フィルター蛍光計:市場規模と予測 2023-2028
- 市場機会:タイプ別
第7章 市場セグメンテーション:エンドユーザー別
- 市場セグメンテーション
- 比較:エンドユーザー別
- ヘルスケア業界:市場規模と予測 2023-2028
- 調査室および機関:市場規模と予測 2023-2028
- その他:市場規模と予測 2023-2028
- 市場機会:エンドユーザー別
第8章 顧客情勢
- 顧客情勢の概要
第9章 地域別情勢
- 地域別セグメンテーション
- 地域別比較
- 北米:市場規模と予測 2023-2028
- 欧州:市場規模と予測 2023-2028
- アジア:市場規模と予測 2023-2028
- 世界のその他の地域:市場規模と予測 2023-2028
- 米国:市場規模と予測 2023-2028
- 中国:市場規模と予測 2023-2028
- ドイツ:市場規模と予測 2023-2028
- 英国:市場規模と予測 2023-2028
- 日本:市場規模と予測 2023-2028
- 市場機会:地域別
第10章 促進要因、課題、および動向
- 市場促進要因
- 市場の課題
- 促進要因と課題の影響
- 市場動向
第11章 ベンダー情勢
- 概要
- ベンダー情勢
- 混乱の状況
- 業界のリスク
第12章 ベンダー分析
- 対象ベンダー
- ベンダーの市場ポジショニング
- Agilent Technologies Inc.
- Bio Rad Laboratories Inc.
- Danaher Corp.
- DeNovix Inc.
- Hitachi Ltd.
- HORIBA Ltd.
- JASCO International Co. Ltd.
- Metrohm AG
- MRC Ltd.
- Nynomic AG
- PerkinElmer Inc.
- Promega Corp.
- Shimadzu Corp.
- Techcomp Instruments Ltd.
- Thermo Fisher Scientific Inc.
第13章 付録
Exhibits:
- Exhibits1: Executive Summary - Chart on Market Overview
- Exhibits2: Executive Summary - Data Table on Market Overview
- Exhibits3: Executive Summary - Chart on Global Market Characteristics
- Exhibits4: Executive Summary - Chart on Market by Geography
- Exhibits5: Executive Summary - Chart on Market Segmentation by Type
- Exhibits6: Executive Summary - Chart on Market Segmentation by End-user
- Exhibits7: Executive Summary - Chart on Incremental Growth
- Exhibits8: Executive Summary - Data Table on Incremental Growth
- Exhibits9: Executive Summary - Chart on Vendor Market Positioning
- Exhibits10: Parent market
- Exhibits11: Market Characteristics
- Exhibits12: Offerings of vendors included in the market definition
- Exhibits13: Market segments
- Exhibits14: Chart on Global - Market size and forecast 2023-2028 ($ million)
- Exhibits15: Data Table on Global - Market size and forecast 2023-2028 ($ million)
- Exhibits16: Chart on Global Market: Year-over-year growth 2023-2028 (%)
- Exhibits17: Data Table on Global Market: Year-over-year growth 2023-2028 (%)
- Exhibits18: Historic Market Size - Data Table on global fluorometers market 2018 - 2022 ($ million)
- Exhibits19: Historic Market Size - Type Segment 2018 - 2022 ($ million)
- Exhibits20: Historic Market Size - End-user Segment 2018 - 2022 ($ million)
- Exhibits21: Historic Market Size - Geography Segment 2018 - 2022 ($ million)
- Exhibits22: Historic Market Size - Country Segment 2018 - 2022 ($ million)
- Exhibits23: Five forces analysis - Comparison between 2023 and 2028
- Exhibits24: Chart on Bargaining power of buyers - Impact of key factors 2023 and 2028
- Exhibits25: Bargaining power of suppliers - Impact of key factors in 2023 and 2028
- Exhibits26: Threat of new entrants - Impact of key factors in 2023 and 2028
- Exhibits27: Threat of substitutes - Impact of key factors in 2023 and 2028
- Exhibits28: Threat of rivalry - Impact of key factors in 2023 and 2028
- Exhibits29: Chart on Market condition - Five forces 2023 and 2028
- Exhibits30: Chart on Type - Market share 2023-2028 (%)
- Exhibits31: Data Table on Type - Market share 2023-2028 (%)
- Exhibits32: Chart on Comparison by Type
- Exhibits33: Data Table on Comparison by Type
- Exhibits34: Chart on Spectrofluorometer - Market size and forecast 2023-2028 ($ million)
- Exhibits35: Data Table on Spectrofluorometer - Market size and forecast 2023-2028 ($ million)
- Exhibits36: Chart on Spectrofluorometer - Year-over-year growth 2023-2028 (%)
- Exhibits37: Data Table on Spectrofluorometer - Year-over-year growth 2023-2028 (%)
- Exhibits38: Chart on Filter fluorometer - Market size and forecast 2023-2028 ($ million)
- Exhibits39: Data Table on Filter fluorometer - Market size and forecast 2023-2028 ($ million)
- Exhibits40: Chart on Filter fluorometer - Year-over-year growth 2023-2028 (%)
- Exhibits41: Data Table on Filter fluorometer - Year-over-year growth 2023-2028 (%)
- Exhibits42: Market opportunity by Type ($ million)
- Exhibits43: Data Table on Market opportunity by Type ($ million)
- Exhibits44: Chart on End-user - Market share 2023-2028 (%)
- Exhibits45: Data Table on End-user - Market share 2023-2028 (%)
- Exhibits46: Chart on Comparison by End-user
- Exhibits47: Data Table on Comparison by End-user
- Exhibits48: Chart on Healthcare industry - Market size and forecast 2023-2028 ($ million)
- Exhibits49: Data Table on Healthcare industry - Market size and forecast 2023-2028 ($ million)
- Exhibits50: Chart on Healthcare industry - Year-over-year growth 2023-2028 (%)
- Exhibits51: Data Table on Healthcare industry - Year-over-year growth 2023-2028 (%)
- Exhibits52: Chart on Research laboratories and institutions - Market size and forecast 2023-2028 ($ million)
- Exhibits53: Data Table on Research laboratories and institutions - Market size and forecast 2023-2028 ($ million)
- Exhibits54: Chart on Research laboratories and institutions - Year-over-year growth 2023-2028 (%)
- Exhibits55: Data Table on Research laboratories and institutions - Year-over-year growth 2023-2028 (%)
- Exhibits56: Chart on Others - Market size and forecast 2023-2028 ($ million)
- Exhibits57: Data Table on Others - Market size and forecast 2023-2028 ($ million)
- Exhibits58: Chart on Others - Year-over-year growth 2023-2028 (%)
- Exhibits59: Data Table on Others - Year-over-year growth 2023-2028 (%)
- Exhibits60: Market opportunity by End-user ($ million)
- Exhibits61: Data Table on Market opportunity by End-user ($ million)
- Exhibits62: Analysis of price sensitivity, lifecycle, customer purchase basket, adoption rates, and purchase criteria
- Exhibits63: Chart on Market share by geography 2023-2028 (%)
- Exhibits64: Data Table on Market share by geography 2023-2028 (%)
- Exhibits65: Chart on Geographic comparison
- Exhibits66: Data Table on Geographic comparison
- Exhibits67: Chart on North America - Market size and forecast 2023-2028 ($ million)
- Exhibits68: Data Table on North America - Market size and forecast 2023-2028 ($ million)
- Exhibits69: Chart on North America - Year-over-year growth 2023-2028 (%)
- Exhibits70: Data Table on North America - Year-over-year growth 2023-2028 (%)
- Exhibits71: Chart on Europe - Market size and forecast 2023-2028 ($ million)
- Exhibits72: Data Table on Europe - Market size and forecast 2023-2028 ($ million)
- Exhibits73: Chart on Europe - Year-over-year growth 2023-2028 (%)
- Exhibits74: Data Table on Europe - Year-over-year growth 2023-2028 (%)
- Exhibits75: Chart on Asia - Market size and forecast 2023-2028 ($ million)
- Exhibits76: Data Table on Asia - Market size and forecast 2023-2028 ($ million)
- Exhibits77: Chart on Asia - Year-over-year growth 2023-2028 (%)
- Exhibits78: Data Table on Asia - Year-over-year growth 2023-2028 (%)
- Exhibits79: Chart on Rest of World (ROW) - Market size and forecast 2023-2028 ($ million)
- Exhibits80: Data Table on Rest of World (ROW) - Market size and forecast 2023-2028 ($ million)
- Exhibits81: Chart on Rest of World (ROW) - Year-over-year growth 2023-2028 (%)
- Exhibits82: Data Table on Rest of World (ROW) - Year-over-year growth 2023-2028 (%)
- Exhibits83: Chart on US - Market size and forecast 2023-2028 ($ million)
- Exhibits84: Data Table on US - Market size and forecast 2023-2028 ($ million)
- Exhibits85: Chart on US - Year-over-year growth 2023-2028 (%)
- Exhibits86: Data Table on US - Year-over-year growth 2023-2028 (%)
- Exhibits87: Chart on China - Market size and forecast 2023-2028 ($ million)
- Exhibits88: Data Table on China - Market size and forecast 2023-2028 ($ million)
- Exhibits89: Chart on China - Year-over-year growth 2023-2028 (%)
- Exhibits90: Data Table on China - Year-over-year growth 2023-2028 (%)
- Exhibits91: Chart on Germany - Market size and forecast 2023-2028 ($ million)
- Exhibits92: Data Table on Germany - Market size and forecast 2023-2028 ($ million)
- Exhibits93: Chart on Germany - Year-over-year growth 2023-2028 (%)
- Exhibits94: Data Table on Germany - Year-over-year growth 2023-2028 (%)
- Exhibits95: Chart on UK - Market size and forecast 2023-2028 ($ million)
- Exhibits96: Data Table on UK - Market size and forecast 2023-2028 ($ million)
- Exhibits97: Chart on UK - Year-over-year growth 2023-2028 (%)
- Exhibits98: Data Table on UK - Year-over-year growth 2023-2028 (%)
- Exhibits99: Chart on Japan - Market size and forecast 2023-2028 ($ million)
- Exhibits100: Data Table on Japan - Market size and forecast 2023-2028 ($ million)
- Exhibits101: Chart on Japan - Year-over-year growth 2023-2028 (%)
- Exhibits102: Data Table on Japan - Year-over-year growth 2023-2028 (%)
- Exhibits103: Market opportunity by geography ($ million)
- Exhibits104: Data Tables on Market opportunity by geography ($ million)
- Exhibits105: Impact of drivers and challenges in 2023 and 2028
- Exhibits106: Overview on Criticality of inputs and Factors of differentiation
- Exhibits107: Overview on factors of disruption
- Exhibits108: Impact of key risks on business
- Exhibits109: Vendors covered
- Exhibits110: Matrix on vendor position and classification
- Exhibits111: Agilent Technologies Inc. - Overview
- Exhibits112: Agilent Technologies Inc. - Business segments
- Exhibits113: Agilent Technologies Inc. - Key news
- Exhibits114: Agilent Technologies Inc. - Key offerings
- Exhibits115: Agilent Technologies Inc. - Segment focus
- Exhibits116: Bio Rad Laboratories Inc. - Overview
- Exhibits117: Bio Rad Laboratories Inc. - Business segments
- Exhibits118: Bio Rad Laboratories Inc. - Key news
- Exhibits119: Bio Rad Laboratories Inc. - Key offerings
- Exhibits120: Bio Rad Laboratories Inc. - Segment focus
- Exhibits121: Danaher Corp. - Overview
- Exhibits122: Danaher Corp. - Business segments
- Exhibits123: Danaher Corp. - Key news
- Exhibits124: Danaher Corp. - Key offerings
- Exhibits125: Danaher Corp. - Segment focus
- Exhibits126: DeNovix Inc. - Overview
- Exhibits127: DeNovix Inc. - Product / Service
- Exhibits128: DeNovix Inc. - Key offerings
- Exhibits129: Hitachi Ltd. - Overview
- Exhibits130: Hitachi Ltd. - Business segments
- Exhibits131: Hitachi Ltd. - Key news
- Exhibits132: Hitachi Ltd. - Key offerings
- Exhibits133: Hitachi Ltd. - Segment focus
- Exhibits134: HORIBA Ltd. - Overview
- Exhibits135: HORIBA Ltd. - Business segments
- Exhibits136: HORIBA Ltd. - Key offerings
- Exhibits137: HORIBA Ltd. - Segment focus
- Exhibits138: JASCO International Co. Ltd. - Overview
- Exhibits139: JASCO International Co. Ltd. - Product / Service
- Exhibits140: JASCO International Co. Ltd. - Key offerings
- Exhibits141: Metrohm AG - Overview
- Exhibits142: Metrohm AG - Product / Service
- Exhibits143: Metrohm AG - Key offerings
- Exhibits144: MRC Ltd. - Overview
- Exhibits145: MRC Ltd. - Product / Service
- Exhibits146: MRC Ltd. - Key offerings
- Exhibits147: Nynomic AG - Overview
- Exhibits148: Nynomic AG - Business segments
- Exhibits149: Nynomic AG - Key offerings
- Exhibits150: Nynomic AG - Segment focus
- Exhibits151: PerkinElmer Inc. - Overview
- Exhibits152: PerkinElmer Inc. - Business segments
- Exhibits153: PerkinElmer Inc. - Key news
- Exhibits154: PerkinElmer Inc. - Key offerings
- Exhibits155: PerkinElmer Inc. - Segment focus
- Exhibits156: Promega Corp. - Overview
- Exhibits157: Promega Corp. - Product / Service
- Exhibits158: Promega Corp. - Key offerings
- Exhibits159: Shimadzu Corp. - Overview
- Exhibits160: Shimadzu Corp. - Business segments
- Exhibits161: Shimadzu Corp. - Key offerings
- Exhibits162: Shimadzu Corp. - Segment focus
- Exhibits163: Techcomp Instruments Ltd. - Overview
- Exhibits164: Techcomp Instruments Ltd. - Product / Service
- Exhibits165: Techcomp Instruments Ltd. - Key offerings
- Exhibits166: Thermo Fisher Scientific Inc. - Overview
- Exhibits167: Thermo Fisher Scientific Inc. - Business segments
- Exhibits168: Thermo Fisher Scientific Inc. - Key news
- Exhibits169: Thermo Fisher Scientific Inc. - Key offerings
- Exhibits170: Thermo Fisher Scientific Inc. - Segment focus
- Exhibits171: Inclusions checklist
- Exhibits172: Exclusions checklist
- Exhibits173: Currency conversion rates for US$
- Exhibits174: Research methodology
- Exhibits175: Validation techniques employed for market sizing
- Exhibits176: Information sources
- Exhibits177: List of abbreviations
The fluorometers market is forecasted to grow by USD 151.88 mn during 2023-2028, accelerating AT a CAGR of 6.71% during the forecast period. The report on the fluorometers market provides a holistic analysis, market size and forecast, trends, growth drivers, and challenges, as well as vendor analysis covering around 25 vendors.
The report offers an up-to-date analysis regarding the current market scenario, the latest trends and drivers, and the overall market environment. The market is driven by advancements in fluorescence techniques, growing demand for miniaturized and portable fluorometers, and rising awareness and adoption of personalized medicine.
Technavio's fluorometers market is segmented as below:
| Market Scope | |
|---|---|
| Base Year | 2024 |
| End Year | 2028 |
| Series Year | 2024-2028 |
| Growth Momentum | Accelerate |
| YOY 2024 | 6.57% |
| CAGR | 6.71% |
| Incremental Value | $151.88mn |
By Type
- Spectrofluorometer
- Filter fluorometer
By End-user
- Healthcare industry
- Research laboratories and institutions
- Others
By Geography
- North America
- Europe
- Asia
- Rest of World (ROW)
This study identifies the advent of total internal reflection fluorescence (TIRF) microscopy as one of the prime reasons driving the fluorometers market growth during the next few years. Also, development of novel fluorophores and growing focus on automation and streamlining workflows in life sciences industry will lead to sizable demand in the market.
The report on the fluorometers market covers the following areas:
- Fluorometers market sizing
- Fluorometers market forecast
- Fluorometers market industry analysis
The robust vendor analysis is designed to help clients improve their market position, and in line with this, this report provides a detailed analysis of several leading fluorometers market vendors that include Agilent Technologies Inc., Bentham, Bio RAD Laboratories Inc., Danaher Corp., DeNovix Inc., Hitachi Ltd., HORIBA Ltd., Iwaki Co. Ltd., JASCO International Co. Ltd., Metrohm AG, MRC Ltd., Nynomic AG, Ocean Insight, PerkinElmer Inc., Promega Corp., Shimadzu Corp., Starna Scientific Ltd., Techcomp Instruments Ltd., Thermo Fisher Scientific Inc., and Turner Designs Inc.. Also, the fluorometers market analysis report includes information on upcoming trends and challenges that will influence market growth. This is to help companies strategize and leverage all forthcoming growth opportunities.
The study was conducted using an objective combination of primary and secondary information including inputs from key participants in the industry. The report contains a comprehensive market and vendor landscape in addition to an analysis of the key vendors.
The publisher presents a detailed picture of the market by the way of study, synthesis, and summation of data from multiple sources by an analysis of key parameters such as profit, pricing, competition, and promotions. IT presents various market facets by identifying the key industry influencers. The data presented is comprehensive, reliable, and a result of extensive research - both primary and secondary. The market research reports provide a complete competitive landscape and an in-depth vendor selection methodology and analysis using qualitative and quantitative research to forecast the accurate market growth.
Table of Contents
1 Executive Summary
- 1.1 Market overview
2 Market Landscape
- 2.1 Market ecosystem
3 Market Sizing
- 3.1 Market definition
- 3.2 Market segment analysis
- 3.3 Market size 2023
- 3.4 Market outlook: Forecast for 2023-2028
4 Historic Market Size
- 4.1 Global fluorometers market 2018 - 2022
- 4.2 Type Segment Analysis 2018 - 2022
- 4.3 End-user Segment Analysis 2018 - 2022
- 4.4 Geography Segment Analysis 2018 - 2022
- 4.5 Country Segment Analysis 2018 - 2022
5 Five Forces Analysis
- 5.1 Five forces summary
- 5.2 Bargaining power of buyers
- 5.3 Bargaining power of suppliers
- 5.4 Threat of new entrants
- 5.5 Threat of substitutes
- 5.6 Threat of rivalry
- 5.7 Market condition
6 Market Segmentation by Type
- 6.1 Market segments
- 6.2 Comparison by Type
- 6.3 Spectrofluorometer - Market size and forecast 2023-2028
- 6.4 Filter fluorometer - Market size and forecast 2023-2028
- 6.5 Market opportunity by Type
7 Market Segmentation by End-user
- 7.1 Market segments
- 7.2 Comparison by End-user
- 7.3 Healthcare industry - Market size and forecast 2023-2028
- 7.4 Research laboratories and institutions - Market size and forecast 2023-2028
- 7.5 Others - Market size and forecast 2023-2028
- 7.6 Market opportunity by End-user
8 Customer Landscape
- 8.1 Customer landscape overview
9 Geographic Landscape
- 9.1 Geographic segmentation
- 9.2 Geographic comparison
- 9.3 North America - Market size and forecast 2023-2028
- 9.4 Europe - Market size and forecast 2023-2028
- 9.5 Asia - Market size and forecast 2023-2028
- 9.6 Rest of World (ROW) - Market size and forecast 2023-2028
- 9.7 US - Market size and forecast 2023-2028
- 9.8 China - Market size and forecast 2023-2028
- 9.9 Germany - Market size and forecast 2023-2028
- 9.10 UK - Market size and forecast 2023-2028
- 9.11 Japan - Market size and forecast 2023-2028
- 9.12 Market opportunity by geography
10 Drivers, Challenges, and Trends
- 10.1 Market drivers
- 10.2 Market challenges
- 10.3 Impact of drivers and challenges
- 10.4 Market trends
11 Vendor Landscape
- 11.1 Overview
- 11.2 Vendor landscape
- 11.3 Landscape disruption
- 11.4 Industry risks
12 Vendor Analysis
- 12.1 Vendors covered
- 12.2 Market positioning of vendors
- 12.3 Agilent Technologies Inc.
- 12.4 Bio Rad Laboratories Inc.
- 12.5 Danaher Corp.
- 12.6 DeNovix Inc.
- 12.7 Hitachi Ltd.
- 12.8 HORIBA Ltd.
- 12.9 JASCO International Co. Ltd.
- 12.10 Metrohm AG
- 12.11 MRC Ltd.
- 12.12 Nynomic AG
- 12.13 PerkinElmer Inc.
- 12.14 Promega Corp.
- 12.15 Shimadzu Corp.
- 12.16 Techcomp Instruments Ltd.
- 12.17 Thermo Fisher Scientific Inc.
13 Appendix
- 13.1 Scope of the report
- 13.2 Inclusions and exclusions checklist
- 13.3 Currency conversion rates for US$
- 13.4 Research methodology
- 13.5 List of abbreviations

