|
|
市場調査レポート
商品コード
1516315
ジェスチャー認識ソリューションの世界市場 2024-2028Global gesture recognition solution market 2024-2028 |
||||||
|
|||||||
カスタマイズ可能
|
|||||||

| ジェスチャー認識ソリューションの世界市場 2024-2028 |
|
出版日: 2024年06月12日
発行: TechNavio
ページ情報: 英文 181 Pages
納期: 即納可能
|

全表示
- 概要
- 図表
- 目次
ジェスチャー認識ソリューション市場は2023-2028年に734億4,030万米ドル、予測期間中のCAGRは37.91%で成長すると予測されます。
当レポートでは、ジェスチャー認識ソリューション市場の全体的な分析、市場規模・予測、動向、成長促進要因、課題、約25のベンダーを網羅したベンダー分析などを掲載しています。
現在の市場シナリオ、最新動向と促進要因、市場環境全体に関する最新分析を提供しています。市場は、ジェスチャー認識をサポートするプロセッサの開発の増加、自動車産業におけるHMI技術の導入の増加、自動車ジェスチャー認識システムにおける様々なマシンビジョン技術の開発によって牽引されています。
| 市場範囲 | |
|---|---|
| 基準年 | 2024 |
| 終了年 | 2028 |
| 予測期間 | 2024-2028 |
| 成長モメンタム | 加速 |
| 前年比2024年 | 28.4% |
| CAGR | 37.91% |
| 増分額 | 734億4,030万米ドル |
本調査では、今後数年間のジェスチャー認識ソリューション市場成長を牽引する主要因の1つとして、ジェスチャー認識用ToFカメラの優先度が高まっていることを挙げています。また、ジェスチャー認識ソリューションエコシステムにおける市場統合、電気自動車や自律走行車の進歩が市場の大きな需要につながります。
目次
第1章 エグゼクティブサマリー
- 市場概要
第2章 市場情勢
- 市場エコシステム
- 市場の特徴
- バリューチェーン分析
第3章 市場規模の評価
- 市場の定義
- 市場セグメント分析
- 市場規模 2023
- 市場の見通し 2023-2028
第4章 市場規模実績
- 世界ジェスチャー認識ソリューション市場 2018-2022
- 技術別セグメント分析 2018-2022
- 用途別セグメント分析 2018-2022
- 地域別セグメント分析 2018-2022
- 国別セグメント分析 2018-2022
第5章 ファイブフォース分析
- ファイブフォースの要約
- 買い手の交渉力
- 供給企業の交渉力
- 新規参入業者の脅威
- 代替品の脅威
- 競争の脅威
- 市況
第6章 市場セグメンテーション:技術別
- 市場セグメンテーション
- 比較:技術別
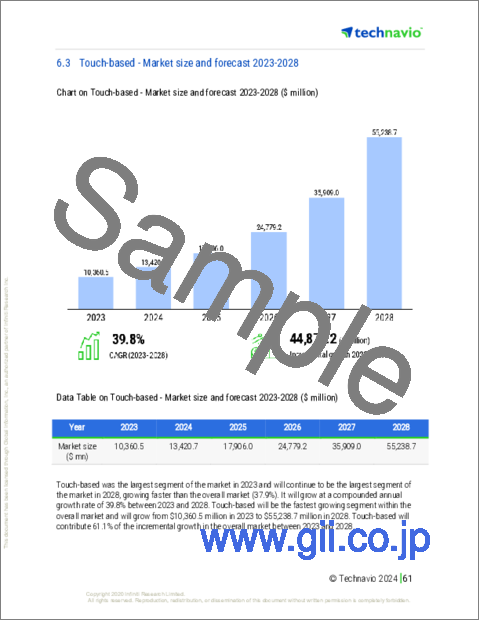
- タッチベース:市場規模と予測 2023-2028
- タッチレス:市場規模と予測 2023-2028
- 市場機会:技術別
第7章 市場セグメンテーション:用途別
- 市場セグメンテーション
- 比較:用途別
- ゲーム機:市場規模と予測 2023-2028
- スマートフォン:市場規模と予測 2023-2028
- 自動車:市場規模と予測 2023-2028
- PC:市場規模と予測 2023-2028
- 市場機会:用途別
第8章 顧客情勢
- 顧客情勢の概要
第9章 地域別情勢
- 地域別セグメンテーション
- 地域別比較
- アジア太平洋:市場規模と予測 2023-2028
- 北米:市場規模と予測 2023-2028
- 欧州:市場規模と予測 2023-2028
- 中東・アフリカ:市場規模と予測 2023-2028
- 南米:市場規模と予測 2023-2028
- 米国:市場規模と予測 2023-2028
- 中国:市場規模と予測 2023-2028
- 日本:市場規模と予測 2023-2028
- ドイツ:市場規模と予測 2023-2028
- 韓国:市場規模と予測 2023-2028
- 市場機会:地域別
第10章 促進要因・課題・機会・抑制要因
- 市場促進要因
- 市場の課題
- 促進要因と課題の影響
- 市場の機会・抑制要因
第11章 競合情勢
- 概要
- 競合情勢
- 混乱の状況
- 業界のリスク
第12章 競合分析
- 企業プロファイル
- 企業の市場ポジショニング
- Alphabet Inc.
- Apple Inc.
- Cipia Vision Ltd.
- GestureTek technologies
- Infineon Technologies AG
- Intel Corp.
- IrisGuard Ltd.
- Jabil Inc.
- Microchip Technology Inc.
- NVIDIA Corp.
- OMRON Corp.
- Qualcomm Inc.
- STMicroelectronics International N.V.
- Synaptics Inc.
- Ultraleap Ltd.
第13章 付録
Exhibits:
- Exhibits1: Executive Summary - Chart on Market Overview
- Exhibits2: Executive Summary - Data Table on Market Overview
- Exhibits3: Executive Summary - Chart on Global Market Characteristics
- Exhibits4: Executive Summary - Chart on Market by Geography
- Exhibits5: Executive Summary - Chart on Market Segmentation by Technology
- Exhibits6: Executive Summary - Chart on Market Segmentation by Application
- Exhibits7: Executive Summary - Chart on Incremental Growth
- Exhibits8: Executive Summary - Data Table on Incremental Growth
- Exhibits9: Executive Summary - Chart on Company Market Positioning
- Exhibits10: Parent Market
- Exhibits11: Data Table on - Parent Market
- Exhibits12: Market characteristics analysis
- Exhibits13: Value Chain Analysis
- Exhibits14: Offerings of companies included in the market definition
- Exhibits15: Market segments
- Exhibits16: Chart on Global - Market size and forecast 2023-2028 ($ million)
- Exhibits17: Data Table on Global - Market size and forecast 2023-2028 ($ million)
- Exhibits18: Chart on Global Market: Year-over-year growth 2023-2028 (%)
- Exhibits19: Data Table on Global Market: Year-over-year growth 2023-2028 (%)
- Exhibits20: Historic Market Size - Data Table on Global Gesture Recognition Solution Market 2018 - 2022 ($ million)
- Exhibits21: Historic Market Size - Technology Segment 2018 - 2022 ($ million)
- Exhibits22: Historic Market Size - Application Segment 2018 - 2022 ($ million)
- Exhibits23: Historic Market Size - Geography Segment 2018 - 2022 ($ million)
- Exhibits24: Historic Market Size - Country Segment 2018 - 2022 ($ million)
- Exhibits25: Five forces analysis - Comparison between 2023 and 2028
- Exhibits26: Bargaining power of buyers - Impact of key factors 2023 and 2028
- Exhibits27: Bargaining power of suppliers - Impact of key factors in 2023 and 2028
- Exhibits28: Threat of new entrants - Impact of key factors in 2023 and 2028
- Exhibits29: Threat of substitutes - Impact of key factors in 2023 and 2028
- Exhibits30: Threat of rivalry - Impact of key factors in 2023 and 2028
- Exhibits31: Chart on Market condition - Five forces 2023 and 2028
- Exhibits32: Chart on Technology - Market share 2023-2028 (%)
- Exhibits33: Data Table on Technology - Market share 2023-2028 (%)
- Exhibits34: Chart on Comparison by Technology
- Exhibits35: Data Table on Comparison by Technology
- Exhibits36: Chart on Touch-based - Market size and forecast 2023-2028 ($ million)
- Exhibits37: Data Table on Touch-based - Market size and forecast 2023-2028 ($ million)
- Exhibits38: Chart on Touch-based - Year-over-year growth 2023-2028 (%)
- Exhibits39: Data Table on Touch-based - Year-over-year growth 2023-2028 (%)
- Exhibits40: Chart on Touchless - Market size and forecast 2023-2028 ($ million)
- Exhibits41: Data Table on Touchless - Market size and forecast 2023-2028 ($ million)
- Exhibits42: Chart on Touchless - Year-over-year growth 2023-2028 (%)
- Exhibits43: Data Table on Touchless - Year-over-year growth 2023-2028 (%)
- Exhibits44: Market opportunity by Technology ($ million)
- Exhibits45: Data Table on Market opportunity by Technology ($ million)
- Exhibits46: Chart on Application - Market share 2023-2028 (%)
- Exhibits47: Data Table on Application - Market share 2023-2028 (%)
- Exhibits48: Chart on Comparison by Application
- Exhibits49: Data Table on Comparison by Application
- Exhibits50: Chart on Gaming consoles - Market size and forecast 2023-2028 ($ million)
- Exhibits51: Data Table on Gaming consoles - Market size and forecast 2023-2028 ($ million)
- Exhibits52: Chart on Gaming consoles - Year-over-year growth 2023-2028 (%)
- Exhibits53: Data Table on Gaming consoles - Year-over-year growth 2023-2028 (%)
- Exhibits54: Chart on Smartphones - Market size and forecast 2023-2028 ($ million)
- Exhibits55: Data Table on Smartphones - Market size and forecast 2023-2028 ($ million)
- Exhibits56: Chart on Smartphones - Year-over-year growth 2023-2028 (%)
- Exhibits57: Data Table on Smartphones - Year-over-year growth 2023-2028 (%)
- Exhibits58: Chart on Automobiles - Market size and forecast 2023-2028 ($ million)
- Exhibits59: Data Table on Automobiles - Market size and forecast 2023-2028 ($ million)
- Exhibits60: Chart on Automobiles - Year-over-year growth 2023-2028 (%)
- Exhibits61: Data Table on Automobiles - Year-over-year growth 2023-2028 (%)
- Exhibits62: Chart on PCs - Market size and forecast 2023-2028 ($ million)
- Exhibits63: Data Table on PCs - Market size and forecast 2023-2028 ($ million)
- Exhibits64: Chart on PCs - Year-over-year growth 2023-2028 (%)
- Exhibits65: Data Table on PCs - Year-over-year growth 2023-2028 (%)
- Exhibits66: Market opportunity by Application ($ million)
- Exhibits67: Data Table on Market opportunity by Application ($ million)
- Exhibits68: Analysis of price sensitivity, lifecycle, customer purchase basket, adoption rates, and purchase criteria
- Exhibits69: Chart on Market share by geography 2023-2028 (%)
- Exhibits70: Data Table on Market share by geography 2023-2028 (%)
- Exhibits71: Chart on Geographic comparison
- Exhibits72: Data Table on Geographic comparison
- Exhibits73: Chart on APAC - Market size and forecast 2023-2028 ($ million)
- Exhibits74: Data Table on APAC - Market size and forecast 2023-2028 ($ million)
- Exhibits75: Chart on APAC - Year-over-year growth 2023-2028 (%)
- Exhibits76: Data Table on APAC - Year-over-year growth 2023-2028 (%)
- Exhibits77: Chart on North America - Market size and forecast 2023-2028 ($ million)
- Exhibits78: Data Table on North America - Market size and forecast 2023-2028 ($ million)
- Exhibits79: Chart on North America - Year-over-year growth 2023-2028 (%)
- Exhibits80: Data Table on North America - Year-over-year growth 2023-2028 (%)
- Exhibits81: Chart on Europe - Market size and forecast 2023-2028 ($ million)
- Exhibits82: Data Table on Europe - Market size and forecast 2023-2028 ($ million)
- Exhibits83: Chart on Europe - Year-over-year growth 2023-2028 (%)
- Exhibits84: Data Table on Europe - Year-over-year growth 2023-2028 (%)
- Exhibits85: Chart on Middle East and Africa - Market size and forecast 2023-2028 ($ million)
- Exhibits86: Data Table on Middle East and Africa - Market size and forecast 2023-2028 ($ million)
- Exhibits87: Chart on Middle East and Africa - Year-over-year growth 2023-2028 (%)
- Exhibits88: Data Table on Middle East and Africa - Year-over-year growth 2023-2028 (%)
- Exhibits89: Chart on South America - Market size and forecast 2023-2028 ($ million)
- Exhibits90: Data Table on South America - Market size and forecast 2023-2028 ($ million)
- Exhibits91: Chart on South America - Year-over-year growth 2023-2028 (%)
- Exhibits92: Data Table on South America - Year-over-year growth 2023-2028 (%)
- Exhibits93: Chart on US - Market size and forecast 2023-2028 ($ million)
- Exhibits94: Data Table on US - Market size and forecast 2023-2028 ($ million)
- Exhibits95: Chart on US - Year-over-year growth 2023-2028 (%)
- Exhibits96: Data Table on US - Year-over-year growth 2023-2028 (%)
- Exhibits97: Chart on China - Market size and forecast 2023-2028 ($ million)
- Exhibits98: Data Table on China - Market size and forecast 2023-2028 ($ million)
- Exhibits99: Chart on China - Year-over-year growth 2023-2028 (%)
- Exhibits100: Data Table on China - Year-over-year growth 2023-2028 (%)
- Exhibits101: Chart on Japan - Market size and forecast 2023-2028 ($ million)
- Exhibits102: Data Table on Japan - Market size and forecast 2023-2028 ($ million)
- Exhibits103: Chart on Japan - Year-over-year growth 2023-2028 (%)
- Exhibits104: Data Table on Japan - Year-over-year growth 2023-2028 (%)
- Exhibits105: Chart on Germany - Market size and forecast 2023-2028 ($ million)
- Exhibits106: Data Table on Germany - Market size and forecast 2023-2028 ($ million)
- Exhibits107: Chart on Germany - Year-over-year growth 2023-2028 (%)
- Exhibits108: Data Table on Germany - Year-over-year growth 2023-2028 (%)
- Exhibits109: Chart on South Korea - Market size and forecast 2023-2028 ($ million)
- Exhibits110: Data Table on South Korea - Market size and forecast 2023-2028 ($ million)
- Exhibits111: Chart on South Korea - Year-over-year growth 2023-2028 (%)
- Exhibits112: Data Table on South Korea - Year-over-year growth 2023-2028 (%)
- Exhibits113: Market opportunity by geography ($ million)
- Exhibits114: Data Tables on Market opportunity by geography ($ million)
- Exhibits115: Impact of drivers and challenges in 2023 and 2028
- Exhibits116: Overview on criticality of inputs and factors of differentiation
- Exhibits117: Overview on factors of disruption
- Exhibits118: Impact of key risks on business
- Exhibits119: Companies covered
- Exhibits120: Matrix on companies position and classification
- Exhibits121: Alphabet Inc. - Overview
- Exhibits122: Alphabet Inc. - Business segments
- Exhibits123: Alphabet Inc. - Key offerings
- Exhibits124: Alphabet Inc. - Segment focus
- Exhibits125: Apple Inc. - Overview
- Exhibits126: Apple Inc. - Business segments
- Exhibits127: Apple Inc. - Key news
- Exhibits128: Apple Inc. - Key offerings
- Exhibits129: Apple Inc. - Segment focus
- Exhibits130: Cipia Vision Ltd. - Overview
- Exhibits131: Cipia Vision Ltd. - Product / Service
- Exhibits132: Cipia Vision Ltd. - Key offerings
- Exhibits133: GestureTek technologies - Overview
- Exhibits134: GestureTek technologies - Product / Service
- Exhibits135: GestureTek technologies - Key offerings
- Exhibits136: Infineon Technologies AG - Overview
- Exhibits137: Infineon Technologies AG - Business segments
- Exhibits138: Infineon Technologies AG - Key news
- Exhibits139: Infineon Technologies AG - Key offerings
- Exhibits140: Infineon Technologies AG - Segment focus
- Exhibits141: Intel Corp. - Overview
- Exhibits142: Intel Corp. - Business segments
- Exhibits143: Intel Corp. - Key news
- Exhibits144: Intel Corp. - Key offerings
- Exhibits145: Intel Corp. - Segment focus
- Exhibits146: IrisGuard Ltd. - Overview
- Exhibits147: IrisGuard Ltd. - Product / Service
- Exhibits148: IrisGuard Ltd. - Key offerings
- Exhibits149: Jabil Inc. - Overview
- Exhibits150: Jabil Inc. - Business segments
- Exhibits151: Jabil Inc. - Key news
- Exhibits152: Jabil Inc. - Key offerings
- Exhibits153: Jabil Inc. - Segment focus
- Exhibits154: Microchip Technology Inc. - Overview
- Exhibits155: Microchip Technology Inc. - Business segments
- Exhibits156: Microchip Technology Inc. - Key news
- Exhibits157: Microchip Technology Inc. - Key offerings
- Exhibits158: Microchip Technology Inc. - Segment focus
- Exhibits159: NVIDIA Corp. - Overview
- Exhibits160: NVIDIA Corp. - Business segments
- Exhibits161: NVIDIA Corp. - Key news
- Exhibits162: NVIDIA Corp. - Key offerings
- Exhibits163: NVIDIA Corp. - Segment focus
- Exhibits164: OMRON Corp. - Overview
- Exhibits165: OMRON Corp. - Business segments
- Exhibits166: OMRON Corp. - Key news
- Exhibits167: OMRON Corp. - Key offerings
- Exhibits168: OMRON Corp. - Segment focus
- Exhibits169: Qualcomm Inc. - Overview
- Exhibits170: Qualcomm Inc. - Business segments
- Exhibits171: Qualcomm Inc. - Key news
- Exhibits172: Qualcomm Inc. - Key offerings
- Exhibits173: Qualcomm Inc. - Segment focus
- Exhibits174: STMicroelectronics International N.V. - Overview
- Exhibits175: STMicroelectronics International N.V. - Business segments
- Exhibits176: STMicroelectronics International N.V. - Key news
- Exhibits177: STMicroelectronics International N.V. - Key offerings
- Exhibits178: STMicroelectronics International N.V. - Segment focus
- Exhibits179: Synaptics Inc. - Overview
- Exhibits180: Synaptics Inc. - Product / Service
- Exhibits181: Synaptics Inc. - Key offerings
- Exhibits182: Ultraleap Ltd. - Overview
- Exhibits183: Ultraleap Ltd. - Product / Service
- Exhibits184: Ultraleap Ltd. - Key offerings
- Exhibits185: Inclusions checklist
- Exhibits186: Exclusions checklist
- Exhibits187: Currency conversion rates for US$
- Exhibits188: Research methodology
- Exhibits189: Information sources
- Exhibits190: Data validation
- Exhibits191: Validation techniques employed for market sizing
- Exhibits192: Data synthesis
- Exhibits193: 360 degree market analysis
- Exhibits194: List of abbreviations
The gesture recognition solution market is forecasted to grow by USD 73440.3 mn during 2023-2028, accelerating at a CAGR of 37.91% during the forecast period. The report on the gesture recognition solution market provides a holistic analysis, market size and forecast, trends, growth drivers, and challenges, as well as vendor analysis covering around 25 vendors.
The report offers an up-to-date analysis regarding the current market scenario, the latest trends and drivers, and the overall market environment. The market is driven by increasing development of processors supporting gesture recognition, rising implementation of hmi technologies in automotive industry, and development of various machine vision technologies in automotive gesture recognition systems.
Technavio's gesture recognition solution market is segmented as below:
| Market Scope | |
|---|---|
| Base Year | 2024 |
| End Year | 2028 |
| Series Year | 2024-2028 |
| Growth Momentum | Accelerate |
| YOY 2024 | 28.4% |
| CAGR | 37.91% |
| Incremental Value | $73440.3mn |
By Technology
- Touch-based
- Touchless
By Application
- Gaming consoles
- Smartphones
- Automobiles
- PCs
By Geography
- APAC
- North America
- Europe
- Middle East and Africa
- South America
This study identifies the increasing priority for tof cameras for gesture recognition as one of the prime reasons driving the gesture recognition solution market growth during the next few years. Also, market consolidation in gesture recognition solution ecosystem and advances in electric vehicles and autonomous cars will lead to sizable demand in the market.
The report on the gesture recognition solution market covers the following areas:
- Gesture recognition solution market sizing
- Gesture recognition solution market forecast
- Gesture recognition solution market industry analysis
The robust vendor analysis is designed to help clients improve their market position, and in line with this, this report provides a detailed analysis of several leading gesture recognition solution market vendors that include Alphabet Inc., Apple Inc., Cipia Vision Ltd., Elliptic Laboratories AS, ESPROS Photonics Corp., GestureTek technologies, Infineon Technologies AG, Intel Corp., IrisGuard Ltd., Jabil Inc., Microchip Technology Inc., NVIDIA Corp., OMRON Corp., Qualcomm Inc., Sony Group Corp., STMicroelectronics International N.V., Synaptics Inc., Texas Instruments Inc., Ultraleap Ltd., and Vishay Intertechnology Inc.. Also, the gesture recognition solution market analysis report includes information on upcoming trends and challenges that will influence market growth. This is to help companies strategize and leverage all forthcoming growth opportunities.
The study was conducted using an objective combination of primary and secondary information including inputs from key participants in the industry. The report contains a comprehensive market and vendor landscape in addition to an analysis of the key vendors.
The publisher presents a detailed picture of the market by the way of study, synthesis, and summation of data from multiple sources by an analysis of key parameters such as profit, pricing, competition, and promotions. It presents various market facets by identifying the key industry influencers. The data presented is comprehensive, reliable, and a result of extensive research - both primary and secondary. The market research reports provide a complete competitive landscape and an in-depth vendor selection methodology and analysis using qualitative and quantitative research to forecast the accurate market growth.
Table of Contents
1 Executive Summary
- 1.1 Market overview
- Executive Summary - Chart on Market Overview
- Executive Summary - Data Table on Market Overview
- Executive Summary - Chart on Global Market Characteristics
- Executive Summary - Chart on Market by Geography
- Executive Summary - Chart on Market Segmentation by Technology
- Executive Summary - Chart on Market Segmentation by Application
- Executive Summary - Chart on Incremental Growth
- Executive Summary - Data Table on Incremental Growth
- Executive Summary - Chart on Company Market Positioning
2 Market Landscape
- 2.1 Market ecosystem
- Parent Market
- Data Table on - Parent Market
- 2.2 Market characteristics
- Market characteristics analysis
- 2.3 Value chain analysis
- Value Chain Analysis
3 Market Sizing
- 3.1 Market definition
- Offerings of companies included in the market definition
- 3.2 Market segment analysis
- Market segments
- 3.3 Market size 2023
- 3.4 Market outlook: Forecast for 2023-2028
- Chart on Global - Market size and forecast 2023-2028 ($ million)
- Data Table on Global - Market size and forecast 2023-2028 ($ million)
- Chart on Global Market: Year-over-year growth 2023-2028 (%)
- Data Table on Global Market: Year-over-year growth 2023-2028 (%)
4 Historic Market Size
- 4.1 Global Gesture Recognition Solution Market 2018 - 2022
- Historic Market Size - Data Table on Global Gesture Recognition Solution Market 2018 - 2022 ($ million)
- 4.2 Technology segment analysis 2018 - 2022
- Historic Market Size - Technology Segment 2018 - 2022 ($ million)
- 4.3 Application segment analysis 2018 - 2022
- Historic Market Size - Application Segment 2018 - 2022 ($ million)
- 4.4 Geography segment analysis 2018 - 2022
- Historic Market Size - Geography Segment 2018 - 2022 ($ million)
- 4.5 Country segment analysis 2018 - 2022
- Historic Market Size - Country Segment 2018 - 2022 ($ million)
5 Five Forces Analysis
- 5.1 Five forces summary
- Five forces analysis - Comparison between 2023 and 2028
- 5.2 Bargaining power of buyers
- Bargaining power of buyers - Impact of key factors 2023 and 2028
- 5.3 Bargaining power of suppliers
- Bargaining power of suppliers - Impact of key factors in 2023 and 2028
- 5.4 Threat of new entrants
- Threat of new entrants - Impact of key factors in 2023 and 2028
- 5.5 Threat of substitutes
- Threat of substitutes - Impact of key factors in 2023 and 2028
- 5.6 Threat of rivalry
- Threat of rivalry - Impact of key factors in 2023 and 2028
- 5.7 Market condition
- Chart on Market condition - Five forces 2023 and 2028
6 Market Segmentation by Technology
- 6.1 Market segments
- Chart on Technology - Market share 2023-2028 (%)
- Data Table on Technology - Market share 2023-2028 (%)
- 6.2 Comparison by Technology
- Chart on Comparison by Technology
- Data Table on Comparison by Technology
- 6.3 Touch-based - Market size and forecast 2023-2028
- Chart on Touch-based - Market size and forecast 2023-2028 ($ million)
- Data Table on Touch-based - Market size and forecast 2023-2028 ($ million)
- Chart on Touch-based - Year-over-year growth 2023-2028 (%)
- Data Table on Touch-based - Year-over-year growth 2023-2028 (%)
- 6.4 Touchless - Market size and forecast 2023-2028
- Chart on Touchless - Market size and forecast 2023-2028 ($ million)
- Data Table on Touchless - Market size and forecast 2023-2028 ($ million)
- Chart on Touchless - Year-over-year growth 2023-2028 (%)
- Data Table on Touchless - Year-over-year growth 2023-2028 (%)
- 6.5 Market opportunity by Technology
- Market opportunity by Technology ($ million)
- Data Table on Market opportunity by Technology ($ million)
7 Market Segmentation by Application
- 7.1 Market segments
- Chart on Application - Market share 2023-2028 (%)
- Data Table on Application - Market share 2023-2028 (%)
- 7.2 Comparison by Application
- Chart on Comparison by Application
- Data Table on Comparison by Application
- 7.3 Gaming consoles - Market size and forecast 2023-2028
- Chart on Gaming consoles - Market size and forecast 2023-2028 ($ million)
- Data Table on Gaming consoles - Market size and forecast 2023-2028 ($ million)
- Chart on Gaming consoles - Year-over-year growth 2023-2028 (%)
- Data Table on Gaming consoles - Year-over-year growth 2023-2028 (%)
- 7.4 Smartphones - Market size and forecast 2023-2028
- Chart on Smartphones - Market size and forecast 2023-2028 ($ million)
- Data Table on Smartphones - Market size and forecast 2023-2028 ($ million)
- Chart on Smartphones - Year-over-year growth 2023-2028 (%)
- Data Table on Smartphones - Year-over-year growth 2023-2028 (%)
- 7.5 Automobiles - Market size and forecast 2023-2028
- Chart on Automobiles - Market size and forecast 2023-2028 ($ million)
- Data Table on Automobiles - Market size and forecast 2023-2028 ($ million)
- Chart on Automobiles - Year-over-year growth 2023-2028 (%)
- Data Table on Automobiles - Year-over-year growth 2023-2028 (%)
- 7.6 PCs - Market size and forecast 2023-2028
- Chart on PCs - Market size and forecast 2023-2028 ($ million)
- Data Table on PCs - Market size and forecast 2023-2028 ($ million)
- Chart on PCs - Year-over-year growth 2023-2028 (%)
- Data Table on PCs - Year-over-year growth 2023-2028 (%)
- 7.7 Market opportunity by Application
- Market opportunity by Application ($ million)
- Data Table on Market opportunity by Application ($ million)
8 Customer Landscape
- 8.1 Customer landscape overview
- Analysis of price sensitivity, lifecycle, customer purchase basket, adoption rates, and purchase criteria
9 Geographic Landscape
- 9.1 Geographic segmentation
- Chart on Market share by geography 2023-2028 (%)
- Data Table on Market share by geography 2023-2028 (%)
- 9.2 Geographic comparison
- Chart on Geographic comparison
- Data Table on Geographic comparison
- 9.3 APAC - Market size and forecast 2023-2028
- Chart on APAC - Market size and forecast 2023-2028 ($ million)
- Data Table on APAC - Market size and forecast 2023-2028 ($ million)
- Chart on APAC - Year-over-year growth 2023-2028 (%)
- Data Table on APAC - Year-over-year growth 2023-2028 (%)
- 9.4 North America - Market size and forecast 2023-2028
- Chart on North America - Market size and forecast 2023-2028 ($ million)
- Data Table on North America - Market size and forecast 2023-2028 ($ million)
- Chart on North America - Year-over-year growth 2023-2028 (%)
- Data Table on North America - Year-over-year growth 2023-2028 (%)
- 9.5 Europe - Market size and forecast 2023-2028
- Chart on Europe - Market size and forecast 2023-2028 ($ million)
- Data Table on Europe - Market size and forecast 2023-2028 ($ million)
- Chart on Europe - Year-over-year growth 2023-2028 (%)
- Data Table on Europe - Year-over-year growth 2023-2028 (%)
- 9.6 Middle East and Africa - Market size and forecast 2023-2028
- Chart on Middle East and Africa - Market size and forecast 2023-2028 ($ million)
- Data Table on Middle East and Africa - Market size and forecast 2023-2028 ($ million)
- Chart on Middle East and Africa - Year-over-year growth 2023-2028 (%)
- Data Table on Middle East and Africa - Year-over-year growth 2023-2028 (%)
- 9.7 South America - Market size and forecast 2023-2028
- Chart on South America - Market size and forecast 2023-2028 ($ million)
- Data Table on South America - Market size and forecast 2023-2028 ($ million)
- Chart on South America - Year-over-year growth 2023-2028 (%)
- Data Table on South America - Year-over-year growth 2023-2028 (%)
- 9.8 US - Market size and forecast 2023-2028
- Chart on US - Market size and forecast 2023-2028 ($ million)
- Data Table on US - Market size and forecast 2023-2028 ($ million)
- Chart on US - Year-over-year growth 2023-2028 (%)
- Data Table on US - Year-over-year growth 2023-2028 (%)
- 9.9 China - Market size and forecast 2023-2028
- Chart on China - Market size and forecast 2023-2028 ($ million)
- Data Table on China - Market size and forecast 2023-2028 ($ million)
- Chart on China - Year-over-year growth 2023-2028 (%)
- Data Table on China - Year-over-year growth 2023-2028 (%)
- 9.10 Japan - Market size and forecast 2023-2028
- Chart on Japan - Market size and forecast 2023-2028 ($ million)
- Data Table on Japan - Market size and forecast 2023-2028 ($ million)
- Chart on Japan - Year-over-year growth 2023-2028 (%)
- Data Table on Japan - Year-over-year growth 2023-2028 (%)
- 9.11 Germany - Market size and forecast 2023-2028
- Chart on Germany - Market size and forecast 2023-2028 ($ million)
- Data Table on Germany - Market size and forecast 2023-2028 ($ million)
- Chart on Germany - Year-over-year growth 2023-2028 (%)
- Data Table on Germany - Year-over-year growth 2023-2028 (%)
- 9.12 South Korea - Market size and forecast 2023-2028
- Chart on South Korea - Market size and forecast 2023-2028 ($ million)
- Data Table on South Korea - Market size and forecast 2023-2028 ($ million)
- Chart on South Korea - Year-over-year growth 2023-2028 (%)
- Data Table on South Korea - Year-over-year growth 2023-2028 (%)
- 9.13 Market opportunity by geography
- Market opportunity by geography ($ million)
- Data Tables on Market opportunity by geography ($ million)
10 Drivers, Challenges, and Opportunity/Restraints
- 10.1 Market drivers
- 10.2 Market challenges
- 10.3 Impact of drivers and challenges
- Impact of drivers and challenges in 2023 and 2028
- 10.4 Market opportunities/restraints
11 Competitive Landscape
- 11.1 Overview
- 11.2 Competitive Landscape
- Overview on criticality of inputs and factors of differentiation
- 11.3 Landscape disruption
- Overview on factors of disruption
- 11.4 Industry risks
- Impact of key risks on business
12 Competitive Analysis
- 12.1 Companies profiled
- Companies covered
- 12.2 Market positioning of companies
- Matrix on companies position and classification
- 12.3 Alphabet Inc.
- Alphabet Inc. - Overview
- Alphabet Inc. - Business segments
- Alphabet Inc. - Key offerings
- Alphabet Inc. - Segment focus
- 12.4 Apple Inc.
- Apple Inc. - Overview
- Apple Inc. - Business segments
- Apple Inc. - Key news
- Apple Inc. - Key offerings
- Apple Inc. - Segment focus
- 12.5 Cipia Vision Ltd.
- Cipia Vision Ltd. - Overview
- Cipia Vision Ltd. - Product / Service
- Cipia Vision Ltd. - Key offerings
- 12.6 GestureTek technologies
- GestureTek technologies - Overview
- GestureTek technologies - Product / Service
- GestureTek technologies - Key offerings
- 12.7 Infineon Technologies AG
- Infineon Technologies AG - Overview
- Infineon Technologies AG - Business segments
- Infineon Technologies AG - Key news
- Infineon Technologies AG - Key offerings
- Infineon Technologies AG - Segment focus
- 12.8 Intel Corp.
- Intel Corp. - Overview
- Intel Corp. - Business segments
- Intel Corp. - Key news
- Intel Corp. - Key offerings
- Intel Corp. - Segment focus
- 12.9 IrisGuard Ltd.
- IrisGuard Ltd. - Overview
- IrisGuard Ltd. - Product / Service
- IrisGuard Ltd. - Key offerings
- 12.10 Jabil Inc.
- Jabil Inc. - Overview
- Jabil Inc. - Business segments
- Jabil Inc. - Key news
- Jabil Inc. - Key offerings
- Jabil Inc. - Segment focus
- 12.11 Microchip Technology Inc.
- Microchip Technology Inc. - Overview
- Microchip Technology Inc. - Business segments
- Microchip Technology Inc. - Key news
- Microchip Technology Inc. - Key offerings
- Microchip Technology Inc. - Segment focus
- 12.12 NVIDIA Corp.
- NVIDIA Corp. - Overview
- NVIDIA Corp. - Business segments
- NVIDIA Corp. - Key news
- NVIDIA Corp. - Key offerings
- NVIDIA Corp. - Segment focus
- 12.13 OMRON Corp.
- OMRON Corp. - Overview
- OMRON Corp. - Business segments
- OMRON Corp. - Key news
- OMRON Corp. - Key offerings
- OMRON Corp. - Segment focus
- 12.14 Qualcomm Inc.
- Qualcomm Inc. - Overview
- Qualcomm Inc. - Business segments
- Qualcomm Inc. - Key news
- Qualcomm Inc. - Key offerings
- Qualcomm Inc. - Segment focus
- 12.15 STMicroelectronics International N.V.
- STMicroelectronics International N.V. - Overview
- STMicroelectronics International N.V. - Business segments
- STMicroelectronics International N.V. - Key news
- STMicroelectronics International N.V. - Key offerings
- STMicroelectronics International N.V. - Segment focus
- 12.16 Synaptics Inc.
- Synaptics Inc. - Overview
- Synaptics Inc. - Product / Service
- Synaptics Inc. - Key offerings
- 12.17 Ultraleap Ltd.
- Ultraleap Ltd. - Overview
- Ultraleap Ltd. - Product / Service
- Ultraleap Ltd. - Key offerings
13 Appendix
- 13.1 Scope of the report
- 13.2 Inclusions and exclusions checklist
- Inclusions checklist
- Exclusions checklist
- 13.3 Currency conversion rates for US$
- Currency conversion rates for US$
- 13.4 Research methodology
- Research methodology
- 13.5 Data procurement
- Information sources
- 13.6 Data validation
- Data validation
- 13.7 Validation techniques employed for market sizing
- Validation techniques employed for market sizing
- 13.8 Data synthesis
- Data synthesis
- 13.9 360 degree market analysis
- 360 degree market analysis
- 13.10 List of abbreviations
- List of abbreviations

