|
|
市場調査レポート
商品コード
1732607
腎結石治療薬の世界市場 2025~2029年Global Kidney Stones Therapeutic Market 2025-2029 |
||||||

|
|||||||
カスタマイズ可能
|
|||||||


| 腎結石治療薬の世界市場 2025~2029年 |
|
出版日: 2025年05月15日
発行: TechNavio
ページ情報: 英文 223 Pages
納期: 即納可能
|

全表示
- 概要
- 図表
- 目次
腎結石治療薬市場は2024-2029年に5億8,290万米ドル、予測期間中のCAGRは5.1%で成長すると予測されます。
当レポートでは、腎結石治療薬市場の全体的な分析、市場規模・予測、動向、成長促進要因、課題、約25のベンダーを網羅したベンダー分析などを掲載しています。
現在の市場シナリオ、最新動向と促進要因、市場環境全体に関する最新分析を提供しています。同市場は、軟性デジタル尿管鏡の普及拡大、世界人口の尿路結石症罹患率の上昇、腎結石症の有病率の増加などが牽引しています。
| 市場範囲 | |
|---|---|
| 基準年 | 2025 |
| 終了年 | 2029 |
| 予測期間 | 2025-2029 |
| 成長モメンタム | 加速 |
| 前年比 | 4.8% |
| CAGR | 5.1% |
| 増分額 | 5億8,290万米ドル |
本調査は、業界の主要参加者からのインプットを含め、一次情報と二次情報を客観的に組み合わせて実施しました。レポートには、主要企業の分析に加え、包括的な市場規模データ、地域別分析によるセグメント、ベンダー情勢が含まれています。レポートには過去データと予測データがあります。
本調査では、今後数年間の腎結石治療薬市場の成長を促進する主な理由の一つとして、腎臓結石治療における技術の進歩を挙げています。また、高齢者人口の増加や、社会的認知度向上、医師教育、臨床トレーニングへの取り組みが、市場の大きな需要につながるとしています。
目次
第1章 エグゼクティブサマリー
- 市場概要
第2章 Technavio分析
- 価格・ライフサイクル・顧客購入バスケット・採用率・購入基準の分析
- インプットの重要性と差別化の要因
- 混乱の要因
- 促進要因と課題の影響
第3章 市場情勢
- 市場エコシステム
- 市場の特徴
- バリューチェーン分析
第4章 市場規模
- 市場の定義
- 市場セグメント分析
- 市場規模 2024
- 市場の見通し 2024-2029
第5章 市場規模実績
- 腎結石治療薬の世界市場 2019-2023
- エンドユーザー別セグメント分析 2019-2023
- タイプ別セグメント分析 2019-2023
- 治療領域別セグメント分析 2019-2023
- 地域別セグメント分析 2019-2023
- 国別セグメント分析 2019-2023
第6章 定性分析
- AIの影響:腎結石治療薬の世界市場
第7章 ファイブフォース分析
- ファイブフォースの要約
- 買い手の交渉力
- 供給企業の交渉力
- 新規参入業者の脅威
- 代替品の脅威
- 競争の脅威
- 市況
第8章 市場セグメンテーション:エンドユーザー別
- 市場セグメント
- 比較:エンドユーザー別
- 病院:市場規模と予測 2024-2029
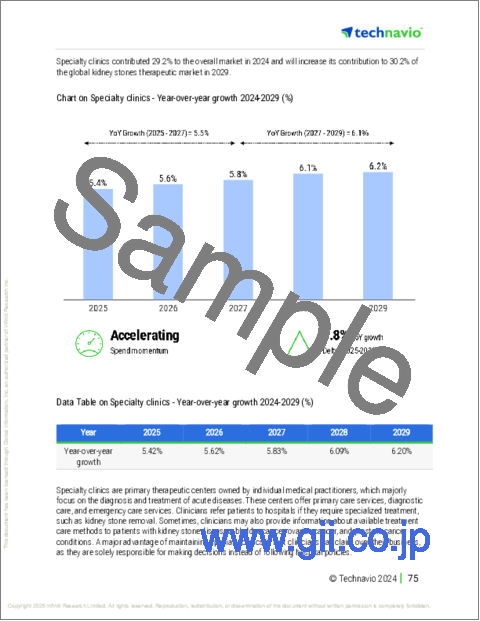
- 専門クリニック:市場規模と予測 2024-2029
- 外来手術センター:市場規模と予測 2024-2029
- 市場機会:エンドユーザー別
第9章 市場セグメンテーション:タイプ別
- 市場セグメント
- 比較:タイプ別
- 尿管鏡検査:市場規模と予測 2024-2029
- 砕石術:市場規模と予測 2024-2029
- 経皮的腎結石造影術(PCNL):市場規模と予測 2024-2029
- 市場機会:タイプ別
第10章 市場セグメンテーション:治療領域別
- 市場セグメント
- 比較:治療領域別
- シュウ酸カルシウム結石:市場規模と予測 2024-2029
- 尿酸:市場規模と予測 2024-2029
- ストルバイト腎結石:市場規模と予測 2024-2029
- シスチン結石:市場規模と予測 2024-2029
- リン酸カルシウム結石:市場規模と予測 2024-2029
- 市場機会:治療領域別
第11章 顧客情勢
- 顧客情勢の概要
第12章 地域別情勢
- 地域別セグメンテーション
- 地域別比較
- 北米:市場規模と予測 2024-2029
- 欧州:市場規模と予測 2024-2029
- アジア:市場規模と予測 2024-2029
- 世界のその他の地域:市場規模と予測 2024-2029
- 米国:市場規模と予測 2024-2029
- ドイツ:市場規模と予測 2024-2029
- 中国:市場規模と予測 2024-2029
- カナダ:市場規模と予測 2024-2029
- 英国:市場規模と予測 2024-2029
- フランス:市場規模と予測 2024-2029
- 日本:市場規模と予測 2024-2029
- インド:市場規模と予測 2024-2029
- イタリア:市場規模と予測 2024-2029
- スペイン:市場規模と予測 2024-2029
- 市場機会:地域情勢別
第13章 促進要因・課題・機会・抑制要因
- 市場促進要因
- 市場の課題
- 促進要因と課題の影響
- 市場の機会・抑制要因
第14章 競合情勢
- 概要
- 競合情勢
- 混乱の状況
- 業界のリスク
第15章 競合分析
- 企業プロファイル
- 企業ランキング指数
- 企業の市場ポジショニング
- Anvik Biotech
- Aristo Pharma GmbH
- Bausch Health Companies Inc.
- Bayer AG
- Cipla Inc.
- Dr Reddys Laboratories Ltd.
- Emcure Pharmaceuticals Ltd.
- GlaxoSmithKline Plc
- Intas Pharmaceuticals Ltd.
- Macleods Pharmaceuticals Ltd.
- Medinova Diagnostic Services Ltd.
- Pfizer Inc.
- Walter Bushnell
- Windlas Biotech Pvt. Ltd.
- Worth Medicines Pvt. Ltd.
第16章 付録
Exhibits:
- Exhibits1: Executive Summary - Chart on Market Overview
- Exhibits2: Executive Summary - Data Table on Market Overview
- Exhibits3: Executive Summary - Chart on Global Market Characteristics
- Exhibits4: Executive Summary - Chart on Market By Geographical Landscape
- Exhibits5: Executive Summary - Chart on Market Segmentation by End-user
- Exhibits6: Executive Summary - Chart on Market Segmentation by Type
- Exhibits7: Executive Summary - Chart on Market Segmentation by Therapy Area
- Exhibits8: Executive Summary - Chart on Incremental Growth
- Exhibits9: Executive Summary - Data Table on Incremental Growth
- Exhibits10: Executive Summary - Chart on Company Market Positioning
- Exhibits11: Analysis of price sensitivity, lifecycle, customer purchase basket, adoption rates, and purchase criteria
- Exhibits12: Overview on criticality of inputs and factors of differentiation
- Exhibits13: Overview on factors of disruption
- Exhibits14: Impact of drivers and challenges in 2024 and 2029
- Exhibits15: Parent Market
- Exhibits16: Data Table on - Parent Market
- Exhibits17: Market characteristics analysis
- Exhibits18: Value chain analysis
- Exhibits19: Offerings of companies included in the market definition
- Exhibits20: Market segments
- Exhibits21: Chart on Global - Market size and forecast 2024-2029 ($ million)
- Exhibits22: Data Table on Global - Market size and forecast 2024-2029 ($ million)
- Exhibits23: Chart on Global Market: Year-over-year growth 2024-2029 (%)
- Exhibits24: Data Table on Global Market: Year-over-year growth 2024-2029 (%)
- Exhibits25: Historic Market Size - Data Table on Global Kidney Stones Therapeutic Market 2019 - 2023 ($ million)
- Exhibits26: Historic Market Size - End-user Segment 2019 - 2023 ($ million)
- Exhibits27: Historic Market Size - Type Segment 2019 - 2023 ($ million)
- Exhibits28: Historic Market Size - Therapy Area Segment 2019 - 2023 ($ million)
- Exhibits29: Historic Market Size - Geography Segment 2019 - 2023 ($ million)
- Exhibits30: Historic Market Size - Country Segment 2019 - 2023 ($ million)
- Exhibits31: Five forces analysis - Comparison between 2024 and 2029
- Exhibits32: Bargaining power of buyers - Impact of key factors 2024 and 2029
- Exhibits33: Bargaining power of suppliers - Impact of key factors in 2024 and 2029
- Exhibits34: Threat of new entrants - Impact of key factors in 2024 and 2029
- Exhibits35: Threat of substitutes - Impact of key factors in 2024 and 2029
- Exhibits36: Threat of rivalry - Impact of key factors in 2024 and 2029
- Exhibits37: Chart on Market condition - Five forces 2024 and 2029
- Exhibits38: Chart on End-user - Market share 2024-2029 (%)
- Exhibits39: Data Table on End-user - Market share 2024-2029 (%)
- Exhibits40: Chart on Comparison by End-user
- Exhibits41: Data Table on Comparison by End-user
- Exhibits42: Chart on Hospitals - Market size and forecast 2024-2029 ($ million)
- Exhibits43: Data Table on Hospitals - Market size and forecast 2024-2029 ($ million)
- Exhibits44: Chart on Hospitals - Year-over-year growth 2024-2029 (%)
- Exhibits45: Data Table on Hospitals - Year-over-year growth 2024-2029 (%)
- Exhibits46: Chart on Specialty clinics - Market size and forecast 2024-2029 ($ million)
- Exhibits47: Data Table on Specialty clinics - Market size and forecast 2024-2029 ($ million)
- Exhibits48: Chart on Specialty clinics - Year-over-year growth 2024-2029 (%)
- Exhibits49: Data Table on Specialty clinics - Year-over-year growth 2024-2029 (%)
- Exhibits50: Chart on Ambulatory surgical centers - Market size and forecast 2024-2029 ($ million)
- Exhibits51: Data Table on Ambulatory surgical centers - Market size and forecast 2024-2029 ($ million)
- Exhibits52: Chart on Ambulatory surgical centers - Year-over-year growth 2024-2029 (%)
- Exhibits53: Data Table on Ambulatory surgical centers - Year-over-year growth 2024-2029 (%)
- Exhibits54: Market opportunity by End-user ($ million)
- Exhibits55: Data Table on Market opportunity by End-user ($ million)
- Exhibits56: Chart on Type - Market share 2024-2029 (%)
- Exhibits57: Data Table on Type - Market share 2024-2029 (%)
- Exhibits58: Chart on Comparison by Type
- Exhibits59: Data Table on Comparison by Type
- Exhibits60: Chart on Ureteroscopy - Market size and forecast 2024-2029 ($ million)
- Exhibits61: Data Table on Ureteroscopy - Market size and forecast 2024-2029 ($ million)
- Exhibits62: Chart on Ureteroscopy - Year-over-year growth 2024-2029 (%)
- Exhibits63: Data Table on Ureteroscopy - Year-over-year growth 2024-2029 (%)
- Exhibits64: Chart on Lithotripsy - Market size and forecast 2024-2029 ($ million)
- Exhibits65: Data Table on Lithotripsy - Market size and forecast 2024-2029 ($ million)
- Exhibits66: Chart on Lithotripsy - Year-over-year growth 2024-2029 (%)
- Exhibits67: Data Table on Lithotripsy - Year-over-year growth 2024-2029 (%)
- Exhibits68: Chart on Percutaneous nephrolithonomy (PCNL) - Market size and forecast 2024-2029 ($ million)
- Exhibits69: Data Table on Percutaneous nephrolithonomy (PCNL) - Market size and forecast 2024-2029 ($ million)
- Exhibits70: Chart on Percutaneous nephrolithonomy (PCNL) - Year-over-year growth 2024-2029 (%)
- Exhibits71: Data Table on Percutaneous nephrolithonomy (PCNL) - Year-over-year growth 2024-2029 (%)
- Exhibits72: Market opportunity by Type ($ million)
- Exhibits73: Data Table on Market opportunity by Type ($ million)
- Exhibits74: Chart on Therapy Area - Market share 2024-2029 (%)
- Exhibits75: Data Table on Therapy Area - Market share 2024-2029 (%)
- Exhibits76: Chart on Comparison by Therapy Area
- Exhibits77: Data Table on Comparison by Therapy Area
- Exhibits78: Chart on Calcium oxalate stones - Market size and forecast 2024-2029 ($ million)
- Exhibits79: Data Table on Calcium oxalate stones - Market size and forecast 2024-2029 ($ million)
- Exhibits80: Chart on Calcium oxalate stones - Year-over-year growth 2024-2029 (%)
- Exhibits81: Data Table on Calcium oxalate stones - Year-over-year growth 2024-2029 (%)
- Exhibits82: Chart on Uric acid - Market size and forecast 2024-2029 ($ million)
- Exhibits83: Data Table on Uric acid - Market size and forecast 2024-2029 ($ million)
- Exhibits84: Chart on Uric acid - Year-over-year growth 2024-2029 (%)
- Exhibits85: Data Table on Uric acid - Year-over-year growth 2024-2029 (%)
- Exhibits86: Chart on Struvite kidney stones - Market size and forecast 2024-2029 ($ million)
- Exhibits87: Data Table on Struvite kidney stones - Market size and forecast 2024-2029 ($ million)
- Exhibits88: Chart on Struvite kidney stones - Year-over-year growth 2024-2029 (%)
- Exhibits89: Data Table on Struvite kidney stones - Year-over-year growth 2024-2029 (%)
- Exhibits90: Chart on Cystine stones - Market size and forecast 2024-2029 ($ million)
- Exhibits91: Data Table on Cystine stones - Market size and forecast 2024-2029 ($ million)
- Exhibits92: Chart on Cystine stones - Year-over-year growth 2024-2029 (%)
- Exhibits93: Data Table on Cystine stones - Year-over-year growth 2024-2029 (%)
- Exhibits94: Chart on Calcium phosphate stones - Market size and forecast 2024-2029 ($ million)
- Exhibits95: Data Table on Calcium phosphate stones - Market size and forecast 2024-2029 ($ million)
- Exhibits96: Chart on Calcium phosphate stones - Year-over-year growth 2024-2029 (%)
- Exhibits97: Data Table on Calcium phosphate stones - Year-over-year growth 2024-2029 (%)
- Exhibits98: Market opportunity by Therapy Area ($ million)
- Exhibits99: Data Table on Market opportunity by Therapy Area ($ million)
- Exhibits100: Analysis of price sensitivity, lifecycle, customer purchase basket, adoption rates, and purchase criteria
- Exhibits101: Chart on Market share By Geographical Landscape 2024-2029 (%)
- Exhibits102: Data Table on Market share By Geographical Landscape 2024-2029 (%)
- Exhibits103: Chart on Geographic comparison
- Exhibits104: Data Table on Geographic comparison
- Exhibits105: Chart on North America - Market size and forecast 2024-2029 ($ million)
- Exhibits106: Data Table on North America - Market size and forecast 2024-2029 ($ million)
- Exhibits107: Chart on North America - Year-over-year growth 2024-2029 (%)
- Exhibits108: Data Table on North America - Year-over-year growth 2024-2029 (%)
- Exhibits109: Chart on Europe - Market size and forecast 2024-2029 ($ million)
- Exhibits110: Data Table on Europe - Market size and forecast 2024-2029 ($ million)
- Exhibits111: Chart on Europe - Year-over-year growth 2024-2029 (%)
- Exhibits112: Data Table on Europe - Year-over-year growth 2024-2029 (%)
- Exhibits113: Chart on Asia - Market size and forecast 2024-2029 ($ million)
- Exhibits114: Data Table on Asia - Market size and forecast 2024-2029 ($ million)
- Exhibits115: Chart on Asia - Year-over-year growth 2024-2029 (%)
- Exhibits116: Data Table on Asia - Year-over-year growth 2024-2029 (%)
- Exhibits117: Chart on Rest of World (ROW) - Market size and forecast 2024-2029 ($ million)
- Exhibits118: Data Table on Rest of World (ROW) - Market size and forecast 2024-2029 ($ million)
- Exhibits119: Chart on Rest of World (ROW) - Year-over-year growth 2024-2029 (%)
- Exhibits120: Data Table on Rest of World (ROW) - Year-over-year growth 2024-2029 (%)
- Exhibits121: Chart on US - Market size and forecast 2024-2029 ($ million)
- Exhibits122: Data Table on US - Market size and forecast 2024-2029 ($ million)
- Exhibits123: Chart on US - Year-over-year growth 2024-2029 (%)
- Exhibits124: Data Table on US - Year-over-year growth 2024-2029 (%)
- Exhibits125: Chart on Germany - Market size and forecast 2024-2029 ($ million)
- Exhibits126: Data Table on Germany - Market size and forecast 2024-2029 ($ million)
- Exhibits127: Chart on Germany - Year-over-year growth 2024-2029 (%)
- Exhibits128: Data Table on Germany - Year-over-year growth 2024-2029 (%)
- Exhibits129: Chart on China - Market size and forecast 2024-2029 ($ million)
- Exhibits130: Data Table on China - Market size and forecast 2024-2029 ($ million)
- Exhibits131: Chart on China - Year-over-year growth 2024-2029 (%)
- Exhibits132: Data Table on China - Year-over-year growth 2024-2029 (%)
- Exhibits133: Chart on Canada - Market size and forecast 2024-2029 ($ million)
- Exhibits134: Data Table on Canada - Market size and forecast 2024-2029 ($ million)
- Exhibits135: Chart on Canada - Year-over-year growth 2024-2029 (%)
- Exhibits136: Data Table on Canada - Year-over-year growth 2024-2029 (%)
- Exhibits137: Chart on UK - Market size and forecast 2024-2029 ($ million)
- Exhibits138: Data Table on UK - Market size and forecast 2024-2029 ($ million)
- Exhibits139: Chart on UK - Year-over-year growth 2024-2029 (%)
- Exhibits140: Data Table on UK - Year-over-year growth 2024-2029 (%)
- Exhibits141: Chart on France - Market size and forecast 2024-2029 ($ million)
- Exhibits142: Data Table on France - Market size and forecast 2024-2029 ($ million)
- Exhibits143: Chart on France - Year-over-year growth 2024-2029 (%)
- Exhibits144: Data Table on France - Year-over-year growth 2024-2029 (%)
- Exhibits145: Chart on Japan - Market size and forecast 2024-2029 ($ million)
- Exhibits146: Data Table on Japan - Market size and forecast 2024-2029 ($ million)
- Exhibits147: Chart on Japan - Year-over-year growth 2024-2029 (%)
- Exhibits148: Data Table on Japan - Year-over-year growth 2024-2029 (%)
- Exhibits149: Chart on India - Market size and forecast 2024-2029 ($ million)
- Exhibits150: Data Table on India - Market size and forecast 2024-2029 ($ million)
- Exhibits151: Chart on India - Year-over-year growth 2024-2029 (%)
- Exhibits152: Data Table on India - Year-over-year growth 2024-2029 (%)
- Exhibits153: Chart on Italy - Market size and forecast 2024-2029 ($ million)
- Exhibits154: Data Table on Italy - Market size and forecast 2024-2029 ($ million)
- Exhibits155: Chart on Italy - Year-over-year growth 2024-2029 (%)
- Exhibits156: Data Table on Italy - Year-over-year growth 2024-2029 (%)
- Exhibits157: Chart on Spain - Market size and forecast 2024-2029 ($ million)
- Exhibits158: Data Table on Spain - Market size and forecast 2024-2029 ($ million)
- Exhibits159: Chart on Spain - Year-over-year growth 2024-2029 (%)
- Exhibits160: Data Table on Spain - Year-over-year growth 2024-2029 (%)
- Exhibits161: Market opportunity By Geographical Landscape ($ million)
- Exhibits162: Data Tables on Market opportunity By Geographical Landscape ($ million)
- Exhibits163: Impact of drivers and challenges in 2024 and 2029
- Exhibits164: Overview on criticality of inputs and factors of differentiation
- Exhibits165: Overview on factors of disruption
- Exhibits166: Impact of key risks on business
- Exhibits167: Companies covered
- Exhibits168: Company ranking index
- Exhibits169: Matrix on companies position and classification
- Exhibits170: Anvik Biotech - Overview
- Exhibits171: Anvik Biotech - Product / Service
- Exhibits172: Anvik Biotech - Key offerings
- Exhibits173: SWOT
- Exhibits174: Aristo Pharma GmbH - Overview
- Exhibits175: Aristo Pharma GmbH - Product / Service
- Exhibits176: Aristo Pharma GmbH - Key offerings
- Exhibits177: SWOT
- Exhibits178: Bausch Health Companies Inc. - Overview
- Exhibits179: Bausch Health Companies Inc. - Business segments
- Exhibits180: Bausch Health Companies Inc. - Key news
- Exhibits181: Bausch Health Companies Inc. - Key offerings
- Exhibits182: Bausch Health Companies Inc. - Segment focus
- Exhibits183: SWOT
- Exhibits184: Bayer AG - Overview
- Exhibits185: Bayer AG - Business segments
- Exhibits186: Bayer AG - Key news
- Exhibits187: Bayer AG - Key offerings
- Exhibits188: Bayer AG - Segment focus
- Exhibits189: SWOT
- Exhibits190: Cipla Inc. - Overview
- Exhibits191: Cipla Inc. - Business segments
- Exhibits192: Cipla Inc. - Key news
- Exhibits193: Cipla Inc. - Key offerings
- Exhibits194: Cipla Inc. - Segment focus
- Exhibits195: SWOT
- Exhibits196: Dr Reddys Laboratories Ltd. - Overview
- Exhibits197: Dr Reddys Laboratories Ltd. - Business segments
- Exhibits198: Dr Reddys Laboratories Ltd. - Key news
- Exhibits199: Dr Reddys Laboratories Ltd. - Key offerings
- Exhibits200: Dr Reddys Laboratories Ltd. - Segment focus
- Exhibits201: SWOT
- Exhibits202: Emcure Pharmaceuticals Ltd. - Overview
- Exhibits203: Emcure Pharmaceuticals Ltd. - Product / Service
- Exhibits204: Emcure Pharmaceuticals Ltd. - Key offerings
- Exhibits205: SWOT
- Exhibits206: GlaxoSmithKline Plc - Overview
- Exhibits207: GlaxoSmithKline Plc - Business segments
- Exhibits208: GlaxoSmithKline Plc - Key news
- Exhibits209: GlaxoSmithKline Plc - Key offerings
- Exhibits210: GlaxoSmithKline Plc - Segment focus
- Exhibits211: SWOT
- Exhibits212: Intas Pharmaceuticals Ltd. - Overview
- Exhibits213: Intas Pharmaceuticals Ltd. - Product / Service
- Exhibits214: Intas Pharmaceuticals Ltd. - Key offerings
- Exhibits215: SWOT
- Exhibits216: Macleods Pharmaceuticals Ltd. - Overview
- Exhibits217: Macleods Pharmaceuticals Ltd. - Product / Service
- Exhibits218: Macleods Pharmaceuticals Ltd. - Key offerings
- Exhibits219: SWOT
- Exhibits220: Medinova Diagnostic Services Ltd. - Overview
- Exhibits221: Medinova Diagnostic Services Ltd. - Product / Service
- Exhibits222: Medinova Diagnostic Services Ltd. - Key offerings
- Exhibits223: SWOT
- Exhibits224: Pfizer Inc. - Overview
- Exhibits225: Pfizer Inc. - Product / Service
- Exhibits226: Pfizer Inc. - Key news
- Exhibits227: Pfizer Inc. - Key offerings
- Exhibits228: SWOT
- Exhibits229: Walter Bushnell - Overview
- Exhibits230: Walter Bushnell - Product / Service
- Exhibits231: Walter Bushnell - Key offerings
- Exhibits232: SWOT
- Exhibits233: Windlas Biotech Pvt. Ltd. - Overview
- Exhibits234: Windlas Biotech Pvt. Ltd. - Product / Service
- Exhibits235: Windlas Biotech Pvt. Ltd. - Key offerings
- Exhibits236: SWOT
- Exhibits237: Worth Medicines Pvt. Ltd. - Overview
- Exhibits238: Worth Medicines Pvt. Ltd. - Product / Service
- Exhibits239: Worth Medicines Pvt. Ltd. - Key offerings
- Exhibits240: SWOT
- Exhibits241: Inclusions checklist
- Exhibits242: Exclusions checklist
- Exhibits243: Currency conversion rates for US$
- Exhibits244: Research methodology
- Exhibits245: Information sources
- Exhibits246: Data validation
- Exhibits247: Validation techniques employed for market sizing
- Exhibits248: Data synthesis
- Exhibits249: 360 degree market analysis
- Exhibits250: List of abbreviations
The kidney stones therapeutic market is forecasted to grow by USD 582.9 mn during 2024-2029, accelerating at a CAGR of 5.1% during the forecast period. The report on the kidney stones therapeutic market provides a holistic analysis, market size and forecast, trends, growth drivers, and challenges, as well as vendor analysis covering around 25 vendors.
The report offers an up-to-date analysis regarding the current market scenario, the latest trends and drivers, and the overall market environment. The market is driven by growing popularity of flexible digital ureteroscopes, rising incidence of urolithiasis among global population, and increasing prevalence of kidney stone disease.
| Market Scope | |
|---|---|
| Base Year | 2025 |
| End Year | 2029 |
| Series Year | 2025-2029 |
| Growth Momentum | Accelerate |
| YOY 2025 | 4.8% |
| CAGR | 5.1% |
| Incremental Value | $582.9 mn |
The study was conducted using an objective combination of primary and secondary information including inputs from key participants in the industry. The report contains a comprehensive market size data, segment with regional analysis and vendor landscape in addition to an analysis of the key companies. Reports have historic and forecast data.
Technavio's kidney stones therapeutic market is segmented as below:
By End-user
- Hospitals
- Specialty clinics
- Ambulatory surgical centers
By Type
- Ureteroscopy
- Lithotripsy
- Percutaneous nephrolithonomy (PCNL)
By Therapy Area
- Calcium oxalate stones
- Uric acid
- Struvite kidney stones
- Cystine stones
- Calcium phosphate stones
By Geographical Landscape
- North America
- Europe
- Asia
- Rest of World (ROW)
This study identifies the advances in technologies in kidney stones treatment as one of the prime reasons driving the kidney stones therapeutic market growth during the next few years. Also, rising geriatric population and initiatives to increase public awareness, physician education, and clinical training will lead to sizable demand in the market.
The report on the kidney stones therapeutic market covers the following areas:
- Kidney Stones Therapeutic Market sizing
- Kidney Stones Therapeutic Market forecast
- Kidney Stones Therapeutic Market industry analysis
The robust vendor analysis is designed to help clients improve their market position, and in line with this, this report provides a detailed analysis of several leading kidney stones therapeutic market vendors that include Anvik Biotech, Aristo Pharma GmbH, Bausch Health Companies Inc., Bayer AG, Biomedix Siomond Pharma, Cipla Inc., Cmg Biotech Pvt. Ltd., Dr Reddys Laboratories Ltd., Emcure Pharmaceuticals Ltd., GlaxoSmithKline Plc, Intas Pharmaceuticals Ltd., Johnson and Johnson Services Inc., Macleods Pharmaceuticals Ltd., Medinova Diagnostic Services Ltd., Mission Pharmacal Co., Nostrum Pharmaceuticals LLC, Pfizer Inc., Walter Bushnell, Windlas Biotech Pvt. Ltd., and Worth Medicines Pvt. Ltd.. Also, the kidney stones therapeutic market analysis report includes information on upcoming trends and challenges that will influence market growth. This is to help companies strategize and leverage all forthcoming growth opportunities.
The publisher presents a detailed picture of the market by the way of study, synthesis, and summation of data from multiple sources by an analysis of key parameters such as profit, pricing, competition, and promotions. It presents various market facets by identifying the key industry influencers. The data presented is comprehensive, reliable, and a result of extensive primary and secondary research. The market research reports provide a complete competitive landscape and an in-depth vendor selection methodology and analysis using qualitative and quantitative research to forecast accurate market growth.
Table of Contents
1 Executive Summary
- 1.1 Market overview
- Executive Summary - Chart on Market Overview
- Executive Summary - Data Table on Market Overview
- Executive Summary - Chart on Global Market Characteristics
- Executive Summary - Chart on Market By Geographical Landscape
- Executive Summary - Chart on Market Segmentation by End-user
- Executive Summary - Chart on Market Segmentation by Type
- Executive Summary - Chart on Market Segmentation by Therapy Area
- Executive Summary - Chart on Incremental Growth
- Executive Summary - Data Table on Incremental Growth
- Executive Summary - Chart on Company Market Positioning
2 Technavio Analysis
- 2.1 Analysis of price sensitivity, lifecycle, customer purchase basket, adoption rates, and purchase criteria
- Analysis of price sensitivity, lifecycle, customer purchase basket, adoption rates, and purchase criteria
- 2.2 Criticality of inputs and Factors of differentiation
- Overview on criticality of inputs and factors of differentiation
- 2.3 Factors of disruption
- Overview on factors of disruption
- 2.4 Impact of drivers and challenges
- Impact of drivers and challenges in 2024 and 2029
3 Market Landscape
- 3.1 Market ecosystem
- Parent Market
- Data Table on - Parent Market
- 3.2 Market characteristics
- Market characteristics analysis
- 3.3 Value chain analysis
- Value chain analysis
4 Market Sizing
- 4.1 Market definition
- Offerings of companies included in the market definition
- 4.2 Market segment analysis
- Market segments
- 4.3 Market size 2024
- 4.4 Market outlook: Forecast for 2024-2029
- Chart on Global - Market size and forecast 2024-2029 ($ million)
- Data Table on Global - Market size and forecast 2024-2029 ($ million)
- Chart on Global Market: Year-over-year growth 2024-2029 (%)
- Data Table on Global Market: Year-over-year growth 2024-2029 (%)
5 Historic Market Size
- 5.1 Global Kidney Stones Therapeutic Market 2019 - 2023
- Historic Market Size - Data Table on Global Kidney Stones Therapeutic Market 2019 - 2023 ($ million)
- 5.2 End-user segment analysis 2019 - 2023
- Historic Market Size - End-user Segment 2019 - 2023 ($ million)
- 5.3 Type segment analysis 2019 - 2023
- Historic Market Size - Type Segment 2019 - 2023 ($ million)
- 5.4 Therapy Area segment analysis 2019 - 2023
- Historic Market Size - Therapy Area Segment 2019 - 2023 ($ million)
- 5.5 Geography segment analysis 2019 - 2023
- Historic Market Size - Geography Segment 2019 - 2023 ($ million)
- 5.6 Country segment analysis 2019 - 2023
- Historic Market Size - Country Segment 2019 - 2023 ($ million)
6 Qualitative Analysis
- 6.1 Impact of AI on global kidney stones therapeutic market
7 Five Forces Analysis
- 7.1 Five forces summary
- Five forces analysis - Comparison between 2024 and 2029
- 7.2 Bargaining power of buyers
- Bargaining power of buyers - Impact of key factors 2024 and 2029
- 7.3 Bargaining power of suppliers
- Bargaining power of suppliers - Impact of key factors in 2024 and 2029
- 7.4 Threat of new entrants
- Threat of new entrants - Impact of key factors in 2024 and 2029
- 7.5 Threat of substitutes
- Threat of substitutes - Impact of key factors in 2024 and 2029
- 7.6 Threat of rivalry
- Threat of rivalry - Impact of key factors in 2024 and 2029
- 7.7 Market condition
- Chart on Market condition - Five forces 2024 and 2029
8 Market Segmentation by End-user
- 8.1 Market segments
- Chart on End-user - Market share 2024-2029 (%)
- Data Table on End-user - Market share 2024-2029 (%)
- 8.2 Comparison by End-user
- Chart on Comparison by End-user
- Data Table on Comparison by End-user
- 8.3 Hospitals - Market size and forecast 2024-2029
- Chart on Hospitals - Market size and forecast 2024-2029 ($ million)
- Data Table on Hospitals - Market size and forecast 2024-2029 ($ million)
- Chart on Hospitals - Year-over-year growth 2024-2029 (%)
- Data Table on Hospitals - Year-over-year growth 2024-2029 (%)
- 8.4 Specialty clinics - Market size and forecast 2024-2029
- Chart on Specialty clinics - Market size and forecast 2024-2029 ($ million)
- Data Table on Specialty clinics - Market size and forecast 2024-2029 ($ million)
- Chart on Specialty clinics - Year-over-year growth 2024-2029 (%)
- Data Table on Specialty clinics - Year-over-year growth 2024-2029 (%)
- 8.5 Ambulatory surgical centers - Market size and forecast 2024-2029
- Chart on Ambulatory surgical centers - Market size and forecast 2024-2029 ($ million)
- Data Table on Ambulatory surgical centers - Market size and forecast 2024-2029 ($ million)
- Chart on Ambulatory surgical centers - Year-over-year growth 2024-2029 (%)
- Data Table on Ambulatory surgical centers - Year-over-year growth 2024-2029 (%)
- 8.6 Market opportunity by End-user
- Market opportunity by End-user ($ million)
- Data Table on Market opportunity by End-user ($ million)
9 Market Segmentation by Type
- 9.1 Market segments
- Chart on Type - Market share 2024-2029 (%)
- Data Table on Type - Market share 2024-2029 (%)
- 9.2 Comparison by Type
- Chart on Comparison by Type
- Data Table on Comparison by Type
- 9.3 Ureteroscopy - Market size and forecast 2024-2029
- Chart on Ureteroscopy - Market size and forecast 2024-2029 ($ million)
- Data Table on Ureteroscopy - Market size and forecast 2024-2029 ($ million)
- Chart on Ureteroscopy - Year-over-year growth 2024-2029 (%)
- Data Table on Ureteroscopy - Year-over-year growth 2024-2029 (%)
- 9.4 Lithotripsy - Market size and forecast 2024-2029
- Chart on Lithotripsy - Market size and forecast 2024-2029 ($ million)
- Data Table on Lithotripsy - Market size and forecast 2024-2029 ($ million)
- Chart on Lithotripsy - Year-over-year growth 2024-2029 (%)
- Data Table on Lithotripsy - Year-over-year growth 2024-2029 (%)
- 9.5 Percutaneous nephrolithonomy (PCNL) - Market size and forecast 2024-2029
- Chart on Percutaneous nephrolithonomy (PCNL) - Market size and forecast 2024-2029 ($ million)
- Data Table on Percutaneous nephrolithonomy (PCNL) - Market size and forecast 2024-2029 ($ million)
- Chart on Percutaneous nephrolithonomy (PCNL) - Year-over-year growth 2024-2029 (%)
- Data Table on Percutaneous nephrolithonomy (PCNL) - Year-over-year growth 2024-2029 (%)
- 9.6 Market opportunity by Type
- Market opportunity by Type ($ million)
- Data Table on Market opportunity by Type ($ million)
10 Market Segmentation by Therapy Area
- 10.1 Market segments
- Chart on Therapy Area - Market share 2024-2029 (%)
- Data Table on Therapy Area - Market share 2024-2029 (%)
- 10.2 Comparison by Therapy Area
- Chart on Comparison by Therapy Area
- Data Table on Comparison by Therapy Area
- 10.3 Calcium oxalate stones - Market size and forecast 2024-2029
- Chart on Calcium oxalate stones - Market size and forecast 2024-2029 ($ million)
- Data Table on Calcium oxalate stones - Market size and forecast 2024-2029 ($ million)
- Chart on Calcium oxalate stones - Year-over-year growth 2024-2029 (%)
- Data Table on Calcium oxalate stones - Year-over-year growth 2024-2029 (%)
- 10.4 Uric acid - Market size and forecast 2024-2029
- Chart on Uric acid - Market size and forecast 2024-2029 ($ million)
- Data Table on Uric acid - Market size and forecast 2024-2029 ($ million)
- Chart on Uric acid - Year-over-year growth 2024-2029 (%)
- Data Table on Uric acid - Year-over-year growth 2024-2029 (%)
- 10.5 Struvite kidney stones - Market size and forecast 2024-2029
- Chart on Struvite kidney stones - Market size and forecast 2024-2029 ($ million)
- Data Table on Struvite kidney stones - Market size and forecast 2024-2029 ($ million)
- Chart on Struvite kidney stones - Year-over-year growth 2024-2029 (%)
- Data Table on Struvite kidney stones - Year-over-year growth 2024-2029 (%)
- 10.6 Cystine stones - Market size and forecast 2024-2029
- Chart on Cystine stones - Market size and forecast 2024-2029 ($ million)
- Data Table on Cystine stones - Market size and forecast 2024-2029 ($ million)
- Chart on Cystine stones - Year-over-year growth 2024-2029 (%)
- Data Table on Cystine stones - Year-over-year growth 2024-2029 (%)
- 10.7 Calcium phosphate stones - Market size and forecast 2024-2029
- Chart on Calcium phosphate stones - Market size and forecast 2024-2029 ($ million)
- Data Table on Calcium phosphate stones - Market size and forecast 2024-2029 ($ million)
- Chart on Calcium phosphate stones - Year-over-year growth 2024-2029 (%)
- Data Table on Calcium phosphate stones - Year-over-year growth 2024-2029 (%)
- 10.8 Market opportunity by Therapy Area
- Market opportunity by Therapy Area ($ million)
- Data Table on Market opportunity by Therapy Area ($ million)
11 Customer Landscape
- 11.1 Customer landscape overview
- Analysis of price sensitivity, lifecycle, customer purchase basket, adoption rates, and purchase criteria
12 Geographic Landscape
- 12.1 Geographic segmentation
- Chart on Market share By Geographical Landscape 2024-2029 (%)
- Data Table on Market share By Geographical Landscape 2024-2029 (%)
- 12.2 Geographic comparison
- Chart on Geographic comparison
- Data Table on Geographic comparison
- 12.3 North America - Market size and forecast 2024-2029
- Chart on North America - Market size and forecast 2024-2029 ($ million)
- Data Table on North America - Market size and forecast 2024-2029 ($ million)
- Chart on North America - Year-over-year growth 2024-2029 (%)
- Data Table on North America - Year-over-year growth 2024-2029 (%)
- 12.4 Europe - Market size and forecast 2024-2029
- Chart on Europe - Market size and forecast 2024-2029 ($ million)
- Data Table on Europe - Market size and forecast 2024-2029 ($ million)
- Chart on Europe - Year-over-year growth 2024-2029 (%)
- Data Table on Europe - Year-over-year growth 2024-2029 (%)
- 12.5 Asia - Market size and forecast 2024-2029
- Chart on Asia - Market size and forecast 2024-2029 ($ million)
- Data Table on Asia - Market size and forecast 2024-2029 ($ million)
- Chart on Asia - Year-over-year growth 2024-2029 (%)
- Data Table on Asia - Year-over-year growth 2024-2029 (%)
- 12.6 Rest of World (ROW) - Market size and forecast 2024-2029
- Chart on Rest of World (ROW) - Market size and forecast 2024-2029 ($ million)
- Data Table on Rest of World (ROW) - Market size and forecast 2024-2029 ($ million)
- Chart on Rest of World (ROW) - Year-over-year growth 2024-2029 (%)
- Data Table on Rest of World (ROW) - Year-over-year growth 2024-2029 (%)
- 12.7 US - Market size and forecast 2024-2029
- Chart on US - Market size and forecast 2024-2029 ($ million)
- Data Table on US - Market size and forecast 2024-2029 ($ million)
- Chart on US - Year-over-year growth 2024-2029 (%)
- Data Table on US - Year-over-year growth 2024-2029 (%)
- 12.8 Germany - Market size and forecast 2024-2029
- Chart on Germany - Market size and forecast 2024-2029 ($ million)
- Data Table on Germany - Market size and forecast 2024-2029 ($ million)
- Chart on Germany - Year-over-year growth 2024-2029 (%)
- Data Table on Germany - Year-over-year growth 2024-2029 (%)
- 12.9 China - Market size and forecast 2024-2029
- Chart on China - Market size and forecast 2024-2029 ($ million)
- Data Table on China - Market size and forecast 2024-2029 ($ million)
- Chart on China - Year-over-year growth 2024-2029 (%)
- Data Table on China - Year-over-year growth 2024-2029 (%)
- 12.10 Canada - Market size and forecast 2024-2029
- Chart on Canada - Market size and forecast 2024-2029 ($ million)
- Data Table on Canada - Market size and forecast 2024-2029 ($ million)
- Chart on Canada - Year-over-year growth 2024-2029 (%)
- Data Table on Canada - Year-over-year growth 2024-2029 (%)
- 12.11 UK - Market size and forecast 2024-2029
- Chart on UK - Market size and forecast 2024-2029 ($ million)
- Data Table on UK - Market size and forecast 2024-2029 ($ million)
- Chart on UK - Year-over-year growth 2024-2029 (%)
- Data Table on UK - Year-over-year growth 2024-2029 (%)
- 12.12 France - Market size and forecast 2024-2029
- Chart on France - Market size and forecast 2024-2029 ($ million)
- Data Table on France - Market size and forecast 2024-2029 ($ million)
- Chart on France - Year-over-year growth 2024-2029 (%)
- Data Table on France - Year-over-year growth 2024-2029 (%)
- 12.13 Japan - Market size and forecast 2024-2029
- Chart on Japan - Market size and forecast 2024-2029 ($ million)
- Data Table on Japan - Market size and forecast 2024-2029 ($ million)
- Chart on Japan - Year-over-year growth 2024-2029 (%)
- Data Table on Japan - Year-over-year growth 2024-2029 (%)
- 12.14 India - Market size and forecast 2024-2029
- Chart on India - Market size and forecast 2024-2029 ($ million)
- Data Table on India - Market size and forecast 2024-2029 ($ million)
- Chart on India - Year-over-year growth 2024-2029 (%)
- Data Table on India - Year-over-year growth 2024-2029 (%)
- 12.15 Italy - Market size and forecast 2024-2029
- Chart on Italy - Market size and forecast 2024-2029 ($ million)
- Data Table on Italy - Market size and forecast 2024-2029 ($ million)
- Chart on Italy - Year-over-year growth 2024-2029 (%)
- Data Table on Italy - Year-over-year growth 2024-2029 (%)
- 12.16 Spain - Market size and forecast 2024-2029
- Chart on Spain - Market size and forecast 2024-2029 ($ million)
- Data Table on Spain - Market size and forecast 2024-2029 ($ million)
- Chart on Spain - Year-over-year growth 2024-2029 (%)
- Data Table on Spain - Year-over-year growth 2024-2029 (%)
- 12.17 Market opportunity By Geographical Landscape
- Market opportunity By Geographical Landscape ($ million)
- Data Tables on Market opportunity By Geographical Landscape ($ million)
13 Drivers, Challenges, and Opportunity/Restraints
- 13.1 Market drivers
- 13.2 Market challenges
- 13.3 Impact of drivers and challenges
- Impact of drivers and challenges in 2024 and 2029
- 13.4 Market opportunities/restraints
14 Competitive Landscape
- 14.1 Overview
- 14.2 Competitive Landscape
- Overview on criticality of inputs and factors of differentiation
- 14.3 Landscape disruption
- Overview on factors of disruption
- 14.4 Industry risks
- Impact of key risks on business
15 Competitive Analysis
- 15.1 Companies profiled
- Companies covered
- 15.2 Company ranking index
- Company ranking index
- 15.3 Market positioning of companies
- Matrix on companies position and classification
- 15.4 Anvik Biotech
- Anvik Biotech - Overview
- Anvik Biotech - Product / Service
- Anvik Biotech - Key offerings
- SWOT
- 15.5 Aristo Pharma GmbH
- Aristo Pharma GmbH - Overview
- Aristo Pharma GmbH - Product / Service
- Aristo Pharma GmbH - Key offerings
- SWOT
- 15.6 Bausch Health Companies Inc.
- Bausch Health Companies Inc. - Overview
- Bausch Health Companies Inc. - Business segments
- Bausch Health Companies Inc. - Key news
- Bausch Health Companies Inc. - Key offerings
- Bausch Health Companies Inc. - Segment focus
- SWOT
- 15.7 Bayer AG
- Bayer AG - Overview
- Bayer AG - Business segments
- Bayer AG - Key news
- Bayer AG - Key offerings
- Bayer AG - Segment focus
- SWOT
- 15.8 Cipla Inc.
- Cipla Inc. - Overview
- Cipla Inc. - Business segments
- Cipla Inc. - Key news
- Cipla Inc. - Key offerings
- Cipla Inc. - Segment focus
- SWOT
- 15.9 Dr Reddys Laboratories Ltd.
- Dr Reddys Laboratories Ltd. - Overview
- Dr Reddys Laboratories Ltd. - Business segments
- Dr Reddys Laboratories Ltd. - Key news
- Dr Reddys Laboratories Ltd. - Key offerings
- Dr Reddys Laboratories Ltd. - Segment focus
- SWOT
- 15.10 Emcure Pharmaceuticals Ltd.
- Emcure Pharmaceuticals Ltd. - Overview
- Emcure Pharmaceuticals Ltd. - Product / Service
- Emcure Pharmaceuticals Ltd. - Key offerings
- SWOT
- 15.11 GlaxoSmithKline Plc
- GlaxoSmithKline Plc - Overview
- GlaxoSmithKline Plc - Business segments
- GlaxoSmithKline Plc - Key news
- GlaxoSmithKline Plc - Key offerings
- GlaxoSmithKline Plc - Segment focus
- SWOT
- 15.12 Intas Pharmaceuticals Ltd.
- Intas Pharmaceuticals Ltd. - Overview
- Intas Pharmaceuticals Ltd. - Product / Service
- Intas Pharmaceuticals Ltd. - Key offerings
- SWOT
- 15.13 Macleods Pharmaceuticals Ltd.
- Macleods Pharmaceuticals Ltd. - Overview
- Macleods Pharmaceuticals Ltd. - Product / Service
- Macleods Pharmaceuticals Ltd. - Key offerings
- SWOT
- 15.14 Medinova Diagnostic Services Ltd.
- Medinova Diagnostic Services Ltd. - Overview
- Medinova Diagnostic Services Ltd. - Product / Service
- Medinova Diagnostic Services Ltd. - Key offerings
- SWOT
- 15.15 Pfizer Inc.
- Pfizer Inc. - Overview
- Pfizer Inc. - Product / Service
- Pfizer Inc. - Key news
- Pfizer Inc. - Key offerings
- SWOT
- 15.16 Walter Bushnell
- Walter Bushnell - Overview
- Walter Bushnell - Product / Service
- Walter Bushnell - Key offerings
- SWOT
- 15.17 Windlas Biotech Pvt. Ltd.
- Windlas Biotech Pvt. Ltd. - Overview
- Windlas Biotech Pvt. Ltd. - Product / Service
- Windlas Biotech Pvt. Ltd. - Key offerings
- SWOT
- 15.18 Worth Medicines Pvt. Ltd.
- Worth Medicines Pvt. Ltd. - Overview
- Worth Medicines Pvt. Ltd. - Product / Service
- Worth Medicines Pvt. Ltd. - Key offerings
- SWOT
16 Appendix
- 16.1 Scope of the report
- 16.2 Inclusions and exclusions checklist
- Inclusions checklist
- Exclusions checklist
- 16.3 Currency conversion rates for US$
- Currency conversion rates for US$
- 16.4 Research methodology
- Research methodology
- 16.5 Data procurement
- Information sources
- 16.6 Data validation
- Data validation
- 16.7 Validation techniques employed for market sizing
- Validation techniques employed for market sizing
- 16.8 Data synthesis
- Data synthesis
- 16.9 360 degree market analysis
- 360 degree market analysis
- 16.10 List of abbreviations
- List of abbreviations

