|
|
市場調査レポート
商品コード
1719477
ボディアーマーの世界市場 2025-2029Global Body Armor Market 2025-2029 |
||||||

|
|||||||
カスタマイズ可能
|
|||||||


| ボディアーマーの世界市場 2025-2029 |
|
出版日: 2025年04月23日
発行: TechNavio
ページ情報: 英文 212 Pages
納期: 即納可能
|

全表示
- 概要
- 図表
- 目次
ボディアーマー市場は2024-2029年に99億2,580万米ドル、予測期間中のCAGRは5.9%で成長すると予測されます。
当レポートでは、ボディアーマー市場の全体的な分析、市場規模・予測、動向、成長促進要因、課題、約25のベンダーを網羅したベンダー分析などを掲載しています。
現在の市場シナリオ、最新動向と促進要因、市場環境全体に関する最新分析を提供しています。市場は、安全保障上の脅威の増加、軽量原材料の出現、兵士の近代化プログラムの増加によって牽引されています。
| 市場範囲 | |
|---|---|
| 基準年 | 2025 |
| 終了年 | 2029 |
| 予測期間 | 2025-2029 |
| 成長モメンタム | 加速 |
| 前年比2025年 | 5.4% |
| CAGR | 5.9% |
| 増分額 | 99億2,580万米ドル |
本調査は、業界の主要参加者からのインプットを含め、一次情報と二次情報を客観的に組み合わせて実施しました。レポートには、主要企業の分析に加え、包括的な市場規模データ、地域分析によるセグメント、ベンダー情勢が含まれています。レポートには過去データと予測データがあります。
本調査では、人間工学に基づいて設計されたボディアーマーが、今後数年間のボディアーマー市場の成長を促進する主要な理由の1つであると特定しています。また、防弾ジャケットに使用される素材の革新や電子部品の統合は、市場の大きな需要につながります。
目次
第1章 エグゼクティブサマリー
- 市場概要
第2章 Technavio分析
- 価格・ライフサイクル・顧客購入バスケット・採用率・購入基準の分析
- インプットの重要性と差別化の要因
- 混乱の要因
- 促進要因と課題の影響
第3章 市場情勢
- 市場エコシステム
- 市場の特徴
- バリューチェーン分析
第4章 市場規模
- 市場の定義
- 市場セグメント分析
- 市場規模 2024
- 市場の見通し 2024-2029
第5章 市場規模実績
- ボディアーマーの世界市場 2019-2023
- タイプセグメント分析 2019-2023
- 製品セグメント分析 2019-2023
- 製品タイプセグメント分析 2019-2023
- 地域別セグメント分析 2019-2023
- 国別セグメント分析 2019-2023
第6章 定性分析
- AIの影響:ボディアーマーの世界市場
第7章 ファイブフォース分析
- ファイブフォースの要約
- 買い手の交渉力
- 供給企業の交渉力
- 新規参入業者の脅威
- 代替品の脅威
- 競争の脅威
- 市況
第8章 市場セグメンテーション:タイプ別
- 市場セグメント
- 比較:タイプ別
- BPJ:市場規模と予測 2024-2029
- 前立腺肥大症:市場規模と予測 2024-2029
- 市場機会:タイプ別
第9章 市場セグメンテーション:製品別
- 市場セグメント
- 比較:製品別
- 明白な:市場規模と予測 2024-2029
- 隠密:市場規模と予測 2024-2029
- 市場機会:製品別
第10章 市場セグメンテーション:製品タイプ別
- 市場セグメント
- 比較:製品タイプ別
- 戦術装甲:市場規模と予測 2024-2029
- 隠蔽可能な装甲:市場規模と予測 2024-2029
- 刺突装甲:市場規模と予測 2024-2029
- 市場機会:製品タイプ別
第11章 顧客情勢
- 顧客情勢の概要
第12章 地域別情勢
- 地域別セグメンテーション
- 地域別比較
- アジア太平洋:市場規模と予測 2024-2029
- 欧州:市場規模と予測 2024-2029
- 北米:市場規模と予測 2024-2029
- 南米:市場規模と予測 2024-2029
- 中東・アフリカ:市場規模と予測 2024-2029
- インド:市場規模と予測 2024-2029
- 中国:市場規模と予測 2024-2029
- ロシア:市場規模と予測 2024-2029
- 米国:市場規模と予測 2024-2029
- トルコ:市場規模と予測 2024-2029
- 日本:市場規模と予測 2024-2029
- 韓国:市場規模と予測 2024-2029
- ドイツ:市場規模と予測 2024-2029
- オーストラリア:市場規模と予測 2024-2029
- 英国:市場規模と予測 2024-2029
- 市場機会:地域情勢別
第13章 促進要因・課題・機会・抑制要因
- 市場促進要因
- 市場の課題
- 促進要因と課題の影響
- 市場の機会・抑制要因
第14章 競合情勢
- 概要
- 競合情勢
- 混乱の状況
- 業界のリスク
第15章 競合分析
- 企業プロファイル
- 企業ランキング指数
- 企業の市場ポジショニング
- Ace Link Industrial Inc.
- Armored Republic Holdings LLC
- BAE Systems Plc
- Canadian Armour Ltd.
- Craig International Ballistics Pty. Ltd.
- DFNDR Armor
- DuPont de Nemours Inc.
- Hellweg International Pty Ltd.
- Hoplite Armor LLC
- Med Eng Holdings ULC
- Point Blank Enterprises Inc.
- Spartan Armor Systems
- U.S. ARMOR Corp.
- United Shield International LLC
第16章 付録
Exhibits:
- Exhibits1: Executive Summary - Chart on Market Overview
- Exhibits2: Executive Summary - Data Table on Market Overview
- Exhibits3: Executive Summary - Chart on Global Market Characteristics
- Exhibits4: Executive Summary - Chart on Market By Geographical Landscape
- Exhibits5: Executive Summary - Chart on Market Segmentation by Type
- Exhibits6: Executive Summary - Chart on Market Segmentation by Product
- Exhibits7: Executive Summary - Chart on Market Segmentation by Product Type
- Exhibits8: Executive Summary - Chart on Incremental Growth
- Exhibits9: Executive Summary - Data Table on Incremental Growth
- Exhibits10: Executive Summary - Chart on Company Market Positioning
- Exhibits11: Analysis of price sensitivity, lifecycle, customer purchase basket, adoption rates, and purchase criteria
- Exhibits12: Overview on criticality of inputs and factors of differentiation
- Exhibits13: Overview on factors of disruption
- Exhibits14: Impact of drivers and challenges in 2024 and 2029
- Exhibits15: Parent Market
- Exhibits16: Data Table on - Parent Market
- Exhibits17: Market characteristics analysis
- Exhibits18: Value chain analysis
- Exhibits19: Offerings of companies included in the market definition
- Exhibits20: Market segments
- Exhibits21: Chart on Global - Market size and forecast 2024-2029 ($ million)
- Exhibits22: Data Table on Global - Market size and forecast 2024-2029 ($ million)
- Exhibits23: Chart on Global Market: Year-over-year growth 2024-2029 (%)
- Exhibits24: Data Table on Global Market: Year-over-year growth 2024-2029 (%)
- Exhibits25: Historic Market Size - Data Table on Global Body Armor Market 2019 - 2023 ($ million)
- Exhibits26: Historic Market Size - Type Segment 2019 - 2023 ($ million)
- Exhibits27: Historic Market Size - Product Segment 2019 - 2023 ($ million)
- Exhibits28: Historic Market Size - Product Type Segment 2019 - 2023 ($ million)
- Exhibits29: Historic Market Size - Geography Segment 2019 - 2023 ($ million)
- Exhibits30: Historic Market Size - Country Segment 2019 - 2023 ($ million)
- Exhibits31: Five forces analysis - Comparison between 2024 and 2029
- Exhibits32: Bargaining power of buyers - Impact of key factors 2024 and 2029
- Exhibits33: Bargaining power of suppliers - Impact of key factors in 2024 and 2029
- Exhibits34: Threat of new entrants - Impact of key factors in 2024 and 2029
- Exhibits35: Threat of substitutes - Impact of key factors in 2024 and 2029
- Exhibits36: Threat of rivalry - Impact of key factors in 2024 and 2029
- Exhibits37: Chart on Market condition - Five forces 2024 and 2029
- Exhibits38: Chart on Type - Market share 2024-2029 (%)
- Exhibits39: Data Table on Type - Market share 2024-2029 (%)
- Exhibits40: Chart on Comparison by Type
- Exhibits41: Data Table on Comparison by Type
- Exhibits42: Chart on BPJ - Market size and forecast 2024-2029 ($ million)
- Exhibits43: Data Table on BPJ - Market size and forecast 2024-2029 ($ million)
- Exhibits44: Chart on BPJ - Year-over-year growth 2024-2029 (%)
- Exhibits45: Data Table on BPJ - Year-over-year growth 2024-2029 (%)
- Exhibits46: Chart on BPH - Market size and forecast 2024-2029 ($ million)
- Exhibits47: Data Table on BPH - Market size and forecast 2024-2029 ($ million)
- Exhibits48: Chart on BPH - Year-over-year growth 2024-2029 (%)
- Exhibits49: Data Table on BPH - Year-over-year growth 2024-2029 (%)
- Exhibits50: Market opportunity by Type ($ million)
- Exhibits51: Data Table on Market opportunity by Type ($ million)
- Exhibits52: Chart on Product - Market share 2024-2029 (%)
- Exhibits53: Data Table on Product - Market share 2024-2029 (%)
- Exhibits54: Chart on Comparison by Product
- Exhibits55: Data Table on Comparison by Product
- Exhibits56: Chart on Overt - Market size and forecast 2024-2029 ($ million)
- Exhibits57: Data Table on Overt - Market size and forecast 2024-2029 ($ million)
- Exhibits58: Chart on Overt - Year-over-year growth 2024-2029 (%)
- Exhibits59: Data Table on Overt - Year-over-year growth 2024-2029 (%)
- Exhibits60: Chart on Covert - Market size and forecast 2024-2029 ($ million)
- Exhibits61: Data Table on Covert - Market size and forecast 2024-2029 ($ million)
- Exhibits62: Chart on Covert - Year-over-year growth 2024-2029 (%)
- Exhibits63: Data Table on Covert - Year-over-year growth 2024-2029 (%)
- Exhibits64: Market opportunity by Product ($ million)
- Exhibits65: Data Table on Market opportunity by Product ($ million)
- Exhibits66: Chart on Product Type - Market share 2024-2029 (%)
- Exhibits67: Data Table on Product Type - Market share 2024-2029 (%)
- Exhibits68: Chart on Comparison by Product Type
- Exhibits69: Data Table on Comparison by Product Type
- Exhibits70: Chart on Tactical armor - Market size and forecast 2024-2029 ($ million)
- Exhibits71: Data Table on Tactical armor - Market size and forecast 2024-2029 ($ million)
- Exhibits72: Chart on Tactical armor - Year-over-year growth 2024-2029 (%)
- Exhibits73: Data Table on Tactical armor - Year-over-year growth 2024-2029 (%)
- Exhibits74: Chart on Concealable armor - Market size and forecast 2024-2029 ($ million)
- Exhibits75: Data Table on Concealable armor - Market size and forecast 2024-2029 ($ million)
- Exhibits76: Chart on Concealable armor - Year-over-year growth 2024-2029 (%)
- Exhibits77: Data Table on Concealable armor - Year-over-year growth 2024-2029 (%)
- Exhibits78: Chart on Stab armor - Market size and forecast 2024-2029 ($ million)
- Exhibits79: Data Table on Stab armor - Market size and forecast 2024-2029 ($ million)
- Exhibits80: Chart on Stab armor - Year-over-year growth 2024-2029 (%)
- Exhibits81: Data Table on Stab armor - Year-over-year growth 2024-2029 (%)
- Exhibits82: Market opportunity by Product Type ($ million)
- Exhibits83: Data Table on Market opportunity by Product Type ($ million)
- Exhibits84: Analysis of price sensitivity, lifecycle, customer purchase basket, adoption rates, and purchase criteria
- Exhibits85: Chart on Market share By Geographical Landscape 2024-2029 (%)
- Exhibits86: Data Table on Market share By Geographical Landscape 2024-2029 (%)
- Exhibits87: Chart on Geographic comparison
- Exhibits88: Data Table on Geographic comparison
- Exhibits89: Chart on APAC - Market size and forecast 2024-2029 ($ million)
- Exhibits90: Data Table on APAC - Market size and forecast 2024-2029 ($ million)
- Exhibits91: Chart on APAC - Year-over-year growth 2024-2029 (%)
- Exhibits92: Data Table on APAC - Year-over-year growth 2024-2029 (%)
- Exhibits93: Chart on Europe - Market size and forecast 2024-2029 ($ million)
- Exhibits94: Data Table on Europe - Market size and forecast 2024-2029 ($ million)
- Exhibits95: Chart on Europe - Year-over-year growth 2024-2029 (%)
- Exhibits96: Data Table on Europe - Year-over-year growth 2024-2029 (%)
- Exhibits97: Chart on North America - Market size and forecast 2024-2029 ($ million)
- Exhibits98: Data Table on North America - Market size and forecast 2024-2029 ($ million)
- Exhibits99: Chart on North America - Year-over-year growth 2024-2029 (%)
- Exhibits100: Data Table on North America - Year-over-year growth 2024-2029 (%)
- Exhibits101: Chart on South America - Market size and forecast 2024-2029 ($ million)
- Exhibits102: Data Table on South America - Market size and forecast 2024-2029 ($ million)
- Exhibits103: Chart on South America - Year-over-year growth 2024-2029 (%)
- Exhibits104: Data Table on South America - Year-over-year growth 2024-2029 (%)
- Exhibits105: Chart on Middle East and Africa - Market size and forecast 2024-2029 ($ million)
- Exhibits106: Data Table on Middle East and Africa - Market size and forecast 2024-2029 ($ million)
- Exhibits107: Chart on Middle East and Africa - Year-over-year growth 2024-2029 (%)
- Exhibits108: Data Table on Middle East and Africa - Year-over-year growth 2024-2029 (%)
- Exhibits109: Chart on India - Market size and forecast 2024-2029 ($ million)
- Exhibits110: Data Table on India - Market size and forecast 2024-2029 ($ million)
- Exhibits111: Chart on India - Year-over-year growth 2024-2029 (%)
- Exhibits112: Data Table on India - Year-over-year growth 2024-2029 (%)
- Exhibits113: Chart on China - Market size and forecast 2024-2029 ($ million)
- Exhibits114: Data Table on China - Market size and forecast 2024-2029 ($ million)
- Exhibits115: Chart on China - Year-over-year growth 2024-2029 (%)
- Exhibits116: Data Table on China - Year-over-year growth 2024-2029 (%)
- Exhibits117: Chart on Russia - Market size and forecast 2024-2029 ($ million)
- Exhibits118: Data Table on Russia - Market size and forecast 2024-2029 ($ million)
- Exhibits119: Chart on Russia - Year-over-year growth 2024-2029 (%)
- Exhibits120: Data Table on Russia - Year-over-year growth 2024-2029 (%)
- Exhibits121: Chart on US - Market size and forecast 2024-2029 ($ million)
- Exhibits122: Data Table on US - Market size and forecast 2024-2029 ($ million)
- Exhibits123: Chart on US - Year-over-year growth 2024-2029 (%)
- Exhibits124: Data Table on US - Year-over-year growth 2024-2029 (%)
- Exhibits125: Chart on Turkey - Market size and forecast 2024-2029 ($ million)
- Exhibits126: Data Table on Turkey - Market size and forecast 2024-2029 ($ million)
- Exhibits127: Chart on Turkey - Year-over-year growth 2024-2029 (%)
- Exhibits128: Data Table on Turkey - Year-over-year growth 2024-2029 (%)
- Exhibits129: Chart on Japan - Market size and forecast 2024-2029 ($ million)
- Exhibits130: Data Table on Japan - Market size and forecast 2024-2029 ($ million)
- Exhibits131: Chart on Japan - Year-over-year growth 2024-2029 (%)
- Exhibits132: Data Table on Japan - Year-over-year growth 2024-2029 (%)
- Exhibits133: Chart on South Korea - Market size and forecast 2024-2029 ($ million)
- Exhibits134: Data Table on South Korea - Market size and forecast 2024-2029 ($ million)
- Exhibits135: Chart on South Korea - Year-over-year growth 2024-2029 (%)
- Exhibits136: Data Table on South Korea - Year-over-year growth 2024-2029 (%)
- Exhibits137: Chart on Germany - Market size and forecast 2024-2029 ($ million)
- Exhibits138: Data Table on Germany - Market size and forecast 2024-2029 ($ million)
- Exhibits139: Chart on Germany - Year-over-year growth 2024-2029 (%)
- Exhibits140: Data Table on Germany - Year-over-year growth 2024-2029 (%)
- Exhibits141: Chart on Australia - Market size and forecast 2024-2029 ($ million)
- Exhibits142: Data Table on Australia - Market size and forecast 2024-2029 ($ million)
- Exhibits143: Chart on Australia - Year-over-year growth 2024-2029 (%)
- Exhibits144: Data Table on Australia - Year-over-year growth 2024-2029 (%)
- Exhibits145: Chart on UK - Market size and forecast 2024-2029 ($ million)
- Exhibits146: Data Table on UK - Market size and forecast 2024-2029 ($ million)
- Exhibits147: Chart on UK - Year-over-year growth 2024-2029 (%)
- Exhibits148: Data Table on UK - Year-over-year growth 2024-2029 (%)
- Exhibits149: Market opportunity By Geographical Landscape ($ million)
- Exhibits150: Data Tables on Market opportunity By Geographical Landscape ($ million)
- Exhibits151: Impact of drivers and challenges in 2024 and 2029
- Exhibits152: Overview on criticality of inputs and factors of differentiation
- Exhibits153: Overview on factors of disruption
- Exhibits154: Impact of key risks on business
- Exhibits155: Companies covered
- Exhibits156: Company ranking index
- Exhibits157: Matrix on companies position and classification
- Exhibits158: 3M Co. - Overview
- Exhibits159: 3M Co. - Business segments
- Exhibits160: 3M Co. - Key news
- Exhibits161: 3M Co. - Key offerings
- Exhibits162: 3M Co. - Segment focus
- Exhibits163: SWOT
- Exhibits164: Ace Link Industrial Inc. - Overview
- Exhibits165: Ace Link Industrial Inc. - Product / Service
- Exhibits166: Ace Link Industrial Inc. - Key offerings
- Exhibits167: SWOT
- Exhibits168: Armored Republic Holdings LLC - Overview
- Exhibits169: Armored Republic Holdings LLC - Product / Service
- Exhibits170: Armored Republic Holdings LLC - Key offerings
- Exhibits171: SWOT
- Exhibits172: BAE Systems Plc - Overview
- Exhibits173: BAE Systems Plc - Business segments
- Exhibits174: BAE Systems Plc - Key news
- Exhibits175: BAE Systems Plc - Key offerings
- Exhibits176: BAE Systems Plc - Segment focus
- Exhibits177: SWOT
- Exhibits178: Canadian Armour Ltd. - Overview
- Exhibits179: Canadian Armour Ltd. - Product / Service
- Exhibits180: Canadian Armour Ltd. - Key offerings
- Exhibits181: SWOT
- Exhibits182: Craig International Ballistics Pty. Ltd. - Overview
- Exhibits183: Craig International Ballistics Pty. Ltd. - Product / Service
- Exhibits184: Craig International Ballistics Pty. Ltd. - Key offerings
- Exhibits185: SWOT
- Exhibits186: DFNDR Armor - Overview
- Exhibits187: DFNDR Armor - Product / Service
- Exhibits188: DFNDR Armor - Key offerings
- Exhibits189: SWOT
- Exhibits190: DuPont de Nemours Inc. - Overview
- Exhibits191: DuPont de Nemours Inc. - Business segments
- Exhibits192: DuPont de Nemours Inc. - Key news
- Exhibits193: DuPont de Nemours Inc. - Key offerings
- Exhibits194: DuPont de Nemours Inc. - Segment focus
- Exhibits195: SWOT
- Exhibits196: Hellweg International Pty Ltd. - Overview
- Exhibits197: Hellweg International Pty Ltd. - Product / Service
- Exhibits198: Hellweg International Pty Ltd. - Key offerings
- Exhibits199: SWOT
- Exhibits200: Hoplite Armor LLC - Overview
- Exhibits201: Hoplite Armor LLC - Product / Service
- Exhibits202: Hoplite Armor LLC - Key offerings
- Exhibits203: SWOT
- Exhibits204: Med Eng Holdings ULC - Overview
- Exhibits205: Med Eng Holdings ULC - Product / Service
- Exhibits206: Med Eng Holdings ULC - Key offerings
- Exhibits207: SWOT
- Exhibits208: Point Blank Enterprises Inc. - Overview
- Exhibits209: Point Blank Enterprises Inc. - Product / Service
- Exhibits210: Point Blank Enterprises Inc. - Key offerings
- Exhibits211: SWOT
- Exhibits212: Spartan Armor Systems - Overview
- Exhibits213: Spartan Armor Systems - Product / Service
- Exhibits214: Spartan Armor Systems - Key offerings
- Exhibits215: SWOT
- Exhibits216: U.S. ARMOR Corp. - Overview
- Exhibits217: U.S. ARMOR Corp. - Product / Service
- Exhibits218: U.S. ARMOR Corp. - Key offerings
- Exhibits219: SWOT
- Exhibits220: United Shield International LLC - Overview
- Exhibits221: United Shield International LLC - Product / Service
- Exhibits222: United Shield International LLC - Key offerings
- Exhibits223: SWOT
- Exhibits224: Inclusions checklist
- Exhibits225: Exclusions checklist
- Exhibits226: Currency conversion rates for US$
- Exhibits227: Research methodology
- Exhibits228: Information sources
- Exhibits229: Data validation
- Exhibits230: Validation techniques employed for market sizing
- Exhibits231: Data synthesis
- Exhibits232: 360 degree market analysis
- Exhibits233: List of abbreviations
The body armor market is forecasted to grow by USD 9925.8 mn during 2024-2029, accelerating at a CAGR of 5.9% during the forecast period. The report on the body armor market provides a holistic analysis, market size and forecast, trends, growth drivers, and challenges, as well as vendor analysis covering around 25 vendors.
The report offers an up-to-date analysis regarding the current market scenario, the latest trends and drivers, and the overall market environment. The market is driven by rise in security threats, emergence of lightweight raw materials, and rising number of soldier modernization programs.
| Market Scope | |
|---|---|
| Base Year | 2025 |
| End Year | 2029 |
| Series Year | 2025-2029 |
| Growth Momentum | Accelerate |
| YOY 2025 | 5.4% |
| CAGR | 5.9% |
| Incremental Value | $9925.8 mn |
The study was conducted using an objective combination of primary and secondary information including inputs from key participants in the industry. The report contains a comprehensive market size data, segment with regional analysis and vendor landscape in addition to an analysis of the key companies. Reports have historic and forecast data.
Technavio's body armor market is segmented as below:
By Type
- BPJ
- BPH
By Product
- Overt
- Covert
By Product Type
- Tactical armor
- Concealable armor
- Stab armor
By Geographical Landscape
- APAC
- Europe
- North America
- South America
- Middle East and Africa
This study identifies the ergonomically designed body armor as one of the prime reasons driving the body armor market growth during the next few years. Also, innovations in materials used for bulletproof jackets and integration of electronic components will lead to sizable demand in the market.
The report on the body armor market covers the following areas:
- Body Armor Market sizing
- Body Armor Market forecast
- Body Armor Market industry analysis
The robust vendor analysis is designed to help clients improve their market position, and in line with this, this report provides a detailed analysis of several leading body armor market vendors that include 3M Co., Ace Link Industrial Inc., Armored Republic Holdings LLC, BAE Systems Plc, Canadian Armour Ltd., Craig International Ballistics Pty. Ltd., DFNDR Armor, DuPont de Nemours Inc., Hellweg International Pty Ltd., Hoplite Armor LLC, Indian Armour Systems Pvt. Ltd., MARS Armor, Med Eng Holdings ULC, Point Blank Enterprises Inc., PT Armor Inc., Spartan Armor Systems, Survival Armor Inc., U.S. ARMOR Corp., ULBRICHTS GMBH, and United Shield International LLC. Also, the body armor market analysis report includes information on upcoming trends and challenges that will influence market growth. This is to help companies strategize and leverage all forthcoming growth opportunities.
The publisher presents a detailed picture of the market by the way of study, synthesis, and summation of data from multiple sources by an analysis of key parameters such as profit, pricing, competition, and promotions. It presents various market facets by identifying the key industry influencers. The data presented is comprehensive, reliable, and a result of extensive primary and secondary research. The market research reports provide a complete competitive landscape and an in-depth vendor selection methodology and analysis using qualitative and quantitative research to forecast accurate market growth.
Table of Contents
1 Executive Summary
- 1.1 Market overview
- Executive Summary - Chart on Market Overview
- Executive Summary - Data Table on Market Overview
- Executive Summary - Chart on Global Market Characteristics
- Executive Summary - Chart on Market By Geographical Landscape
- Executive Summary - Chart on Market Segmentation by Type
- Executive Summary - Chart on Market Segmentation by Product
- Executive Summary - Chart on Market Segmentation by Product Type
- Executive Summary - Chart on Incremental Growth
- Executive Summary - Data Table on Incremental Growth
- Executive Summary - Chart on Company Market Positioning
2 Technavio Analysis
- 2.1 Analysis of price sensitivity, lifecycle, customer purchase basket, adoption rates, and purchase criteria
- Analysis of price sensitivity, lifecycle, customer purchase basket, adoption rates, and purchase criteria
- 2.2 Criticality of inputs and Factors of differentiation
- Overview on criticality of inputs and factors of differentiation
- 2.3 Factors of disruption
- Overview on factors of disruption
- 2.4 Impact of drivers and challenges
- Impact of drivers and challenges in 2024 and 2029
3 Market Landscape
- 3.1 Market ecosystem
- Parent Market
- Data Table on - Parent Market
- 3.2 Market characteristics
- Market characteristics analysis
- 3.3 Value chain analysis
- Value chain analysis
4 Market Sizing
- 4.1 Market definition
- Offerings of companies included in the market definition
- 4.2 Market segment analysis
- Market segments
- 4.3 Market size 2024
- 4.4 Market outlook: Forecast for 2024-2029
- Chart on Global - Market size and forecast 2024-2029 ($ million)
- Data Table on Global - Market size and forecast 2024-2029 ($ million)
- Chart on Global Market: Year-over-year growth 2024-2029 (%)
- Data Table on Global Market: Year-over-year growth 2024-2029 (%)
5 Historic Market Size
- 5.1 Global Body Armor Market 2019 - 2023
- Historic Market Size - Data Table on Global Body Armor Market 2019 - 2023 ($ million)
- 5.2 Type segment analysis 2019 - 2023
- Historic Market Size - Type Segment 2019 - 2023 ($ million)
- 5.3 Product segment analysis 2019 - 2023
- Historic Market Size - Product Segment 2019 - 2023 ($ million)
- 5.4 Product Type segment analysis 2019 - 2023
- Historic Market Size - Product Type Segment 2019 - 2023 ($ million)
- 5.5 Geography segment analysis 2019 - 2023
- Historic Market Size - Geography Segment 2019 - 2023 ($ million)
- 5.6 Country segment analysis 2019 - 2023
- Historic Market Size - Country Segment 2019 - 2023 ($ million)
6 Qualitative Analysis
- 6.1 Impact of AI on Global Body Armor Market
7 Five Forces Analysis
- 7.1 Five forces summary
- Five forces analysis - Comparison between 2024 and 2029
- 7.2 Bargaining power of buyers
- Bargaining power of buyers - Impact of key factors 2024 and 2029
- 7.3 Bargaining power of suppliers
- Bargaining power of suppliers - Impact of key factors in 2024 and 2029
- 7.4 Threat of new entrants
- Threat of new entrants - Impact of key factors in 2024 and 2029
- 7.5 Threat of substitutes
- Threat of substitutes - Impact of key factors in 2024 and 2029
- 7.6 Threat of rivalry
- Threat of rivalry - Impact of key factors in 2024 and 2029
- 7.7 Market condition
- Chart on Market condition - Five forces 2024 and 2029
8 Market Segmentation by Type
- 8.1 Market segments
- Chart on Type - Market share 2024-2029 (%)
- Data Table on Type - Market share 2024-2029 (%)
- 8.2 Comparison by Type
- Chart on Comparison by Type
- Data Table on Comparison by Type
- 8.3 BPJ - Market size and forecast 2024-2029
- Chart on BPJ - Market size and forecast 2024-2029 ($ million)
- Data Table on BPJ - Market size and forecast 2024-2029 ($ million)
- Chart on BPJ - Year-over-year growth 2024-2029 (%)
- Data Table on BPJ - Year-over-year growth 2024-2029 (%)
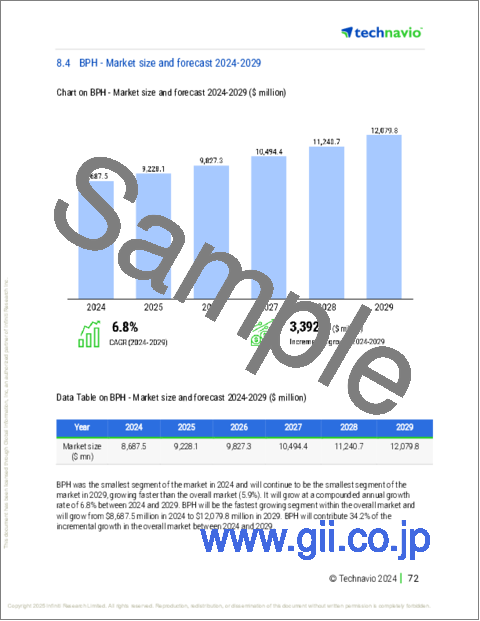
- 8.4 BPH - Market size and forecast 2024-2029
- Chart on BPH - Market size and forecast 2024-2029 ($ million)
- Data Table on BPH - Market size and forecast 2024-2029 ($ million)
- Chart on BPH - Year-over-year growth 2024-2029 (%)
- Data Table on BPH - Year-over-year growth 2024-2029 (%)
- 8.5 Market opportunity by Type
- Market opportunity by Type ($ million)
- Data Table on Market opportunity by Type ($ million)
9 Market Segmentation by Product
- 9.1 Market segments
- Chart on Product - Market share 2024-2029 (%)
- Data Table on Product - Market share 2024-2029 (%)
- 9.2 Comparison by Product
- Chart on Comparison by Product
- Data Table on Comparison by Product
- 9.3 Overt - Market size and forecast 2024-2029
- Chart on Overt - Market size and forecast 2024-2029 ($ million)
- Data Table on Overt - Market size and forecast 2024-2029 ($ million)
- Chart on Overt - Year-over-year growth 2024-2029 (%)
- Data Table on Overt - Year-over-year growth 2024-2029 (%)
- 9.4 Covert - Market size and forecast 2024-2029
- Chart on Covert - Market size and forecast 2024-2029 ($ million)
- Data Table on Covert - Market size and forecast 2024-2029 ($ million)
- Chart on Covert - Year-over-year growth 2024-2029 (%)
- Data Table on Covert - Year-over-year growth 2024-2029 (%)
- 9.5 Market opportunity by Product
- Market opportunity by Product ($ million)
- Data Table on Market opportunity by Product ($ million)
10 Market Segmentation by Product Type
- 10.1 Market segments
- Chart on Product Type - Market share 2024-2029 (%)
- Data Table on Product Type - Market share 2024-2029 (%)
- 10.2 Comparison by Product Type
- Chart on Comparison by Product Type
- Data Table on Comparison by Product Type
- 10.3 Tactical armor - Market size and forecast 2024-2029
- Chart on Tactical armor - Market size and forecast 2024-2029 ($ million)
- Data Table on Tactical armor - Market size and forecast 2024-2029 ($ million)
- Chart on Tactical armor - Year-over-year growth 2024-2029 (%)
- Data Table on Tactical armor - Year-over-year growth 2024-2029 (%)
- 10.4 Concealable armor - Market size and forecast 2024-2029
- Chart on Concealable armor - Market size and forecast 2024-2029 ($ million)
- Data Table on Concealable armor - Market size and forecast 2024-2029 ($ million)
- Chart on Concealable armor - Year-over-year growth 2024-2029 (%)
- Data Table on Concealable armor - Year-over-year growth 2024-2029 (%)
- 10.5 Stab armor - Market size and forecast 2024-2029
- Chart on Stab armor - Market size and forecast 2024-2029 ($ million)
- Data Table on Stab armor - Market size and forecast 2024-2029 ($ million)
- Chart on Stab armor - Year-over-year growth 2024-2029 (%)
- Data Table on Stab armor - Year-over-year growth 2024-2029 (%)
- 10.6 Market opportunity by Product Type
- Market opportunity by Product Type ($ million)
- Data Table on Market opportunity by Product Type ($ million)
11 Customer Landscape
- 11.1 Customer landscape overview
- Analysis of price sensitivity, lifecycle, customer purchase basket, adoption rates, and purchase criteria
12 Geographic Landscape
- 12.1 Geographic segmentation
- Chart on Market share By Geographical Landscape 2024-2029 (%)
- Data Table on Market share By Geographical Landscape 2024-2029 (%)
- 12.2 Geographic comparison
- Chart on Geographic comparison
- Data Table on Geographic comparison
- 12.3 APAC - Market size and forecast 2024-2029
- Chart on APAC - Market size and forecast 2024-2029 ($ million)
- Data Table on APAC - Market size and forecast 2024-2029 ($ million)
- Chart on APAC - Year-over-year growth 2024-2029 (%)
- Data Table on APAC - Year-over-year growth 2024-2029 (%)
- 12.4 Europe - Market size and forecast 2024-2029
- Chart on Europe - Market size and forecast 2024-2029 ($ million)
- Data Table on Europe - Market size and forecast 2024-2029 ($ million)
- Chart on Europe - Year-over-year growth 2024-2029 (%)
- Data Table on Europe - Year-over-year growth 2024-2029 (%)
- 12.5 North America - Market size and forecast 2024-2029
- Chart on North America - Market size and forecast 2024-2029 ($ million)
- Data Table on North America - Market size and forecast 2024-2029 ($ million)
- Chart on North America - Year-over-year growth 2024-2029 (%)
- Data Table on North America - Year-over-year growth 2024-2029 (%)
- 12.6 South America - Market size and forecast 2024-2029
- Chart on South America - Market size and forecast 2024-2029 ($ million)
- Data Table on South America - Market size and forecast 2024-2029 ($ million)
- Chart on South America - Year-over-year growth 2024-2029 (%)
- Data Table on South America - Year-over-year growth 2024-2029 (%)
- 12.7 Middle East and Africa - Market size and forecast 2024-2029
- Chart on Middle East and Africa - Market size and forecast 2024-2029 ($ million)
- Data Table on Middle East and Africa - Market size and forecast 2024-2029 ($ million)
- Chart on Middle East and Africa - Year-over-year growth 2024-2029 (%)
- Data Table on Middle East and Africa - Year-over-year growth 2024-2029 (%)
- 12.8 India - Market size and forecast 2024-2029
- Chart on India - Market size and forecast 2024-2029 ($ million)
- Data Table on India - Market size and forecast 2024-2029 ($ million)
- Chart on India - Year-over-year growth 2024-2029 (%)
- Data Table on India - Year-over-year growth 2024-2029 (%)
- 12.9 China - Market size and forecast 2024-2029
- Chart on China - Market size and forecast 2024-2029 ($ million)
- Data Table on China - Market size and forecast 2024-2029 ($ million)
- Chart on China - Year-over-year growth 2024-2029 (%)
- Data Table on China - Year-over-year growth 2024-2029 (%)
- 12.10 Russia - Market size and forecast 2024-2029
- Chart on Russia - Market size and forecast 2024-2029 ($ million)
- Data Table on Russia - Market size and forecast 2024-2029 ($ million)
- Chart on Russia - Year-over-year growth 2024-2029 (%)
- Data Table on Russia - Year-over-year growth 2024-2029 (%)
- 12.11 US - Market size and forecast 2024-2029
- Chart on US - Market size and forecast 2024-2029 ($ million)
- Data Table on US - Market size and forecast 2024-2029 ($ million)
- Chart on US - Year-over-year growth 2024-2029 (%)
- Data Table on US - Year-over-year growth 2024-2029 (%)
- 12.12 Turkey - Market size and forecast 2024-2029
- Chart on Turkey - Market size and forecast 2024-2029 ($ million)
- Data Table on Turkey - Market size and forecast 2024-2029 ($ million)
- Chart on Turkey - Year-over-year growth 2024-2029 (%)
- Data Table on Turkey - Year-over-year growth 2024-2029 (%)
- 12.13 Japan - Market size and forecast 2024-2029
- Chart on Japan - Market size and forecast 2024-2029 ($ million)
- Data Table on Japan - Market size and forecast 2024-2029 ($ million)
- Chart on Japan - Year-over-year growth 2024-2029 (%)
- Data Table on Japan - Year-over-year growth 2024-2029 (%)
- 12.14 South Korea - Market size and forecast 2024-2029
- Chart on South Korea - Market size and forecast 2024-2029 ($ million)
- Data Table on South Korea - Market size and forecast 2024-2029 ($ million)
- Chart on South Korea - Year-over-year growth 2024-2029 (%)
- Data Table on South Korea - Year-over-year growth 2024-2029 (%)
- 12.15 Germany - Market size and forecast 2024-2029
- Chart on Germany - Market size and forecast 2024-2029 ($ million)
- Data Table on Germany - Market size and forecast 2024-2029 ($ million)
- Chart on Germany - Year-over-year growth 2024-2029 (%)
- Data Table on Germany - Year-over-year growth 2024-2029 (%)
- 12.16 Australia - Market size and forecast 2024-2029
- Chart on Australia - Market size and forecast 2024-2029 ($ million)
- Data Table on Australia - Market size and forecast 2024-2029 ($ million)
- Chart on Australia - Year-over-year growth 2024-2029 (%)
- Data Table on Australia - Year-over-year growth 2024-2029 (%)
- 12.17 UK - Market size and forecast 2024-2029
- Chart on UK - Market size and forecast 2024-2029 ($ million)
- Data Table on UK - Market size and forecast 2024-2029 ($ million)
- Chart on UK - Year-over-year growth 2024-2029 (%)
- Data Table on UK - Year-over-year growth 2024-2029 (%)
- 12.18 Market opportunity By Geographical Landscape
- Market opportunity By Geographical Landscape ($ million)
- Data Tables on Market opportunity By Geographical Landscape ($ million)
13 Drivers, Challenges, and Opportunity/Restraints
- 13.1 Market drivers
- 13.2 Market challenges
- 13.3 Impact of drivers and challenges
- Impact of drivers and challenges in 2024 and 2029
- 13.4 Market opportunities/restraints
14 Competitive Landscape
- 14.1 Overview
- 14.2 Competitive Landscape
- Overview on criticality of inputs and factors of differentiation
- 14.3 Landscape disruption
- Overview on factors of disruption
- 14.4 Industry risks
- Impact of key risks on business
15 Competitive Analysis
- 15.1 Companies profiled
- Companies covered
- 15.2 Company ranking index
- Company ranking index
- 15.3 Market positioning of companies
- Matrix on companies position and classification
- 3M Co.
- 3M Co. - Overview
- 3M Co. - Business segments
- 3M Co. - Key news
- 3M Co. - Key offerings
- 3M Co. - Segment focus
- SWOT
- 15.5 Ace Link Industrial Inc.
- Ace Link Industrial Inc. - Overview
- Ace Link Industrial Inc. - Product / Service
- Ace Link Industrial Inc. - Key offerings
- SWOT
- 15.6 Armored Republic Holdings LLC
- Armored Republic Holdings LLC - Overview
- Armored Republic Holdings LLC - Product / Service
- Armored Republic Holdings LLC - Key offerings
- SWOT
- 15.7 BAE Systems Plc
- BAE Systems Plc - Overview
- BAE Systems Plc - Business segments
- BAE Systems Plc - Key news
- BAE Systems Plc - Key offerings
- BAE Systems Plc - Segment focus
- SWOT
- 15.8 Canadian Armour Ltd.
- Canadian Armour Ltd. - Overview
- Canadian Armour Ltd. - Product / Service
- Canadian Armour Ltd. - Key offerings
- SWOT
- 15.9 Craig International Ballistics Pty. Ltd.
- Craig International Ballistics Pty. Ltd. - Overview
- Craig International Ballistics Pty. Ltd. - Product / Service
- Craig International Ballistics Pty. Ltd. - Key offerings
- SWOT
- 15.10 DFNDR Armor
- DFNDR Armor - Overview
- DFNDR Armor - Product / Service
- DFNDR Armor - Key offerings
- SWOT
- 15.11 DuPont de Nemours Inc.
- DuPont de Nemours Inc. - Overview
- DuPont de Nemours Inc. - Business segments
- DuPont de Nemours Inc. - Key news
- DuPont de Nemours Inc. - Key offerings
- DuPont de Nemours Inc. - Segment focus
- SWOT
- 15.12 Hellweg International Pty Ltd.
- Hellweg International Pty Ltd. - Overview
- Hellweg International Pty Ltd. - Product / Service
- Hellweg International Pty Ltd. - Key offerings
- SWOT
- 15.13 Hoplite Armor LLC
- Hoplite Armor LLC - Overview
- Hoplite Armor LLC - Product / Service
- Hoplite Armor LLC - Key offerings
- SWOT
- 15.14 Med Eng Holdings ULC
- Med Eng Holdings ULC - Overview
- Med Eng Holdings ULC - Product / Service
- Med Eng Holdings ULC - Key offerings
- SWOT
- 15.15 Point Blank Enterprises Inc.
- Point Blank Enterprises Inc. - Overview
- Point Blank Enterprises Inc. - Product / Service
- Point Blank Enterprises Inc. - Key offerings
- SWOT
- 15.16 Spartan Armor Systems
- Spartan Armor Systems - Overview
- Spartan Armor Systems - Product / Service
- Spartan Armor Systems - Key offerings
- SWOT
- 15.17 U.S. ARMOR Corp.
- U.S. ARMOR Corp. - Overview
- U.S. ARMOR Corp. - Product / Service
- U.S. ARMOR Corp. - Key offerings
- SWOT
- 15.18 United Shield International LLC
- United Shield International LLC - Overview
- United Shield International LLC - Product / Service
- United Shield International LLC - Key offerings
- SWOT
16 Appendix
- 16.1 Scope of the report
- 16.2 Inclusions and exclusions checklist
- Inclusions checklist
- Exclusions checklist
- 16.3 Currency conversion rates for US$
- Currency conversion rates for US$
- 16.4 Research methodology
- Research methodology
- 16.5 Data procurement
- Information sources
- 16.6 Data validation
- Data validation
- 16.7 Validation techniques employed for market sizing
- Validation techniques employed for market sizing
- 16.8 Data synthesis
- Data synthesis
- 16.9 360 degree market analysis
- 360 degree market analysis
- 16.10 List of abbreviations
- List of abbreviations

