|
|
市場調査レポート
商品コード
1515958
生殖補助医療(ART)の世界市場 2024-2028Global assisted reproductive technology (ART) market 2024-2028 |
||||||

|
|||||||
カスタマイズ可能
|
|||||||

| 生殖補助医療(ART)の世界市場 2024-2028 |
|
出版日: 2024年06月11日
発行: TechNavio
ページ情報: 英文 168 Pages
納期: 即納可能
|

全表示
- 概要
- 図表
- 目次
生殖補助医療(ART)市場は2023-2028年に62億9,530万米ドル、予測期間中のCAGRは4.36%で成長すると予測されます。
当レポートでは、生殖補助医療(ART)市場の全体的な分析、市場規模・予測、動向、成長促進要因、課題、約25のベンダーを網羅したベンダー分析などを掲載しています。
現在の市場シナリオ、最新動向と促進要因、市場環境全体に関する最新分析を提供しています。市場を牽引するのは、不妊症や肥満関連症例の増加、芸術に対する意識の高まり、消費者の所得水準の上昇などです。
| 市場範囲 | |
|---|---|
| 基準年 | 2024 |
| 終了年 | 2028 |
| 予測期間 | 2024-2028 |
| 成長モメンタム | 加速 |
| 前年比2024年 | 4.11% |
| CAGR | 4.36% |
| 増分額 | 62億9,530万米ドル |
本調査では、今後数年間の生殖補助医療(ART)市場成長を牽引する主な要因として、ひとり親家庭の増加を挙げています。また、初回妊娠年齢の上昇と戦略的イニシアチブの普及は、市場の大きな需要につながります。
目次
第1章 エグゼクティブサマリー
- 市場概要
第2章 市場情勢
- 市場エコシステム
- 市場の特徴
- バリューチェーン分析
第3章 市場規模の評価
- 市場の定義
- 市場セグメント分析
- 市場規模 2023
- 市場の見通し 2023-2028
第4章 市場規模実績
- 世界生殖補助医療(ART)市場 2018-2022
- 用途別セグメント分析 2018-2022
- タイプ別セグメント分析 2018-2022
- 地域別セグメント分析 2018-2022
- 国別セグメント分析 2018-2022
第5章 ファイブフォース分析
- ファイブフォースの要約
- 買い手の交渉力
- 供給企業の交渉力
- 新規参入業者の脅威
- 代替品の脅威
- 競争の脅威
- 市況
第6章 市場セグメンテーション:用途別
- 市場セグメンテーション
- 比較:用途別
- 不妊治療クリニック:市場規模と予測 2023-2028
- 病院:市場規模と予測 2023-2028
- その他:市場規模と予測 2023-2028
- 市場機会:用途別
第7章 市場セグメンテーション:タイプ別
- 市場セグメンテーション
- 比較:タイプ別
- 体外受精:市場規模と予測 2023-2028
- 人工授精:市場規模と予測 2023-2028
- 市場機会:タイプ別
第8章 顧客情勢
- 顧客情勢の概要
第9章 地域別情勢
- 地域別セグメンテーション
- 地域別比較
- 欧州:市場規模と予測 2023-2028
- 北米:市場規模と予測 2023-2028
- アジア:市場規模と予測 2023-2028
- 世界のその他の地域:市場規模と予測 2023-2028
- 米国:市場規模と予測 2023-2028
- 英国:市場規模と予測 2023-2028
- 中国:市場規模と予測 2023-2028
- ドイツ:市場規模と予測 2023-2028
- 日本:市場規模と予測 2023-2028
- 市場機会:地域情勢別
第10章 促進要因・課題・機会・抑制要因
- 市場促進要因
- 市場の課題
- 促進要因と課題の影響
- 市場の機会・抑制要因
第11章 競合情勢
- 概要
- 競合情勢
- 混乱の状況
- 業界のリスク
第12章 競合分析
- 企業プロファイル
- 企業の市場ポジショニング
- Cook Group Inc.
- CRITEX GmbH
- Cryolab Ltd.
- Esco Micro Pte. Ltd.
- Ferring BV
- FUJIFILM Holdings Corp.
- Genea Ltd.
- IMV Technologies
- Instituto Bernabeu SL
- INVO Bioscience Inc.
- Merck KGaA
- Monash IVF Group Ltd.
- The Cooper Companies Inc.
- Virtus Health
- Vitrolife AB
第13章 付録
Exhibits:
- Exhibits1: Executive Summary - Chart on Market Overview
- Exhibits2: Executive Summary - Data Table on Market Overview
- Exhibits3: Executive Summary - Chart on Global Market Characteristics
- Exhibits4: Executive Summary - Chart on Market By Geographical Landscape
- Exhibits5: Executive Summary - Chart on Market Segmentation by Application
- Exhibits6: Executive Summary - Chart on Market Segmentation by Type
- Exhibits7: Executive Summary - Chart on Incremental Growth
- Exhibits8: Executive Summary - Data Table on Incremental Growth
- Exhibits9: Executive Summary - Chart on Company Market Positioning
- Exhibits10: Parent Market
- Exhibits11: Data Table on - Parent Market
- Exhibits12: Market characteristics analysis
- Exhibits13: Value Chain Analysis
- Exhibits14: Offerings of companies included in the market definition
- Exhibits15: Market segments
- Exhibits16: Chart on Global - Market size and forecast 2023-2028 ($ million)
- Exhibits17: Data Table on Global - Market size and forecast 2023-2028 ($ million)
- Exhibits18: Chart on Global Market: Year-over-year growth 2023-2028 (%)
- Exhibits19: Data Table on Global Market: Year-over-year growth 2023-2028 (%)
- Exhibits20: Historic Market Size - Data Table on Global Assisted Reproductive Technology (ART) Market 2018 - 2022 ($ million)
- Exhibits21: Historic Market Size - Application Segment 2018 - 2022 ($ million)
- Exhibits22: Historic Market Size - Type Segment 2018 - 2022 ($ million)
- Exhibits23: Historic Market Size - Geography Segment 2018 - 2022 ($ million)
- Exhibits24: Historic Market Size - Country Segment 2018 - 2022 ($ million)
- Exhibits25: Five forces analysis - Comparison between 2023 and 2028
- Exhibits26: Bargaining power of buyers - Impact of key factors 2023 and 2028
- Exhibits27: Bargaining power of suppliers - Impact of key factors in 2023 and 2028
- Exhibits28: Threat of new entrants - Impact of key factors in 2023 and 2028
- Exhibits29: Threat of substitutes - Impact of key factors in 2023 and 2028
- Exhibits30: Threat of rivalry - Impact of key factors in 2023 and 2028
- Exhibits31: Chart on Market condition - Five forces 2023 and 2028
- Exhibits32: Chart on Application - Market share 2023-2028 (%)
- Exhibits33: Data Table on Application - Market share 2023-2028 (%)
- Exhibits34: Chart on Comparison by Application
- Exhibits35: Data Table on Comparison by Application
- Exhibits36: Chart on Fertility clinics - Market size and forecast 2023-2028 ($ million)
- Exhibits37: Data Table on Fertility clinics - Market size and forecast 2023-2028 ($ million)
- Exhibits38: Chart on Fertility clinics - Year-over-year growth 2023-2028 (%)
- Exhibits39: Data Table on Fertility clinics - Year-over-year growth 2023-2028 (%)
- Exhibits40: Chart on Hospitals - Market size and forecast 2023-2028 ($ million)
- Exhibits41: Data Table on Hospitals - Market size and forecast 2023-2028 ($ million)
- Exhibits42: Chart on Hospitals - Year-over-year growth 2023-2028 (%)
- Exhibits43: Data Table on Hospitals - Year-over-year growth 2023-2028 (%)
- Exhibits44: Chart on Others - Market size and forecast 2023-2028 ($ million)
- Exhibits45: Data Table on Others - Market size and forecast 2023-2028 ($ million)
- Exhibits46: Chart on Others - Year-over-year growth 2023-2028 (%)
- Exhibits47: Data Table on Others - Year-over-year growth 2023-2028 (%)
- Exhibits48: Market opportunity by Application ($ million)
- Exhibits49: Data Table on Market opportunity by Application ($ million)
- Exhibits50: Chart on Type - Market share 2023-2028 (%)
- Exhibits51: Data Table on Type - Market share 2023-2028 (%)
- Exhibits52: Chart on Comparison by Type
- Exhibits53: Data Table on Comparison by Type
- Exhibits54: Chart on IVF - Market size and forecast 2023-2028 ($ million)
- Exhibits55: Data Table on IVF - Market size and forecast 2023-2028 ($ million)
- Exhibits56: Chart on IVF - Year-over-year growth 2023-2028 (%)
- Exhibits57: Data Table on IVF - Year-over-year growth 2023-2028 (%)
- Exhibits58: Chart on Artificial insemination - Market size and forecast 2023-2028 ($ million)
- Exhibits59: Data Table on Artificial insemination - Market size and forecast 2023-2028 ($ million)
- Exhibits60: Chart on Artificial insemination - Year-over-year growth 2023-2028 (%)
- Exhibits61: Data Table on Artificial insemination - Year-over-year growth 2023-2028 (%)
- Exhibits62: Market opportunity by Type ($ million)
- Exhibits63: Data Table on Market opportunity by Type ($ million)
- Exhibits64: Analysis of price sensitivity, lifecycle, customer purchase basket, adoption rates, and purchase criteria
- Exhibits65: Chart on Market share By Geographical Landscape 2023-2028 (%)
- Exhibits66: Data Table on Market share By Geographical Landscape 2023-2028 (%)
- Exhibits67: Chart on Geographic comparison
- Exhibits68: Data Table on Geographic comparison
- Exhibits69: Chart on Europe - Market size and forecast 2023-2028 ($ million)
- Exhibits70: Data Table on Europe - Market size and forecast 2023-2028 ($ million)
- Exhibits71: Chart on Europe - Year-over-year growth 2023-2028 (%)
- Exhibits72: Data Table on Europe - Year-over-year growth 2023-2028 (%)
- Exhibits73: Chart on North America - Market size and forecast 2023-2028 ($ million)
- Exhibits74: Data Table on North America - Market size and forecast 2023-2028 ($ million)
- Exhibits75: Chart on North America - Year-over-year growth 2023-2028 (%)
- Exhibits76: Data Table on North America - Year-over-year growth 2023-2028 (%)
- Exhibits77: Chart on Asia - Market size and forecast 2023-2028 ($ million)
- Exhibits78: Data Table on Asia - Market size and forecast 2023-2028 ($ million)
- Exhibits79: Chart on Asia - Year-over-year growth 2023-2028 (%)
- Exhibits80: Data Table on Asia - Year-over-year growth 2023-2028 (%)
- Exhibits81: Chart on Rest of World (ROW) - Market size and forecast 2023-2028 ($ million)
- Exhibits82: Data Table on Rest of World (ROW) - Market size and forecast 2023-2028 ($ million)
- Exhibits83: Chart on Rest of World (ROW) - Year-over-year growth 2023-2028 (%)
- Exhibits84: Data Table on Rest of World (ROW) - Year-over-year growth 2023-2028 (%)
- Exhibits85: Chart on US - Market size and forecast 2023-2028 ($ million)
- Exhibits86: Data Table on US - Market size and forecast 2023-2028 ($ million)
- Exhibits87: Chart on US - Year-over-year growth 2023-2028 (%)
- Exhibits88: Data Table on US - Year-over-year growth 2023-2028 (%)
- Exhibits89: Chart on UK - Market size and forecast 2023-2028 ($ million)
- Exhibits90: Data Table on UK - Market size and forecast 2023-2028 ($ million)
- Exhibits91: Chart on UK - Year-over-year growth 2023-2028 (%)
- Exhibits92: Data Table on UK - Year-over-year growth 2023-2028 (%)
- Exhibits93: Chart on China - Market size and forecast 2023-2028 ($ million)
- Exhibits94: Data Table on China - Market size and forecast 2023-2028 ($ million)
- Exhibits95: Chart on China - Year-over-year growth 2023-2028 (%)
- Exhibits96: Data Table on China - Year-over-year growth 2023-2028 (%)
- Exhibits97: Chart on Germany - Market size and forecast 2023-2028 ($ million)
- Exhibits98: Data Table on Germany - Market size and forecast 2023-2028 ($ million)
- Exhibits99: Chart on Germany - Year-over-year growth 2023-2028 (%)
- Exhibits100: Data Table on Germany - Year-over-year growth 2023-2028 (%)
- Exhibits101: Chart on Japan - Market size and forecast 2023-2028 ($ million)
- Exhibits102: Data Table on Japan - Market size and forecast 2023-2028 ($ million)
- Exhibits103: Chart on Japan - Year-over-year growth 2023-2028 (%)
- Exhibits104: Data Table on Japan - Year-over-year growth 2023-2028 (%)
- Exhibits105: Market opportunity By Geographical Landscape ($ million)
- Exhibits106: Data Tables on Market opportunity By Geographical Landscape ($ million)
- Exhibits107: Impact of drivers and challenges in 2023 and 2028
- Exhibits108: Overview on criticality of inputs and factors of differentiation
- Exhibits109: Overview on factors of disruption
- Exhibits110: Impact of key risks on business
- Exhibits111: Companies covered
- Exhibits112: Matrix on companies position and classification
- Exhibits113: Cook Group Inc. - Overview
- Exhibits114: Cook Group Inc. - Product / Service
- Exhibits115: Cook Group Inc. - Key news
- Exhibits116: Cook Group Inc. - Key offerings
- Exhibits117: CRITEX GmbH - Overview
- Exhibits118: CRITEX GmbH - Product / Service
- Exhibits119: CRITEX GmbH - Key offerings
- Exhibits120: Cryolab Ltd. - Overview
- Exhibits121: Cryolab Ltd. - Product / Service
- Exhibits122: Cryolab Ltd. - Key offerings
- Exhibits123: Esco Micro Pte. Ltd. - Overview
- Exhibits124: Esco Micro Pte. Ltd. - Product / Service
- Exhibits125: Esco Micro Pte. Ltd. - Key offerings
- Exhibits126: Ferring BV - Overview
- Exhibits127: Ferring BV - Product / Service
- Exhibits128: Ferring BV - Key news
- Exhibits129: Ferring BV - Key offerings
- Exhibits130: FUJIFILM Holdings Corp. - Overview
- Exhibits131: FUJIFILM Holdings Corp. - Business segments
- Exhibits132: FUJIFILM Holdings Corp. - Key news
- Exhibits133: FUJIFILM Holdings Corp. - Key offerings
- Exhibits134: FUJIFILM Holdings Corp. - Segment focus
- Exhibits135: Genea Ltd. - Overview
- Exhibits136: Genea Ltd. - Product / Service
- Exhibits137: Genea Ltd. - Key offerings
- Exhibits138: IMV Technologies - Overview
- Exhibits139: IMV Technologies - Product / Service
- Exhibits140: IMV Technologies - Key offerings
- Exhibits141: Instituto Bernabeu SL - Overview
- Exhibits142: Instituto Bernabeu SL - Product / Service
- Exhibits143: Instituto Bernabeu SL - Key offerings
- Exhibits144: INVO Bioscience Inc. - Overview
- Exhibits145: INVO Bioscience Inc. - Product / Service
- Exhibits146: INVO Bioscience Inc. - Key news
- Exhibits147: INVO Bioscience Inc. - Key offerings
- Exhibits148: Merck KGaA - Overview
- Exhibits149: Merck KGaA - Business segments
- Exhibits150: Merck KGaA - Key news
- Exhibits151: Merck KGaA - Key offerings
- Exhibits152: Merck KGaA - Segment focus
- Exhibits153: Monash IVF Group Ltd. - Overview
- Exhibits154: Monash IVF Group Ltd. - Business segments
- Exhibits155: Monash IVF Group Ltd. - Key news
- Exhibits156: Monash IVF Group Ltd. - Key offerings
- Exhibits157: Monash IVF Group Ltd. - Segment focus
- Exhibits158: The Cooper Companies Inc. - Overview
- Exhibits159: The Cooper Companies Inc. - Business segments
- Exhibits160: The Cooper Companies Inc. - Key news
- Exhibits161: The Cooper Companies Inc. - Key offerings
- Exhibits162: The Cooper Companies Inc. - Segment focus
- Exhibits163: Virtus Health - Overview
- Exhibits164: Virtus Health - Business segments
- Exhibits165: Virtus Health - Key offerings
- Exhibits166: Virtus Health - Segment focus
- Exhibits167: Vitrolife AB - Overview
- Exhibits168: Vitrolife AB - Business segments
- Exhibits169: Vitrolife AB - Key news
- Exhibits170: Vitrolife AB - Key offerings
- Exhibits171: Vitrolife AB - Segment focus
- Exhibits172: Inclusions checklist
- Exhibits173: Exclusions checklist
- Exhibits174: Currency conversion rates for US$
- Exhibits175: Research methodology
- Exhibits176: Information sources
- Exhibits177: Data validation
- Exhibits178: Validation techniques employed for market sizing
- Exhibits179: Data synthesis
- Exhibits180: 360 degree market analysis
- Exhibits181: List of abbreviations
The assisted reproductive technology (ART) market is forecasted to grow by USD 6295.3 mn during 2023-2028, accelerating at a CAGR of 4.36% during the forecast period. The report on the assisted reproductive technology (ART) market provides a holistic analysis, market size and forecast, trends, growth drivers, and challenges, as well as vendor analysis covering around 25 vendors.
The report offers an up-to-date analysis regarding the current market scenario, the latest trends and drivers, and the overall market environment. The market is driven by increase in rate of infertility and obesity-related cases, increase in awareness of art, and rise in income level of consumers.
Technavio's assisted reproductive technology (ART) market is segmented as below:
| Market Scope | |
|---|---|
| Base Year | 2024 |
| End Year | 2028 |
| Series Year | 2024-2028 |
| Growth Momentum | Accelerate |
| YOY 2024 | 4.11% |
| CAGR | 4.36% |
| Incremental Value | $6295.3mn |
By Application
- Fertility clinics
- Hospitals
- Others
By Type
- IVF
- Artificial insemination
By Geographical Landscape
- Europe
- North America
- Asia
- Rest of World (ROW)
This study identifies the increasing number of single-parent families as one of the prime reasons driving the assisted reproductive technology (ART) market growth during the next few years. Also, rising first-time pregnancy age and proliferation of strategic initiatives will lead to sizable demand in the market.
The report on the assisted reproductive technology (ART) market covers the following areas:
- Assisted reproductive technology (ART) market sizing
- Assisted reproductive technology (ART) market forecast
- Assisted reproductive technology (ART) market industry analysis
The robust vendor analysis is designed to help clients improve their market position, and in line with this, this report provides a detailed analysis of several leading assisted reproductive technology (ART) market vendors that include Cook Group Inc., CRITEX GmbH, Cryolab Ltd., Esco Micro Pte. Ltd., Ferring BV, FUJIFILM Holdings Corp., Genea Ltd., Hamilton Thorne Ltd, IMV Technologies, Instituto Bernabeu SL, INVO Bioscience Inc., KITAZATO Corp., Merck KGaA, Monash IVF Group Ltd., Pantec Engineering AG, Smiths Group Plc, The Cooper Companies Inc., Virtus Health, Vitrolife AB, and XiltriX International. Also, the assisted reproductive technology (ART) market analysis report includes information on upcoming trends and challenges that will influence market growth. This is to help companies strategize and leverage all forthcoming growth opportunities.
The study was conducted using an objective combination of primary and secondary information including inputs from key participants in the industry. The report contains a comprehensive market and vendor landscape in addition to an analysis of the key vendors.
The publisher presents a detailed picture of the market by the way of study, synthesis, and summation of data from multiple sources by an analysis of key parameters such as profit, pricing, competition, and promotions. It presents various market facets by identifying the key industry influencers. The data presented is comprehensive, reliable, and a result of extensive research - both primary and secondary. The market research reports provide a complete competitive landscape and an in-depth vendor selection methodology and analysis using qualitative and quantitative research to forecast the accurate market growth.
Table of Contents
1 Executive Summary
- 1.1 Market overview
- Executive Summary - Chart on Market Overview
- Executive Summary - Data Table on Market Overview
- Executive Summary - Chart on Global Market Characteristics
- Executive Summary - Chart on Market By Geographical Landscape
- Executive Summary - Chart on Market Segmentation by Application
- Executive Summary - Chart on Market Segmentation by Type
- Executive Summary - Chart on Incremental Growth
- Executive Summary - Data Table on Incremental Growth
- Executive Summary - Chart on Company Market Positioning
2 Market Landscape
- 2.1 Market ecosystem
- Parent Market
- Data Table on - Parent Market
- 2.2 Market characteristics
- Market characteristics analysis
- 2.3 Value chain analysis
- Value Chain Analysis
3 Market Sizing
- 3.1 Market definition
- Offerings of companies included in the market definition
- 3.2 Market segment analysis
- Market segments
- 3.3 Market size 2023
- 3.4 Market outlook: Forecast for 2023-2028
- Chart on Global - Market size and forecast 2023-2028 ($ million)
- Data Table on Global - Market size and forecast 2023-2028 ($ million)
- Chart on Global Market: Year-over-year growth 2023-2028 (%)
- Data Table on Global Market: Year-over-year growth 2023-2028 (%)
4 Historic Market Size
- 4.1 Global Assisted Reproductive Technology (ART) Market 2018 - 2022
- Historic Market Size - Data Table on Global Assisted Reproductive Technology (ART) Market 2018 - 2022 ($ million)
- 4.2 Application segment analysis 2018 - 2022
- Historic Market Size - Application Segment 2018 - 2022 ($ million)
- 4.3 Type segment analysis 2018 - 2022
- Historic Market Size - Type Segment 2018 - 2022 ($ million)
- 4.4 Geography segment analysis 2018 - 2022
- Historic Market Size - Geography Segment 2018 - 2022 ($ million)
- 4.5 Country segment analysis 2018 - 2022
- Historic Market Size - Country Segment 2018 - 2022 ($ million)
5 Five Forces Analysis
- 5.1 Five forces summary
- Five forces analysis - Comparison between 2023 and 2028
- 5.2 Bargaining power of buyers
- Bargaining power of buyers - Impact of key factors 2023 and 2028
- 5.3 Bargaining power of suppliers
- Bargaining power of suppliers - Impact of key factors in 2023 and 2028
- 5.4 Threat of new entrants
- Threat of new entrants - Impact of key factors in 2023 and 2028
- 5.5 Threat of substitutes
- Threat of substitutes - Impact of key factors in 2023 and 2028
- 5.6 Threat of rivalry
- Threat of rivalry - Impact of key factors in 2023 and 2028
- 5.7 Market condition
- Chart on Market condition - Five forces 2023 and 2028
6 Market Segmentation by Application
- 6.1 Market segments
- Chart on Application - Market share 2023-2028 (%)
- Data Table on Application - Market share 2023-2028 (%)
- 6.2 Comparison by Application
- Chart on Comparison by Application
- Data Table on Comparison by Application
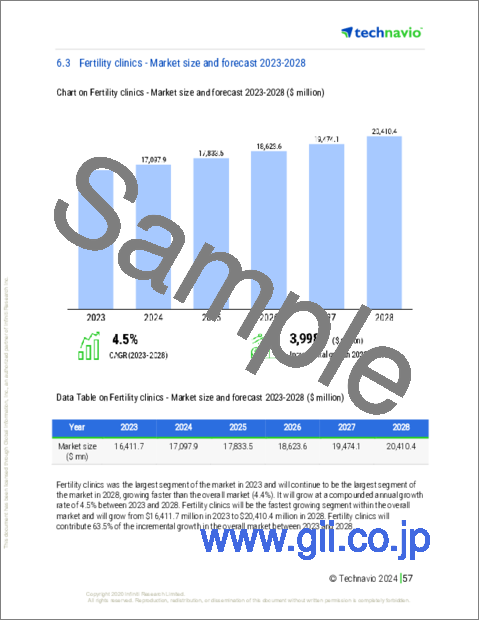
- 6.3 Fertility clinics - Market size and forecast 2023-2028
- Chart on Fertility clinics - Market size and forecast 2023-2028 ($ million)
- Data Table on Fertility clinics - Market size and forecast 2023-2028 ($ million)
- Chart on Fertility clinics - Year-over-year growth 2023-2028 (%)
- Data Table on Fertility clinics - Year-over-year growth 2023-2028 (%)
- 6.4 Hospitals - Market size and forecast 2023-2028
- Chart on Hospitals - Market size and forecast 2023-2028 ($ million)
- Data Table on Hospitals - Market size and forecast 2023-2028 ($ million)
- Chart on Hospitals - Year-over-year growth 2023-2028 (%)
- Data Table on Hospitals - Year-over-year growth 2023-2028 (%)
- 6.5 Others - Market size and forecast 2023-2028
- Chart on Others - Market size and forecast 2023-2028 ($ million)
- Data Table on Others - Market size and forecast 2023-2028 ($ million)
- Chart on Others - Year-over-year growth 2023-2028 (%)
- Data Table on Others - Year-over-year growth 2023-2028 (%)
- 6.6 Market opportunity by Application
- Market opportunity by Application ($ million)
- Data Table on Market opportunity by Application ($ million)
7 Market Segmentation by Type
- 7.1 Market segments
- Chart on Type - Market share 2023-2028 (%)
- Data Table on Type - Market share 2023-2028 (%)
- 7.2 Comparison by Type
- Chart on Comparison by Type
- Data Table on Comparison by Type
- 7.3 IVF - Market size and forecast 2023-2028
- Chart on IVF - Market size and forecast 2023-2028 ($ million)
- Data Table on IVF - Market size and forecast 2023-2028 ($ million)
- Chart on IVF - Year-over-year growth 2023-2028 (%)
- Data Table on IVF - Year-over-year growth 2023-2028 (%)
- 7.4 Artificial insemination - Market size and forecast 2023-2028
- Chart on Artificial insemination - Market size and forecast 2023-2028 ($ million)
- Data Table on Artificial insemination - Market size and forecast 2023-2028 ($ million)
- Chart on Artificial insemination - Year-over-year growth 2023-2028 (%)
- Data Table on Artificial insemination - Year-over-year growth 2023-2028 (%)
- 7.5 Market opportunity by Type
- Market opportunity by Type ($ million)
- Data Table on Market opportunity by Type ($ million)
8 Customer Landscape
- 8.1 Customer landscape overview
- Analysis of price sensitivity, lifecycle, customer purchase basket, adoption rates, and purchase criteria
9 Geographic Landscape
- 9.1 Geographic segmentation
- Chart on Market share By Geographical Landscape 2023-2028 (%)
- Data Table on Market share By Geographical Landscape 2023-2028 (%)
- 9.2 Geographic comparison
- Chart on Geographic comparison
- Data Table on Geographic comparison
- 9.3 Europe - Market size and forecast 2023-2028
- Chart on Europe - Market size and forecast 2023-2028 ($ million)
- Data Table on Europe - Market size and forecast 2023-2028 ($ million)
- Chart on Europe - Year-over-year growth 2023-2028 (%)
- Data Table on Europe - Year-over-year growth 2023-2028 (%)
- 9.4 North America - Market size and forecast 2023-2028
- Chart on North America - Market size and forecast 2023-2028 ($ million)
- Data Table on North America - Market size and forecast 2023-2028 ($ million)
- Chart on North America - Year-over-year growth 2023-2028 (%)
- Data Table on North America - Year-over-year growth 2023-2028 (%)
- 9.5 Asia - Market size and forecast 2023-2028
- Chart on Asia - Market size and forecast 2023-2028 ($ million)
- Data Table on Asia - Market size and forecast 2023-2028 ($ million)
- Chart on Asia - Year-over-year growth 2023-2028 (%)
- Data Table on Asia - Year-over-year growth 2023-2028 (%)
- 9.6 Rest of World (ROW) - Market size and forecast 2023-2028
- Chart on Rest of World (ROW) - Market size and forecast 2023-2028 ($ million)
- Data Table on Rest of World (ROW) - Market size and forecast 2023-2028 ($ million)
- Chart on Rest of World (ROW) - Year-over-year growth 2023-2028 (%)
- Data Table on Rest of World (ROW) - Year-over-year growth 2023-2028 (%)
- 9.7 US - Market size and forecast 2023-2028
- Chart on US - Market size and forecast 2023-2028 ($ million)
- Data Table on US - Market size and forecast 2023-2028 ($ million)
- Chart on US - Year-over-year growth 2023-2028 (%)
- Data Table on US - Year-over-year growth 2023-2028 (%)
- 9.8 UK - Market size and forecast 2023-2028
- Chart on UK - Market size and forecast 2023-2028 ($ million)
- Data Table on UK - Market size and forecast 2023-2028 ($ million)
- Chart on UK - Year-over-year growth 2023-2028 (%)
- Data Table on UK - Year-over-year growth 2023-2028 (%)
- 9.9 China - Market size and forecast 2023-2028
- Chart on China - Market size and forecast 2023-2028 ($ million)
- Data Table on China - Market size and forecast 2023-2028 ($ million)
- Chart on China - Year-over-year growth 2023-2028 (%)
- Data Table on China - Year-over-year growth 2023-2028 (%)
- 9.10 Germany - Market size and forecast 2023-2028
- Chart on Germany - Market size and forecast 2023-2028 ($ million)
- Data Table on Germany - Market size and forecast 2023-2028 ($ million)
- Chart on Germany - Year-over-year growth 2023-2028 (%)
- Data Table on Germany - Year-over-year growth 2023-2028 (%)
- 9.11 Japan - Market size and forecast 2023-2028
- Chart on Japan - Market size and forecast 2023-2028 ($ million)
- Data Table on Japan - Market size and forecast 2023-2028 ($ million)
- Chart on Japan - Year-over-year growth 2023-2028 (%)
- Data Table on Japan - Year-over-year growth 2023-2028 (%)
- 9.12 Market opportunity By Geographical Landscape
- Market opportunity By Geographical Landscape ($ million)
- Data Tables on Market opportunity By Geographical Landscape ($ million)
10 Drivers, Challenges, and Opportunity/Restraints
- 10.1 Market drivers
- 10.2 Market challenges
- 10.3 Impact of drivers and challenges
- Impact of drivers and challenges in 2023 and 2028
- 10.4 Market opportunities/restraints
11 Competitive Landscape
- 11.1 Overview
- 11.2 Competitive Landscape
- Overview on criticality of inputs and factors of differentiation
- 11.3 Landscape disruption
- Overview on factors of disruption
- 11.4 Industry risks
- Impact of key risks on business
12 Competitive Analysis
- 12.1 Companies profiled
- Companies covered
- 12.2 Market positioning of companies
- Matrix on companies position and classification
- 12.3 Cook Group Inc.
- Cook Group Inc. - Overview
- Cook Group Inc. - Product / Service
- Cook Group Inc. - Key news
- Cook Group Inc. - Key offerings
- 12.4 CRITEX GmbH
- CRITEX GmbH - Overview
- CRITEX GmbH - Product / Service
- CRITEX GmbH - Key offerings
- 12.5 Cryolab Ltd.
- Cryolab Ltd. - Overview
- Cryolab Ltd. - Product / Service
- Cryolab Ltd. - Key offerings
- 12.6 Esco Micro Pte. Ltd.
- Esco Micro Pte. Ltd. - Overview
- Esco Micro Pte. Ltd. - Product / Service
- Esco Micro Pte. Ltd. - Key offerings
- 12.7 Ferring BV
- Ferring BV - Overview
- Ferring BV - Product / Service
- Ferring BV - Key news
- Ferring BV - Key offerings
- 12.8 FUJIFILM Holdings Corp.
- FUJIFILM Holdings Corp. - Overview
- FUJIFILM Holdings Corp. - Business segments
- FUJIFILM Holdings Corp. - Key news
- FUJIFILM Holdings Corp. - Key offerings
- FUJIFILM Holdings Corp. - Segment focus
- 12.9 Genea Ltd.
- Genea Ltd. - Overview
- Genea Ltd. - Product / Service
- Genea Ltd. - Key offerings
- 12.10 IMV Technologies
- IMV Technologies - Overview
- IMV Technologies - Product / Service
- IMV Technologies - Key offerings
- 12.11 Instituto Bernabeu SL
- Instituto Bernabeu SL - Overview
- Instituto Bernabeu SL - Product / Service
- Instituto Bernabeu SL - Key offerings
- 12.12 INVO Bioscience Inc.
- INVO Bioscience Inc. - Overview
- INVO Bioscience Inc. - Product / Service
- INVO Bioscience Inc. - Key news
- INVO Bioscience Inc. - Key offerings
- 12.13 Merck KGaA
- Merck KGaA - Overview
- Merck KGaA - Business segments
- Merck KGaA - Key news
- Merck KGaA - Key offerings
- Merck KGaA - Segment focus
- 12.14 Monash IVF Group Ltd.
- Monash IVF Group Ltd. - Overview
- Monash IVF Group Ltd. - Business segments
- Monash IVF Group Ltd. - Key news
- Monash IVF Group Ltd. - Key offerings
- Monash IVF Group Ltd. - Segment focus
- 12.15 The Cooper Companies Inc.
- The Cooper Companies Inc. - Overview
- The Cooper Companies Inc. - Business segments
- The Cooper Companies Inc. - Key news
- The Cooper Companies Inc. - Key offerings
- The Cooper Companies Inc. - Segment focus
- 12.16 Virtus Health
- Virtus Health - Overview
- Virtus Health - Business segments
- Virtus Health - Key offerings
- Virtus Health - Segment focus
- 12.17 Vitrolife AB
- Vitrolife AB - Overview
- Vitrolife AB - Business segments
- Vitrolife AB - Key news
- Vitrolife AB - Key offerings
- Vitrolife AB - Segment focus
13 Appendix
- 13.1 Scope of the report
- 13.2 Inclusions and exclusions checklist
- Inclusions checklist
- Exclusions checklist
- 13.3 Currency conversion rates for US$
- Currency conversion rates for US$
- 13.4 Research methodology
- Research methodology
- 13.5 Data procurement
- Information sources
- 13.6 Data validation
- Data validation
- 13.7 Validation techniques employed for market sizing
- Validation techniques employed for market sizing
- 13.8 Data synthesis
- Data synthesis
- 13.9 360 degree market analysis
- 360 degree market analysis
- 13.10 List of abbreviations
- List of abbreviations
