|
|
市場調査レポート
商品コード
1515804
抗菌医療用テキスタイルの世界市場 2024-2028Global antimicrobial medical textiles market 2024-2028 |
||||||

|
|||||||
カスタマイズ可能
|
|||||||


| 抗菌医療用テキスタイルの世界市場 2024-2028 |
|
出版日: 2024年06月12日
発行: TechNavio
ページ情報: 英文 176 Pages
納期: 即納可能
|

全表示
- 概要
- 図表
- 目次
抗菌医療用テキスタイル市場は、2023年から2028年にかけて12億6,770万米ドル、予測期間中のCAGRは6.78%で成長すると予測されています。
当レポートでは、抗菌医療用テキスタイル市場の全体的な分析、市場規模・予測、動向、成長促進要因、課題、約25のベンダーを網羅したベンダー分析などを掲載しています。
現在の市場シナリオ、最新動向と促進要因、市場環境全体に関する最新分析を提供しています。市場は、世界のヘルスケア支出の増加、衛生用品への需要の高まり、高齢者人口の拡大によって牽引されています。
| 市場範囲 | |
|---|---|
| 基準年 | 2024 |
| 終了年 | 2028 |
| 予測期間 | 2024-2028 |
| 成長モメンタム | 加速 |
| 前年比2024年 | 6.23% |
| CAGR | 6.78% |
| 増分額 | 12億6,770万米ドル |
本調査では、今後数年間の抗菌医療用テキスタイル市場成長を牽引する主な要因の一つとして、複数回の洗濯や滅菌に耐える医療用テキスタイルの需要を挙げています。また、銀ベースの抗菌テキスタイルの人気の高まりや、在宅ヘルスケアにおける抗菌テキスタイルの使用の増加は、市場の大きな需要につながります。
目次
第1章 エグゼクティブサマリー
- 市場概要
第2章 市場情勢
- 市場エコシステム
- 市場の特徴
- バリューチェーン分析
第3章 市場規模の評価
- 市場の定義
- 市場セグメント分析
- 市場規模 2023
- 市場の見通し 2023-2028
第4章 市場規模実績
- 世界抗菌医療用テキスタイル市場 2018-2022
- 製品別セグメント分析 2018-2022
- 用途別セグメント分析 2018-2022
- 地域別セグメント分析 2018-2022
- 国別セグメント分析 2018-2022
第5章 ファイブフォース分析
- ファイブフォースの要約
- 買い手の交渉力
- 供給企業の交渉力
- 新規参入業者の脅威
- 代替品の脅威
- 競争の脅威
- 市況
第6章 市場セグメンテーション:製品別
- 市場セグメンテーション
- 比較:製品別
- 不織布:市場規模と予測 2023-2028
- 織り布:市場規模と予測 2023-2028
- ニット:市場規模と予測 2023-2028
- 市場機会:製品別
第7章 市場セグメンテーション:用途別
- 市場セグメンテーション
- 比較:用途別
- ヘルスケアおよび衛生製品:市場規模と予測 2023-2028
- 非埋め込み型製品:市場規模と予測 2023-2028
- 埋め込み型製品:市場規模と予測 2023-2028
- 市場機会:用途別
第8章 顧客情勢
- 顧客情勢の概要
第9章 地域別情勢
- 地域別セグメンテーション
- 地域別比較
- 北米:市場規模と予測 2023-2028
- 欧州:市場規模と予測 2023-2028
- アジア太平洋:市場規模と予測 2023-2028
- 南米:市場規模と予測 2023-2028
- 中東・アフリカ:市場規模と予測 2023-2028
- 米国:市場規模と予測 2023-2028
- ドイツ:市場規模と予測 2023-2028
- 中国:市場規模と予測 2023-2028
- 英国:市場規模と予測 2023-2028
- インド:市場規模と予測 2023-2028
- 市場機会:地域情勢別
第10章 促進要因・課題・機会・抑制要因
- 市場促進要因
- 市場の課題
- 促進要因と課題の影響
- 市場の機会・抑制要因
第11章 競合情勢
- 概要
- 競合情勢
- 混乱の状況
- 業界のリスク
第12章 競合分析
- 企業プロファイル
- 企業の市場ポジショニング
- Aditya Birla Management Corp. Pvt. Ltd.
- Baltex
- BASF SE
- BioCote Ltd.
- Dow Chemical Co.
- Herculite Inc.
- Indorama Ventures Public Co. Ltd.
- Integra Lifesciences Corp.
- Milliken and Co.
- Noble Biomaterials Inc.
- PurThread Technologies Inc.
- Sciessent LLC
- Sinanen Holdings Co., Ltd.
- Sono Tek Corp.
- W.M. BARR Co. Inc.
第13章 付録
Exhibits:
- Exhibits1: Executive Summary - Chart on Market Overview
- Exhibits2: Executive Summary - Data Table on Market Overview
- Exhibits3: Executive Summary - Chart on Global Market Characteristics
- Exhibits4: Executive Summary - Chart on Market By Geographical Landscape
- Exhibits5: Executive Summary - Chart on Market Segmentation by Product
- Exhibits6: Executive Summary - Chart on Market Segmentation by Application
- Exhibits7: Executive Summary - Chart on Incremental Growth
- Exhibits8: Executive Summary - Data Table on Incremental Growth
- Exhibits9: Executive Summary - Chart on Company Market Positioning
- Exhibits10: Parent Market
- Exhibits11: Data Table on - Parent Market
- Exhibits12: Market characteristics analysis
- Exhibits13: Value Chain Analysis
- Exhibits14: Offerings of companies included in the market definition
- Exhibits15: Market segments
- Exhibits16: Chart on Global - Market size and forecast 2023-2028 ($ million)
- Exhibits17: Data Table on Global - Market size and forecast 2023-2028 ($ million)
- Exhibits18: Chart on Global Market: Year-over-year growth 2023-2028 (%)
- Exhibits19: Data Table on Global Market: Year-over-year growth 2023-2028 (%)
- Exhibits20: Historic Market Size - Data Table on Global Antimicrobial Medical Textiles Market 2018 - 2022 ($ million)
- Exhibits21: Historic Market Size - Product Segment 2018 - 2022 ($ million)
- Exhibits22: Historic Market Size - Application Segment 2018 - 2022 ($ million)
- Exhibits23: Historic Market Size - Geography Segment 2018 - 2022 ($ million)
- Exhibits24: Historic Market Size - Country Segment 2018 - 2022 ($ million)
- Exhibits25: Five forces analysis - Comparison between 2023 and 2028
- Exhibits26: Bargaining power of buyers - Impact of key factors 2023 and 2028
- Exhibits27: Bargaining power of suppliers - Impact of key factors in 2023 and 2028
- Exhibits28: Threat of new entrants - Impact of key factors in 2023 and 2028
- Exhibits29: Threat of substitutes - Impact of key factors in 2023 and 2028
- Exhibits30: Threat of rivalry - Impact of key factors in 2023 and 2028
- Exhibits31: Chart on Market condition - Five forces 2023 and 2028
- Exhibits32: Chart on Product - Market share 2023-2028 (%)
- Exhibits33: Data Table on Product - Market share 2023-2028 (%)
- Exhibits34: Chart on Comparison by Product
- Exhibits35: Data Table on Comparison by Product
- Exhibits36: Chart on Non-woven - Market size and forecast 2023-2028 ($ million)
- Exhibits37: Data Table on Non-woven - Market size and forecast 2023-2028 ($ million)
- Exhibits38: Chart on Non-woven - Year-over-year growth 2023-2028 (%)
- Exhibits39: Data Table on Non-woven - Year-over-year growth 2023-2028 (%)
- Exhibits40: Chart on Woven - Market size and forecast 2023-2028 ($ million)
- Exhibits41: Data Table on Woven - Market size and forecast 2023-2028 ($ million)
- Exhibits42: Chart on Woven - Year-over-year growth 2023-2028 (%)
- Exhibits43: Data Table on Woven - Year-over-year growth 2023-2028 (%)
- Exhibits44: Chart on Knitted - Market size and forecast 2023-2028 ($ million)
- Exhibits45: Data Table on Knitted - Market size and forecast 2023-2028 ($ million)
- Exhibits46: Chart on Knitted - Year-over-year growth 2023-2028 (%)
- Exhibits47: Data Table on Knitted - Year-over-year growth 2023-2028 (%)
- Exhibits48: Market opportunity by Product ($ million)
- Exhibits49: Data Table on Market opportunity by Product ($ million)
- Exhibits50: Chart on Application - Market share 2023-2028 (%)
- Exhibits51: Data Table on Application - Market share 2023-2028 (%)
- Exhibits52: Chart on Comparison by Application
- Exhibits53: Data Table on Comparison by Application
- Exhibits54: Chart on Healthcare and hygiene products - Market size and forecast 2023-2028 ($ million)
- Exhibits55: Data Table on Healthcare and hygiene products - Market size and forecast 2023-2028 ($ million)
- Exhibits56: Chart on Healthcare and hygiene products - Year-over-year growth 2023-2028 (%)
- Exhibits57: Data Table on Healthcare and hygiene products - Year-over-year growth 2023-2028 (%)
- Exhibits58: Chart on Non-implantable goods - Market size and forecast 2023-2028 ($ million)
- Exhibits59: Data Table on Non-implantable goods - Market size and forecast 2023-2028 ($ million)
- Exhibits60: Chart on Non-implantable goods - Year-over-year growth 2023-2028 (%)
- Exhibits61: Data Table on Non-implantable goods - Year-over-year growth 2023-2028 (%)
- Exhibits62: Chart on Implantable goods - Market size and forecast 2023-2028 ($ million)
- Exhibits63: Data Table on Implantable goods - Market size and forecast 2023-2028 ($ million)
- Exhibits64: Chart on Implantable goods - Year-over-year growth 2023-2028 (%)
- Exhibits65: Data Table on Implantable goods - Year-over-year growth 2023-2028 (%)
- Exhibits66: Market opportunity by Application ($ million)
- Exhibits67: Data Table on Market opportunity by Application ($ million)
- Exhibits68: Analysis of price sensitivity, lifecycle, customer purchase basket, adoption rates, and purchase criteria
- Exhibits69: Chart on Market share By Geographical Landscape 2023-2028 (%)
- Exhibits70: Data Table on Market share By Geographical Landscape 2023-2028 (%)
- Exhibits71: Chart on Geographic comparison
- Exhibits72: Data Table on Geographic comparison
- Exhibits73: Chart on North America - Market size and forecast 2023-2028 ($ million)
- Exhibits74: Data Table on North America - Market size and forecast 2023-2028 ($ million)
- Exhibits75: Chart on North America - Year-over-year growth 2023-2028 (%)
- Exhibits76: Data Table on North America - Year-over-year growth 2023-2028 (%)
- Exhibits77: Chart on Europe - Market size and forecast 2023-2028 ($ million)
- Exhibits78: Data Table on Europe - Market size and forecast 2023-2028 ($ million)
- Exhibits79: Chart on Europe - Year-over-year growth 2023-2028 (%)
- Exhibits80: Data Table on Europe - Year-over-year growth 2023-2028 (%)
- Exhibits81: Chart on APAC - Market size and forecast 2023-2028 ($ million)
- Exhibits82: Data Table on APAC - Market size and forecast 2023-2028 ($ million)
- Exhibits83: Chart on APAC - Year-over-year growth 2023-2028 (%)
- Exhibits84: Data Table on APAC - Year-over-year growth 2023-2028 (%)
- Exhibits85: Chart on South America - Market size and forecast 2023-2028 ($ million)
- Exhibits86: Data Table on South America - Market size and forecast 2023-2028 ($ million)
- Exhibits87: Chart on South America - Year-over-year growth 2023-2028 (%)
- Exhibits88: Data Table on South America - Year-over-year growth 2023-2028 (%)
- Exhibits89: Chart on Middle East and Africa - Market size and forecast 2023-2028 ($ million)
- Exhibits90: Data Table on Middle East and Africa - Market size and forecast 2023-2028 ($ million)
- Exhibits91: Chart on Middle East and Africa - Year-over-year growth 2023-2028 (%)
- Exhibits92: Data Table on Middle East and Africa - Year-over-year growth 2023-2028 (%)
- Exhibits93: Chart on US - Market size and forecast 2023-2028 ($ million)
- Exhibits94: Data Table on US - Market size and forecast 2023-2028 ($ million)
- Exhibits95: Chart on US - Year-over-year growth 2023-2028 (%)
- Exhibits96: Data Table on US - Year-over-year growth 2023-2028 (%)
- Exhibits97: Chart on Germany - Market size and forecast 2023-2028 ($ million)
- Exhibits98: Data Table on Germany - Market size and forecast 2023-2028 ($ million)
- Exhibits99: Chart on Germany - Year-over-year growth 2023-2028 (%)
- Exhibits100: Data Table on Germany - Year-over-year growth 2023-2028 (%)
- Exhibits101: Chart on China - Market size and forecast 2023-2028 ($ million)
- Exhibits102: Data Table on China - Market size and forecast 2023-2028 ($ million)
- Exhibits103: Chart on China - Year-over-year growth 2023-2028 (%)
- Exhibits104: Data Table on China - Year-over-year growth 2023-2028 (%)
- Exhibits105: Chart on UK - Market size and forecast 2023-2028 ($ million)
- Exhibits106: Data Table on UK - Market size and forecast 2023-2028 ($ million)
- Exhibits107: Chart on UK - Year-over-year growth 2023-2028 (%)
- Exhibits108: Data Table on UK - Year-over-year growth 2023-2028 (%)
- Exhibits109: Chart on India - Market size and forecast 2023-2028 ($ million)
- Exhibits110: Data Table on India - Market size and forecast 2023-2028 ($ million)
- Exhibits111: Chart on India - Year-over-year growth 2023-2028 (%)
- Exhibits112: Data Table on India - Year-over-year growth 2023-2028 (%)
- Exhibits113: Market opportunity By Geographical Landscape ($ million)
- Exhibits114: Data Tables on Market opportunity By Geographical Landscape ($ million)
- Exhibits115: Impact of drivers and challenges in 2023 and 2028
- Exhibits116: Overview on criticality of inputs and factors of differentiation
- Exhibits117: Overview on factors of disruption
- Exhibits118: Impact of key risks on business
- Exhibits119: Companies covered
- Exhibits120: Matrix on companies position and classification
- Exhibits121: Aditya Birla Management Corp. Pvt. Ltd. - Overview
- Exhibits122: Aditya Birla Management Corp. Pvt. Ltd. - Product / Service
- Exhibits123: Aditya Birla Management Corp. Pvt. Ltd. - Key news
- Exhibits124: Aditya Birla Management Corp. Pvt. Ltd. - Key offerings
- Exhibits125: Baltex - Overview
- Exhibits126: Baltex - Product / Service
- Exhibits127: Baltex - Key offerings
- Exhibits128: BASF SE - Overview
- Exhibits129: BASF SE - Business segments
- Exhibits130: BASF SE - Key news
- Exhibits131: BASF SE - Key offerings
- Exhibits132: BASF SE - Segment focus
- Exhibits133: BioCote Ltd. - Overview
- Exhibits134: BioCote Ltd. - Product / Service
- Exhibits135: BioCote Ltd. - Key offerings
- Exhibits136: Dow Chemical Co. - Overview
- Exhibits137: Dow Chemical Co. - Business segments
- Exhibits138: Dow Chemical Co. - Key news
- Exhibits139: Dow Chemical Co. - Key offerings
- Exhibits140: Dow Chemical Co. - Segment focus
- Exhibits141: Herculite Inc. - Overview
- Exhibits142: Herculite Inc. - Product / Service
- Exhibits143: Herculite Inc. - Key news
- Exhibits144: Herculite Inc. - Key offerings
- Exhibits145: Indorama Ventures Public Co. Ltd. - Overview
- Exhibits146: Indorama Ventures Public Co. Ltd. - Business segments
- Exhibits147: Indorama Ventures Public Co. Ltd. - Key news
- Exhibits148: Indorama Ventures Public Co. Ltd. - Key offerings
- Exhibits149: Indorama Ventures Public Co. Ltd. - Segment focus
- Exhibits150: Integra Lifesciences Corp. - Overview
- Exhibits151: Integra Lifesciences Corp. - Business segments
- Exhibits152: Integra Lifesciences Corp. - Key news
- Exhibits153: Integra Lifesciences Corp. - Key offerings
- Exhibits154: Integra Lifesciences Corp. - Segment focus
- Exhibits155: Milliken and Co. - Overview
- Exhibits156: Milliken and Co. - Product / Service
- Exhibits157: Milliken and Co. - Key offerings
- Exhibits158: Noble Biomaterials Inc. - Overview
- Exhibits159: Noble Biomaterials Inc. - Product / Service
- Exhibits160: Noble Biomaterials Inc. - Key offerings
- Exhibits161: PurThread Technologies Inc. - Overview
- Exhibits162: PurThread Technologies Inc. - Product / Service
- Exhibits163: PurThread Technologies Inc. - Key offerings
- Exhibits164: Sciessent LLC - Overview
- Exhibits165: Sciessent LLC - Product / Service
- Exhibits166: Sciessent LLC - Key offerings
- Exhibits167: Sinanen Holdings Co., Ltd. - Overview
- Exhibits168: Sinanen Holdings Co., Ltd. - Product / Service
- Exhibits169: Sinanen Holdings Co., Ltd. - Key news
- Exhibits170: Sinanen Holdings Co., Ltd. - Key offerings
- Exhibits171: Sono Tek Corp. - Overview
- Exhibits172: Sono Tek Corp. - Product / Service
- Exhibits173: Sono Tek Corp. - Key news
- Exhibits174: Sono Tek Corp. - Key offerings
- Exhibits175: W.M. BARR Co. Inc. - Overview
- Exhibits176: W.M. BARR Co. Inc. - Product / Service
- Exhibits177: W.M. BARR Co. Inc. - Key offerings
- Exhibits178: Inclusions checklist
- Exhibits179: Exclusions checklist
- Exhibits180: Currency conversion rates for US$
- Exhibits181: Research methodology
- Exhibits182: Information sources
- Exhibits183: Data validation
- Exhibits184: Validation techniques employed for market sizing
- Exhibits185: Data synthesis
- Exhibits186: 360 degree market analysis
- Exhibits187: List of abbreviations
The antimicrobial medical textiles market is forecasted to grow by USD 1267.7 mn during 2023-2028, accelerating at a CAGR of 6.78% during the forecast period. The report on the antimicrobial medical textiles market provides a holistic analysis, market size and forecast, trends, growth drivers, and challenges, as well as vendor analysis covering around 25 vendors.
The report offers an up-to-date analysis regarding the current market scenario, the latest trends and drivers, and the overall market environment. The market is driven by increasing healthcare spending worldwide, growing demand for hygiene products, and expanding elderly population.
Technavio's antimicrobial medical textiles market is segmented as below:
| Market Scope | |
|---|---|
| Base Year | 2024 |
| End Year | 2028 |
| Series Year | 2024-2028 |
| Growth Momentum | Accelerate |
| YOY 2024 | 6.23% |
| CAGR | 6.78% |
| Incremental Value | $1267.7mn |
ByProduct
- Non-woven
- Woven
- Knitted
ByApplication
- Healthcare and hygiene products
- Non-implantable goods
- Implantable goods
ByGeography
- North America
- Europe
- APAC
- South America
- Middle East and Africa
This study identifies the demand for medical textiles that can withstand multiple washing and sterilizations as one of the prime reasons driving the antimicrobial medical textiles market growth during the next few years. Also, growing popularity of silver-based antimicrobial textiles and increasing use of antimicrobial textiles in home healthcare will lead to sizable demand in the market.
The report on the antimicrobial medical textiles market covers the following areas:
- Antimicrobial medical textiles market sizing
- Antimicrobial medical textiles market forecast
- Antimicrobial medical textiles market industry analysis
The robust vendor analysis is designed to help clients improve their market position, and in line with this, this report provides a detailed analysis of several leading antimicrobial medical textiles market vendors that include Aditya Birla Management Corp. Pvt. Ltd., Baltex, BASF SE, BioCote Ltd., Cardinal Health Inc., Dow Chemical Co., Herculite Inc., Indorama Ventures Public Co. Ltd., Integra Lifesciences Corp., KOB GmbH, Milliken and Co., Noble Biomaterials Inc., PurThread Technologies Inc., Sanitized AG, Sciessent LLC, Sinanen Holdings Co., Ltd., Smith and Nephew plc, Sono Tek Corp., Unitika Ltd., W.M. BARR Co. Inc., and Winner Medical Co. Ltd.. Also, the antimicrobial medical textiles market analysis report includes information on upcoming trends and challenges that will influence market growth. This is to help companies strategize and leverage all forthcoming growth opportunities.
The study was conducted using an objective combination of primary and secondary information including inputs from key participants in the industry. The report contains a comprehensive market and vendor landscape in addition to an analysis of the key vendors.
The publisher presents a detailed picture of the market by the way of study, synthesis, and summation of data from multiple sources by an analysis of key parameters such as profit, pricing, competition, and promotions. It presents various market facets by identifying the key industry influencers. The data presented is comprehensive, reliable, and a result of extensive research - both primary and secondary. The market research reports provide a complete competitive landscape and an in-depth vendor selection methodology and analysis using qualitative and quantitative research to forecast the accurate market growth.
Table of Contents
1 Executive Summary
- 1.1 Market overview
- Executive Summary - Chart on Market Overview
- Executive Summary - Data Table on Market Overview
- Executive Summary - Chart on Global Market Characteristics
- Executive Summary - Chart on Market By Geographical Landscape
- Executive Summary - Chart on Market Segmentation by Product
- Executive Summary - Chart on Market Segmentation by Application
- Executive Summary - Chart on Incremental Growth
- Executive Summary - Data Table on Incremental Growth
- Executive Summary - Chart on Company Market Positioning
2 Market Landscape
- 2.1 Market ecosystem
- Parent Market
- Data Table on - Parent Market
- 2.2 Market characteristics
- Market characteristics analysis
- 2.3 Value chain analysis
- Value Chain Analysis
3 Market Sizing
- 3.1 Market definition
- Offerings of companies included in the market definition
- 3.2 Market segment analysis
- Market segments
- 3.3 Market size 2023
- 3.4 Market outlook: Forecast for 2023-2028
- Chart on Global - Market size and forecast 2023-2028 ($ million)
- Data Table on Global - Market size and forecast 2023-2028 ($ million)
- Chart on Global Market: Year-over-year growth 2023-2028 (%)
- Data Table on Global Market: Year-over-year growth 2023-2028 (%)
4 Historic Market Size
- 4.1 Global Antimicrobial Medical Textiles Market 2018 - 2022
- Historic Market Size - Data Table on Global Antimicrobial Medical Textiles Market 2018 - 2022 ($ million)
- 4.2 Product segment analysis 2018 - 2022
- Historic Market Size - Product Segment 2018 - 2022 ($ million)
- 4.3 Application segment analysis 2018 - 2022
- Historic Market Size - Application Segment 2018 - 2022 ($ million)
- 4.4 Geography segment analysis 2018 - 2022
- Historic Market Size - Geography Segment 2018 - 2022 ($ million)
- 4.5 Country segment analysis 2018 - 2022
- Historic Market Size - Country Segment 2018 - 2022 ($ million)
5 Five Forces Analysis
- 5.1 Five forces summary
- Five forces analysis - Comparison between 2023 and 2028
- 5.2 Bargaining power of buyers
- Bargaining power of buyers - Impact of key factors 2023 and 2028
- 5.3 Bargaining power of suppliers
- Bargaining power of suppliers - Impact of key factors in 2023 and 2028
- 5.4 Threat of new entrants
- Threat of new entrants - Impact of key factors in 2023 and 2028
- 5.5 Threat of substitutes
- Threat of substitutes - Impact of key factors in 2023 and 2028
- 5.6 Threat of rivalry
- Threat of rivalry - Impact of key factors in 2023 and 2028
- 5.7 Market condition
- Chart on Market condition - Five forces 2023 and 2028
6 Market Segmentation by Product
- 6.1 Market segments
- Chart on Product - Market share 2023-2028 (%)
- Data Table on Product - Market share 2023-2028 (%)
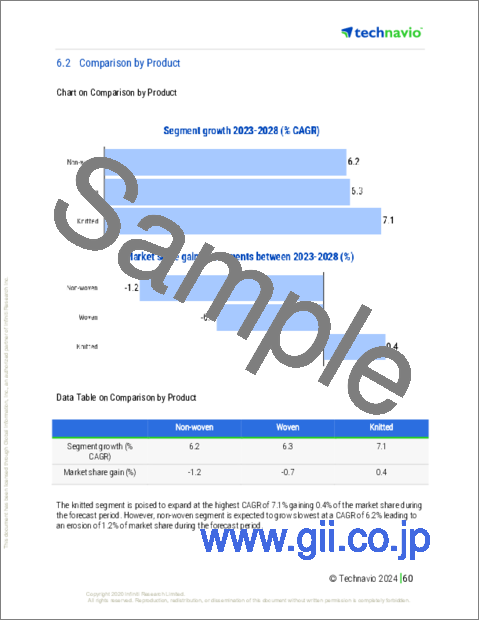
- 6.2 Comparison by Product
- Chart on Comparison by Product
- Data Table on Comparison by Product
- 6.3 Non-woven - Market size and forecast 2023-2028
- Chart on Non-woven - Market size and forecast 2023-2028 ($ million)
- Data Table on Non-woven - Market size and forecast 2023-2028 ($ million)
- Chart on Non-woven - Year-over-year growth 2023-2028 (%)
- Data Table on Non-woven - Year-over-year growth 2023-2028 (%)
- 6.4 Woven - Market size and forecast 2023-2028
- Chart on Woven - Market size and forecast 2023-2028 ($ million)
- Data Table on Woven - Market size and forecast 2023-2028 ($ million)
- Chart on Woven - Year-over-year growth 2023-2028 (%)
- Data Table on Woven - Year-over-year growth 2023-2028 (%)
- 6.5 Knitted - Market size and forecast 2023-2028
- Chart on Knitted - Market size and forecast 2023-2028 ($ million)
- Data Table on Knitted - Market size and forecast 2023-2028 ($ million)
- Chart on Knitted - Year-over-year growth 2023-2028 (%)
- Data Table on Knitted - Year-over-year growth 2023-2028 (%)
- 6.6 Market opportunity by Product
- Market opportunity by Product ($ million)
- Data Table on Market opportunity by Product ($ million)
7 Market Segmentation by Application
- 7.1 Market segments
- Chart on Application - Market share 2023-2028 (%)
- Data Table on Application - Market share 2023-2028 (%)
- 7.2 Comparison by Application
- Chart on Comparison by Application
- Data Table on Comparison by Application
- 7.3 Healthcare and hygiene products - Market size and forecast 2023-2028
- Chart on Healthcare and hygiene products - Market size and forecast 2023-2028 ($ million)
- Data Table on Healthcare and hygiene products - Market size and forecast 2023-2028 ($ million)
- Chart on Healthcare and hygiene products - Year-over-year growth 2023-2028 (%)
- Data Table on Healthcare and hygiene products - Year-over-year growth 2023-2028 (%)
- 7.4 Non-implantable goods - Market size and forecast 2023-2028
- Chart on Non-implantable goods - Market size and forecast 2023-2028 ($ million)
- Data Table on Non-implantable goods - Market size and forecast 2023-2028 ($ million)
- Chart on Non-implantable goods - Year-over-year growth 2023-2028 (%)
- Data Table on Non-implantable goods - Year-over-year growth 2023-2028 (%)
- 7.5 Implantable goods - Market size and forecast 2023-2028
- Chart on Implantable goods - Market size and forecast 2023-2028 ($ million)
- Data Table on Implantable goods - Market size and forecast 2023-2028 ($ million)
- Chart on Implantable goods - Year-over-year growth 2023-2028 (%)
- Data Table on Implantable goods - Year-over-year growth 2023-2028 (%)
- 7.6 Market opportunity by Application
- Market opportunity by Application ($ million)
- Data Table on Market opportunity by Application ($ million)
8 Customer Landscape
- 8.1 Customer landscape overview
- Analysis of price sensitivity, lifecycle, customer purchase basket, adoption rates, and purchase criteria
9 Geographic Landscape
- 9.1 Geographic segmentation
- Chart on Market share By Geographical Landscape 2023-2028 (%)
- Data Table on Market share By Geographical Landscape 2023-2028 (%)
- 9.2 Geographic comparison
- Chart on Geographic comparison
- Data Table on Geographic comparison
- 9.3 North America - Market size and forecast 2023-2028
- Chart on North America - Market size and forecast 2023-2028 ($ million)
- Data Table on North America - Market size and forecast 2023-2028 ($ million)
- Chart on North America - Year-over-year growth 2023-2028 (%)
- Data Table on North America - Year-over-year growth 2023-2028 (%)
- 9.4 Europe - Market size and forecast 2023-2028
- Chart on Europe - Market size and forecast 2023-2028 ($ million)
- Data Table on Europe - Market size and forecast 2023-2028 ($ million)
- Chart on Europe - Year-over-year growth 2023-2028 (%)
- Data Table on Europe - Year-over-year growth 2023-2028 (%)
- 9.5 APAC - Market size and forecast 2023-2028
- Chart on APAC - Market size and forecast 2023-2028 ($ million)
- Data Table on APAC - Market size and forecast 2023-2028 ($ million)
- Chart on APAC - Year-over-year growth 2023-2028 (%)
- Data Table on APAC - Year-over-year growth 2023-2028 (%)
- 9.6 South America - Market size and forecast 2023-2028
- Chart on South America - Market size and forecast 2023-2028 ($ million)
- Data Table on South America - Market size and forecast 2023-2028 ($ million)
- Chart on South America - Year-over-year growth 2023-2028 (%)
- Data Table on South America - Year-over-year growth 2023-2028 (%)
- 9.7 Middle East and Africa - Market size and forecast 2023-2028
- Chart on Middle East and Africa - Market size and forecast 2023-2028 ($ million)
- Data Table on Middle East and Africa - Market size and forecast 2023-2028 ($ million)
- Chart on Middle East and Africa - Year-over-year growth 2023-2028 (%)
- Data Table on Middle East and Africa - Year-over-year growth 2023-2028 (%)
- 9.8 US - Market size and forecast 2023-2028
- Chart on US - Market size and forecast 2023-2028 ($ million)
- Data Table on US - Market size and forecast 2023-2028 ($ million)
- Chart on US - Year-over-year growth 2023-2028 (%)
- Data Table on US - Year-over-year growth 2023-2028 (%)
- 9.9 Germany - Market size and forecast 2023-2028
- Chart on Germany - Market size and forecast 2023-2028 ($ million)
- Data Table on Germany - Market size and forecast 2023-2028 ($ million)
- Chart on Germany - Year-over-year growth 2023-2028 (%)
- Data Table on Germany - Year-over-year growth 2023-2028 (%)
- 9.10 China - Market size and forecast 2023-2028
- Chart on China - Market size and forecast 2023-2028 ($ million)
- Data Table on China - Market size and forecast 2023-2028 ($ million)
- Chart on China - Year-over-year growth 2023-2028 (%)
- Data Table on China - Year-over-year growth 2023-2028 (%)
- 9.11 UK - Market size and forecast 2023-2028
- Chart on UK - Market size and forecast 2023-2028 ($ million)
- Data Table on UK - Market size and forecast 2023-2028 ($ million)
- Chart on UK - Year-over-year growth 2023-2028 (%)
- Data Table on UK - Year-over-year growth 2023-2028 (%)
- 9.12 India - Market size and forecast 2023-2028
- Chart on India - Market size and forecast 2023-2028 ($ million)
- Data Table on India - Market size and forecast 2023-2028 ($ million)
- Chart on India - Year-over-year growth 2023-2028 (%)
- Data Table on India - Year-over-year growth 2023-2028 (%)
- 9.13 Market opportunity By Geographical Landscape
- Market opportunity By Geographical Landscape ($ million)
- Data Tables on Market opportunity By Geographical Landscape ($ million)
10 Drivers, Challenges, and Opportunity/Restraints
- 10.1 Market drivers
- 10.2 Market challenges
- 10.3 Impact of drivers and challenges
- Impact of drivers and challenges in 2023 and 2028
- 10.4 Market opportunities/restraints
11 Competitive Landscape
- 11.1 Overview
- 11.2 Competitive Landscape
- Overview on criticality of inputs and factors of differentiation
- 11.3 Landscape disruption
- Overview on factors of disruption
- 11.4 Industry risks
- Impact of key risks on business
12 Competitive Analysis
- 12.1 Companies profiled
- Companies covered
- 12.2 Market positioning of companies
- Matrix on companies position and classification
- 12.3 Aditya Birla Management Corp. Pvt. Ltd.
- Aditya Birla Management Corp. Pvt. Ltd. - Overview
- Aditya Birla Management Corp. Pvt. Ltd. - Product / Service
- Aditya Birla Management Corp. Pvt. Ltd. - Key news
- Aditya Birla Management Corp. Pvt. Ltd. - Key offerings
- 12.4 Baltex
- Baltex - Overview
- Baltex - Product / Service
- Baltex - Key offerings
- 12.5 BASF SE
- BASF SE - Overview
- BASF SE - Business segments
- BASF SE - Key news
- BASF SE - Key offerings
- BASF SE - Segment focus
- 12.6 BioCote Ltd.
- BioCote Ltd. - Overview
- BioCote Ltd. - Product / Service
- BioCote Ltd. - Key offerings
- 12.7 Dow Chemical Co.
- Dow Chemical Co. - Overview
- Dow Chemical Co. - Business segments
- Dow Chemical Co. - Key news
- Dow Chemical Co. - Key offerings
- Dow Chemical Co. - Segment focus
- 12.8 Herculite Inc.
- Herculite Inc. - Overview
- Herculite Inc. - Product / Service
- Herculite Inc. - Key news
- Herculite Inc. - Key offerings
- 12.9 Indorama Ventures Public Co. Ltd.
- Indorama Ventures Public Co. Ltd. - Overview
- Indorama Ventures Public Co. Ltd. - Business segments
- Indorama Ventures Public Co. Ltd. - Key news
- Indorama Ventures Public Co. Ltd. - Key offerings
- Indorama Ventures Public Co. Ltd. - Segment focus
- 12.10 Integra Lifesciences Corp.
- Integra Lifesciences Corp. - Overview
- Integra Lifesciences Corp. - Business segments
- Integra Lifesciences Corp. - Key news
- Integra Lifesciences Corp. - Key offerings
- Integra Lifesciences Corp. - Segment focus
- 12.11 Milliken and Co.
- Milliken and Co. - Overview
- Milliken and Co. - Product / Service
- Milliken and Co. - Key offerings
- 12.12 Noble Biomaterials Inc.
- Noble Biomaterials Inc. - Overview
- Noble Biomaterials Inc. - Product / Service
- Noble Biomaterials Inc. - Key offerings
- 12.13 PurThread Technologies Inc.
- PurThread Technologies Inc. - Overview
- PurThread Technologies Inc. - Product / Service
- PurThread Technologies Inc. - Key offerings
- 12.14 Sciessent LLC
- Sciessent LLC - Overview
- Sciessent LLC - Product / Service
- Sciessent LLC - Key offerings
- 12.15 Sinanen Holdings Co., Ltd.
- Sinanen Holdings Co., Ltd. - Overview
- Sinanen Holdings Co., Ltd. - Product / Service
- Sinanen Holdings Co., Ltd. - Key news
- Sinanen Holdings Co., Ltd. - Key offerings
- 12.16 Sono Tek Corp.
- Sono Tek Corp. - Overview
- Sono Tek Corp. - Product / Service
- Sono Tek Corp. - Key news
- Sono Tek Corp. - Key offerings
- 12.17 W.M. BARR Co. Inc.
- W.M. BARR Co. Inc. - Overview
- W.M. BARR Co. Inc. - Product / Service
- W.M. BARR Co. Inc. - Key offerings
13 Appendix
- 13.1 Scope of the report
- 13.2 Inclusions and exclusions checklist
- Inclusions checklist
- Exclusions checklist
- 13.3 Currency conversion rates for US$
- Currency conversion rates for US$
- 13.4 Research methodology
- Research methodology
- 13.5 Data procurement
- Information sources
- 13.6 Data validation
- Data validation
- 13.7 Validation techniques employed for market sizing
- Validation techniques employed for market sizing
- 13.8 Data synthesis
- Data synthesis
- 13.9 360 degree market analysis
- 360 degree market analysis
- 13.10 List of abbreviations
- List of abbreviations
