|
|
市場調査レポート
商品コード
1719414
コーヒークリーマーの世界市場 2025~2029年Global Coffee Creamer Market 2025-2029 |
||||||

|
|||||||
カスタマイズ可能
|
|||||||


| コーヒークリーマーの世界市場 2025~2029年 |
|
出版日: 2025年04月16日
発行: TechNavio
ページ情報: 英文 245 Pages
納期: 即納可能
|

全表示
- 概要
- 図表
- 目次
コーヒークリーマー市場は2024-2029年に28億7,550万米ドル、予測期間中のCAGRは4.3%で成長すると予測されます。
当レポートでは、コーヒークリーマー市場の全体的な分析、市場規模・予測、動向、成長促進要因、課題、約25のベンダーを網羅したベンダー分析などを掲載しています。
現在の市場シナリオ、最新動向と促進要因、市場環境全体に関する最新分析を提供しています。市場は、オンライン小売の注目度の高まり、植物由来のコーヒークリーマーの需要、製品の発売によって牽引されています。
| 市場範囲 | |
|---|---|
| 基準年 | 2025 |
| 終了年 | 2029 |
| 予測期間 | 2025-2029 |
| 成長モメンタム | 加速 |
| 前年比2025年 | 4.1% |
| CAGR | 4.3% |
| 増分額 | 28億7,550万米ドル |
本調査は、業界の主要参加者からのインプットを含め、一次情報と二次情報を客観的に組み合わせて実施しました。レポートには、主要企業の分析に加え、包括的な市場規模データ、地域別分析によるセグメント、ベンダー情勢が含まれています。レポートには過去データと予測データがあります。
本調査では、クリーンラベルの動きが今後数年間のコーヒークリーマー市場の成長を促進する主要な理由の1つであると特定しています。また、栄養価が高く健康的なコーヒークリーマーへの嗜好の高まりや、消費者の嗜好に合わせた新製品を迅速に発売するための研究開発投資は、市場の大きな需要につながります。
目次
第1章 エグゼクティブサマリー
- 市場概要
第2章 Technavio分析
- 価格・ライフサイクル・顧客購入バスケット・採用率・購入基準の分析
- インプットの重要性と差別化の要因
- 混乱の要因
- 促進要因と課題の影響
第3章 市場情勢
- 市場エコシステム
- 市場の特徴
- バリューチェーン分析
第4章 市場規模
- 市場の定義
- 市場セグメント分析
- 市場規模 2024
- 市場の見通し 2024-2029
第5章 市場規模実績
- コーヒークリーマーの世界市場 2019-2023
- タイプ別セグメント分析 2019-2023
- チャネル別セグメント分析 2019-2023
- 製品別セグメント分析 2019-2023
- パッケージング別セグメント分析 2019-2023
- 製品タイプ別セグメント分析 2019-2023
- 地域別セグメント分析 2019-2023
- 国別セグメント分析 2019-2023
第6章 定性分析
- AIの影響:コーヒークリーマーの世界市場
第7章 ファイブフォース分析
- ファイブフォースの要約
- 買い手の交渉力
- 供給企業の交渉力
- 新規参入業者の脅威
- 代替品の脅威
- 競争の脅威
- 市況
第8章 市場セグメンテーション:タイプ別
- 市場セグメント
- 比較:タイプ別
- 液体:市場規模と予測 2024-2029
- 粉末:市場規模と予測 2024-2029
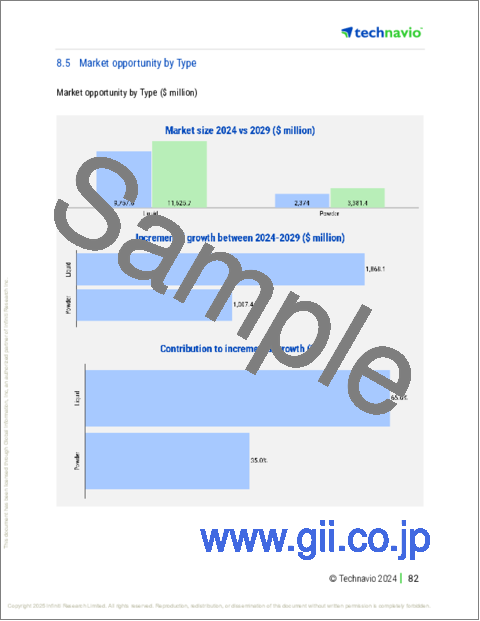
- 市場機会:タイプ別
第9章 市場セグメンテーション:チャネル別
- 市場セグメント
- 比較:チャネル別
- オフライン:市場規模と予測 2024-2029
- オンライン:市場規模と予測 2024-2029
- 市場機会:チャネル別
第10章 市場セグメンテーション:製品別
- 市場セグメント
- 比較:製品別
- 乳製品不使用:市場規模と予測 2024-2029
- 乳製品ベース:市場規模と予測 2024-2029
- 市場機会:製品別
第11章 市場セグメンテーション:パッケージング別
- 市場セグメント
- 比較:パッケージング別
- プラスチック瓶:市場規模と予測 2024-2029
- テトラパック:市場規模と予測 2024-2029
- ペットボトル:市場規模と予測 2024-2029
- 市場機会:パッケージング別
第12章 市場セグメンテーション:製品タイプ別
- 市場セグメント
- 比較:製品タイプ別
- 従来型:市場規模と予測 2024-2029
- オーガニック:市場規模と予測 2024-2029
- 市場機会:製品タイプ別
第13章 顧客情勢
- 顧客情勢の概要
第14章 地域別情勢
- 地域別セグメンテーション
- 地域別比較
- 北米:市場規模と予測 2024-2029
- 欧州:市場規模と予測 2024-2029
- アジア太平洋:市場規模と予測 2024-2029
- 南米:市場規模と予測 2024-2029
- 中東・アフリカ:市場規模と予測 2024-2029
- 米国:市場規模と予測 2024-2029
- フランス:市場規模と予測 2024-2029
- 英国:市場規模と予測 2024-2029
- インド:市場規模と予測 2024-2029
- カナダ:市場規模と予測 2024-2029
- ブラジル:市場規模と予測 2024-2029
- 中国:市場規模と予測 2024-2029
- ドイツ:市場規模と予測 2024-2029
- 日本:市場規模と予測 2024-2029
- イタリア:市場規模と予測 2024-2029
- 市場機会:地域情勢別
第15章 促進要因・課題・機会・抑制要因
- 市場促進要因
- 市場の課題
- 促進要因と課題の影響
- 市場の機会・抑制要因
第16章 競合情勢
- 概要
- 競合情勢
- 混乱の状況
- 業界のリスク
第17章 競合分析
- 企業プロファイル
- 企業ランキング指数
- 企業の市場ポジショニング
- Barry Callebaut AG
- Cafea GmbH
- Califia Farms LLC
- Custom Food Group
- Danone SA
- DreamPak LLC
- Fujian Jumbo Grand Food Co. Ltd.
- Jiangxi Weierbao Food Biological Co. Ltd.
- Laird Superfood Inc.
- Nestle SA
- nutpods Dairy Free Creamer
- Royal FrieslandCampina NV
- TURM Sahne GmbH
- Viceroy Holland BV
- Wenhui Food Industry Co. Ltd.
第18章 付録
Exhibits:
- Exhibits1: Executive Summary - Chart on Market Overview
- Exhibits2: Executive Summary - Data Table on Market Overview
- Exhibits3: Executive Summary - Chart on Global Market Characteristics
- Exhibits4: Executive Summary - Chart on Market By Geographical Landscape
- Exhibits5: Executive Summary - Chart on Market Segmentation by Type
- Exhibits6: Executive Summary - Chart on Market Segmentation by Channel
- Exhibits7: Executive Summary - Chart on Market Segmentation by Product
- Exhibits8: Executive Summary - Chart on Market Segmentation by Packaging
- Exhibits9: Executive Summary - Chart on Market Segmentation by Product Type
- Exhibits10: Executive Summary - Chart on Incremental Growth
- Exhibits11: Executive Summary - Data Table on Incremental Growth
- Exhibits12: Executive Summary - Chart on Company Market Positioning
- Exhibits13: Analysis of price sensitivity, lifecycle, customer purchase basket, adoption rates, and purchase criteria
- Exhibits14: Overview on criticality of inputs and factors of differentiation
- Exhibits15: Overview on factors of disruption
- Exhibits16: Impact of drivers and challenges in 2024 and 2029
- Exhibits17: Parent Market
- Exhibits18: Data Table on - Parent Market
- Exhibits19: Market characteristics analysis
- Exhibits20: Value chain analysis
- Exhibits21: Offerings of companies included in the market definition
- Exhibits22: Market segments
- Exhibits23: Chart on Global - Market size and forecast 2024-2029 ($ million)
- Exhibits24: Data Table on Global - Market size and forecast 2024-2029 ($ million)
- Exhibits25: Chart on Global Market: Year-over-year growth 2024-2029 (%)
- Exhibits26: Data Table on Global Market: Year-over-year growth 2024-2029 (%)
- Exhibits27: Historic Market Size - Data Table on Global Coffee Creamer Market 2019 - 2023 ($ million)
- Exhibits28: Historic Market Size - Type Segment 2019 - 2023 ($ million)
- Exhibits29: Historic Market Size - Channel Segment 2019 - 2023 ($ million)
- Exhibits30: Historic Market Size - Product Segment 2019 - 2023 ($ million)
- Exhibits31: Historic Market Size - Packaging Segment 2019 - 2023 ($ million)
- Exhibits32: Historic Market Size - Product Type Segment 2019 - 2023 ($ million)
- Exhibits33: Historic Market Size - Geography Segment 2019 - 2023 ($ million)
- Exhibits34: Historic Market Size - Country Segment 2019 - 2023 ($ million)
- Exhibits35: Five forces analysis - Comparison between 2024 and 2029
- Exhibits36: Bargaining power of buyers - Impact of key factors 2024 and 2029
- Exhibits37: Bargaining power of suppliers - Impact of key factors in 2024 and 2029
- Exhibits38: Threat of new entrants - Impact of key factors in 2024 and 2029
- Exhibits39: Threat of substitutes - Impact of key factors in 2024 and 2029
- Exhibits40: Threat of rivalry - Impact of key factors in 2024 and 2029
- Exhibits41: Chart on Market condition - Five forces 2024 and 2029
- Exhibits42: Chart on Type - Market share 2024-2029 (%)
- Exhibits43: Data Table on Type - Market share 2024-2029 (%)
- Exhibits44: Chart on Comparison by Type
- Exhibits45: Data Table on Comparison by Type
- Exhibits46: Chart on Liquid - Market size and forecast 2024-2029 ($ million)
- Exhibits47: Data Table on Liquid - Market size and forecast 2024-2029 ($ million)
- Exhibits48: Chart on Liquid - Year-over-year growth 2024-2029 (%)
- Exhibits49: Data Table on Liquid - Year-over-year growth 2024-2029 (%)
- Exhibits50: Chart on Powder - Market size and forecast 2024-2029 ($ million)
- Exhibits51: Data Table on Powder - Market size and forecast 2024-2029 ($ million)
- Exhibits52: Chart on Powder - Year-over-year growth 2024-2029 (%)
- Exhibits53: Data Table on Powder - Year-over-year growth 2024-2029 (%)
- Exhibits54: Market opportunity by Type ($ million)
- Exhibits55: Data Table on Market opportunity by Type ($ million)
- Exhibits56: Chart on Channel - Market share 2024-2029 (%)
- Exhibits57: Data Table on Channel - Market share 2024-2029 (%)
- Exhibits58: Chart on Comparison by Channel
- Exhibits59: Data Table on Comparison by Channel
- Exhibits60: Chart on Offline - Market size and forecast 2024-2029 ($ million)
- Exhibits61: Data Table on Offline - Market size and forecast 2024-2029 ($ million)
- Exhibits62: Chart on Offline - Year-over-year growth 2024-2029 (%)
- Exhibits63: Data Table on Offline - Year-over-year growth 2024-2029 (%)
- Exhibits64: Chart on Online - Market size and forecast 2024-2029 ($ million)
- Exhibits65: Data Table on Online - Market size and forecast 2024-2029 ($ million)
- Exhibits66: Chart on Online - Year-over-year growth 2024-2029 (%)
- Exhibits67: Data Table on Online - Year-over-year growth 2024-2029 (%)
- Exhibits68: Market opportunity by Channel ($ million)
- Exhibits69: Data Table on Market opportunity by Channel ($ million)
- Exhibits70: Chart on Product - Market share 2024-2029 (%)
- Exhibits71: Data Table on Product - Market share 2024-2029 (%)
- Exhibits72: Chart on Comparison by Product
- Exhibits73: Data Table on Comparison by Product
- Exhibits74: Chart on Non-dairy - Market size and forecast 2024-2029 ($ million)
- Exhibits75: Data Table on Non-dairy - Market size and forecast 2024-2029 ($ million)
- Exhibits76: Chart on Non-dairy - Year-over-year growth 2024-2029 (%)
- Exhibits77: Data Table on Non-dairy - Year-over-year growth 2024-2029 (%)
- Exhibits78: Chart on Dairy-based - Market size and forecast 2024-2029 ($ million)
- Exhibits79: Data Table on Dairy-based - Market size and forecast 2024-2029 ($ million)
- Exhibits80: Chart on Dairy-based - Year-over-year growth 2024-2029 (%)
- Exhibits81: Data Table on Dairy-based - Year-over-year growth 2024-2029 (%)
- Exhibits82: Market opportunity by Product ($ million)
- Exhibits83: Data Table on Market opportunity by Product ($ million)
- Exhibits84: Chart on Packaging - Market share 2024-2029 (%)
- Exhibits85: Data Table on Packaging - Market share 2024-2029 (%)
- Exhibits86: Chart on Comparison by Packaging
- Exhibits87: Data Table on Comparison by Packaging
- Exhibits88: Chart on Plastic jars - Market size and forecast 2024-2029 ($ million)
- Exhibits89: Data Table on Plastic jars - Market size and forecast 2024-2029 ($ million)
- Exhibits90: Chart on Plastic jars - Year-over-year growth 2024-2029 (%)
- Exhibits91: Data Table on Plastic jars - Year-over-year growth 2024-2029 (%)
- Exhibits92: Chart on Tetrapacks - Market size and forecast 2024-2029 ($ million)
- Exhibits93: Data Table on Tetrapacks - Market size and forecast 2024-2029 ($ million)
- Exhibits94: Chart on Tetrapacks - Year-over-year growth 2024-2029 (%)
- Exhibits95: Data Table on Tetrapacks - Year-over-year growth 2024-2029 (%)
- Exhibits96: Chart on PET bottles - Market size and forecast 2024-2029 ($ million)
- Exhibits97: Data Table on PET bottles - Market size and forecast 2024-2029 ($ million)
- Exhibits98: Chart on PET bottles - Year-over-year growth 2024-2029 (%)
- Exhibits99: Data Table on PET bottles - Year-over-year growth 2024-2029 (%)
- Exhibits100: Market opportunity by Packaging ($ million)
- Exhibits101: Data Table on Market opportunity by Packaging ($ million)
- Exhibits102: Chart on Product Type - Market share 2024-2029 (%)
- Exhibits103: Data Table on Product Type - Market share 2024-2029 (%)
- Exhibits104: Chart on Comparison by Product Type
- Exhibits105: Data Table on Comparison by Product Type
- Exhibits106: Chart on Conventional - Market size and forecast 2024-2029 ($ million)
- Exhibits107: Data Table on Conventional - Market size and forecast 2024-2029 ($ million)
- Exhibits108: Chart on Conventional - Year-over-year growth 2024-2029 (%)
- Exhibits109: Data Table on Conventional - Year-over-year growth 2024-2029 (%)
- Exhibits110: Chart on Organic - Market size and forecast 2024-2029 ($ million)
- Exhibits111: Data Table on Organic - Market size and forecast 2024-2029 ($ million)
- Exhibits112: Chart on Organic - Year-over-year growth 2024-2029 (%)
- Exhibits113: Data Table on Organic - Year-over-year growth 2024-2029 (%)
- Exhibits114: Market opportunity by Product Type ($ million)
- Exhibits115: Data Table on Market opportunity by Product Type ($ million)
- Exhibits116: Analysis of price sensitivity, lifecycle, customer purchase basket, adoption rates, and purchase criteria
- Exhibits117: Chart on Market share By Geographical Landscape 2024-2029 (%)
- Exhibits118: Data Table on Market share By Geographical Landscape 2024-2029 (%)
- Exhibits119: Chart on Geographic comparison
- Exhibits120: Data Table on Geographic comparison
- Exhibits121: Chart on North America - Market size and forecast 2024-2029 ($ million)
- Exhibits122: Data Table on North America - Market size and forecast 2024-2029 ($ million)
- Exhibits123: Chart on North America - Year-over-year growth 2024-2029 (%)
- Exhibits124: Data Table on North America - Year-over-year growth 2024-2029 (%)
- Exhibits125: Chart on Europe - Market size and forecast 2024-2029 ($ million)
- Exhibits126: Data Table on Europe - Market size and forecast 2024-2029 ($ million)
- Exhibits127: Chart on Europe - Year-over-year growth 2024-2029 (%)
- Exhibits128: Data Table on Europe - Year-over-year growth 2024-2029 (%)
- Exhibits129: Chart on APAC - Market size and forecast 2024-2029 ($ million)
- Exhibits130: Data Table on APAC - Market size and forecast 2024-2029 ($ million)
- Exhibits131: Chart on APAC - Year-over-year growth 2024-2029 (%)
- Exhibits132: Data Table on APAC - Year-over-year growth 2024-2029 (%)
- Exhibits133: Chart on South America - Market size and forecast 2024-2029 ($ million)
- Exhibits134: Data Table on South America - Market size and forecast 2024-2029 ($ million)
- Exhibits135: Chart on South America - Year-over-year growth 2024-2029 (%)
- Exhibits136: Data Table on South America - Year-over-year growth 2024-2029 (%)
- Exhibits137: Chart on Middle East and Africa - Market size and forecast 2024-2029 ($ million)
- Exhibits138: Data Table on Middle East and Africa - Market size and forecast 2024-2029 ($ million)
- Exhibits139: Chart on Middle East and Africa - Year-over-year growth 2024-2029 (%)
- Exhibits140: Data Table on Middle East and Africa - Year-over-year growth 2024-2029 (%)
- Exhibits141: Chart on US - Market size and forecast 2024-2029 ($ million)
- Exhibits142: Data Table on US - Market size and forecast 2024-2029 ($ million)
- Exhibits143: Chart on US - Year-over-year growth 2024-2029 (%)
- Exhibits144: Data Table on US - Year-over-year growth 2024-2029 (%)
- Exhibits145: Chart on France - Market size and forecast 2024-2029 ($ million)
- Exhibits146: Data Table on France - Market size and forecast 2024-2029 ($ million)
- Exhibits147: Chart on France - Year-over-year growth 2024-2029 (%)
- Exhibits148: Data Table on France - Year-over-year growth 2024-2029 (%)
- Exhibits149: Chart on UK - Market size and forecast 2024-2029 ($ million)
- Exhibits150: Data Table on UK - Market size and forecast 2024-2029 ($ million)
- Exhibits151: Chart on UK - Year-over-year growth 2024-2029 (%)
- Exhibits152: Data Table on UK - Year-over-year growth 2024-2029 (%)
- Exhibits153: Chart on India - Market size and forecast 2024-2029 ($ million)
- Exhibits154: Data Table on India - Market size and forecast 2024-2029 ($ million)
- Exhibits155: Chart on India - Year-over-year growth 2024-2029 (%)
- Exhibits156: Data Table on India - Year-over-year growth 2024-2029 (%)
- Exhibits157: Chart on Canada - Market size and forecast 2024-2029 ($ million)
- Exhibits158: Data Table on Canada - Market size and forecast 2024-2029 ($ million)
- Exhibits159: Chart on Canada - Year-over-year growth 2024-2029 (%)
- Exhibits160: Data Table on Canada - Year-over-year growth 2024-2029 (%)
- Exhibits161: Chart on Brazil - Market size and forecast 2024-2029 ($ million)
- Exhibits162: Data Table on Brazil - Market size and forecast 2024-2029 ($ million)
- Exhibits163: Chart on Brazil - Year-over-year growth 2024-2029 (%)
- Exhibits164: Data Table on Brazil - Year-over-year growth 2024-2029 (%)
- Exhibits165: Chart on China - Market size and forecast 2024-2029 ($ million)
- Exhibits166: Data Table on China - Market size and forecast 2024-2029 ($ million)
- Exhibits167: Chart on China - Year-over-year growth 2024-2029 (%)
- Exhibits168: Data Table on China - Year-over-year growth 2024-2029 (%)
- Exhibits169: Chart on Germany - Market size and forecast 2024-2029 ($ million)
- Exhibits170: Data Table on Germany - Market size and forecast 2024-2029 ($ million)
- Exhibits171: Chart on Germany - Year-over-year growth 2024-2029 (%)
- Exhibits172: Data Table on Germany - Year-over-year growth 2024-2029 (%)
- Exhibits173: Chart on Japan - Market size and forecast 2024-2029 ($ million)
- Exhibits174: Data Table on Japan - Market size and forecast 2024-2029 ($ million)
- Exhibits175: Chart on Japan - Year-over-year growth 2024-2029 (%)
- Exhibits176: Data Table on Japan - Year-over-year growth 2024-2029 (%)
- Exhibits177: Chart on Italy - Market size and forecast 2024-2029 ($ million)
- Exhibits178: Data Table on Italy - Market size and forecast 2024-2029 ($ million)
- Exhibits179: Chart on Italy - Year-over-year growth 2024-2029 (%)
- Exhibits180: Data Table on Italy - Year-over-year growth 2024-2029 (%)
- Exhibits181: Market opportunity By Geographical Landscape ($ million)
- Exhibits182: Data Tables on Market opportunity By Geographical Landscape ($ million)
- Exhibits183: Impact of drivers and challenges in 2024 and 2029
- Exhibits184: Overview on criticality of inputs and factors of differentiation
- Exhibits185: Overview on factors of disruption
- Exhibits186: Impact of key risks on business
- Exhibits187: Companies covered
- Exhibits188: Company ranking index
- Exhibits189: Matrix on companies position and classification
- Exhibits190: Barry Callebaut AG - Overview
- Exhibits191: Barry Callebaut AG - Business segments
- Exhibits192: Barry Callebaut AG - Key news
- Exhibits193: Barry Callebaut AG - Key offerings
- Exhibits194: Barry Callebaut AG - Segment focus
- Exhibits195: SWOT
- Exhibits196: Cafea GmbH - Overview
- Exhibits197: Cafea GmbH - Product / Service
- Exhibits198: Cafea GmbH - Key offerings
- Exhibits199: SWOT
- Exhibits200: Califia Farms LLC - Overview
- Exhibits201: Califia Farms LLC - Product / Service
- Exhibits202: Califia Farms LLC - Key offerings
- Exhibits203: SWOT
- Exhibits204: Custom Food Group - Overview
- Exhibits205: Custom Food Group - Product / Service
- Exhibits206: Custom Food Group - Key offerings
- Exhibits207: SWOT
- Exhibits208: Danone SA - Overview
- Exhibits209: Danone SA - Business segments
- Exhibits210: Danone SA - Key news
- Exhibits211: Danone SA - Key offerings
- Exhibits212: Danone SA - Segment focus
- Exhibits213: SWOT
- Exhibits214: DreamPak LLC - Overview
- Exhibits215: DreamPak LLC - Product / Service
- Exhibits216: DreamPak LLC - Key offerings
- Exhibits217: SWOT
- Exhibits218: Fujian Jumbo Grand Food Co. Ltd. - Overview
- Exhibits219: Fujian Jumbo Grand Food Co. Ltd. - Product / Service
- Exhibits220: Fujian Jumbo Grand Food Co. Ltd. - Key offerings
- Exhibits221: SWOT
- Exhibits222: Jiangxi Weierbao Food Biological Co. Ltd. - Overview
- Exhibits223: Jiangxi Weierbao Food Biological Co. Ltd. - Product / Service
- Exhibits224: Jiangxi Weierbao Food Biological Co. Ltd. - Key offerings
- Exhibits225: SWOT
- Exhibits226: Laird Superfood Inc. - Overview
- Exhibits227: Laird Superfood Inc. - Product / Service
- Exhibits228: Laird Superfood Inc. - Key offerings
- Exhibits229: SWOT
- Exhibits230: Nestle SA - Overview
- Exhibits231: Nestle SA - Business segments
- Exhibits232: Nestle SA - Key news
- Exhibits233: Nestle SA - Key offerings
- Exhibits234: Nestle SA - Segment focus
- Exhibits235: SWOT
- Exhibits236: nutpods Dairy Free Creamer - Overview
- Exhibits237: nutpods Dairy Free Creamer - Product / Service
- Exhibits238: nutpods Dairy Free Creamer - Key offerings
- Exhibits239: SWOT
- Exhibits240: Royal FrieslandCampina NV - Overview
- Exhibits241: Royal FrieslandCampina NV - Business segments
- Exhibits242: Royal FrieslandCampina NV - Key offerings
- Exhibits243: Royal FrieslandCampina NV - Segment focus
- Exhibits244: SWOT
- Exhibits245: TURM Sahne GmbH - Overview
- Exhibits246: TURM Sahne GmbH - Product / Service
- Exhibits247: TURM Sahne GmbH - Key offerings
- Exhibits248: SWOT
- Exhibits249: Viceroy Holland BV - Overview
- Exhibits250: Viceroy Holland BV - Product / Service
- Exhibits251: Viceroy Holland BV - Key offerings
- Exhibits252: SWOT
- Exhibits253: Wenhui Food Industry Co. Ltd. - Overview
- Exhibits254: Wenhui Food Industry Co. Ltd. - Product / Service
- Exhibits255: Wenhui Food Industry Co. Ltd. - Key offerings
- Exhibits256: SWOT
- Exhibits257: Inclusions checklist
- Exhibits258: Exclusions checklist
- Exhibits259: Currency conversion rates for US$
- Exhibits260: Research methodology
- Exhibits261: Information sources
- Exhibits262: Data validation
- Exhibits263: Validation techniques employed for market sizing
- Exhibits264: Data synthesis
- Exhibits265: 360 degree market analysis
- Exhibits266: List of abbreviations
The coffee creamer market is forecasted to grow by USD 2875.5 mn during 2024-2029, accelerating at a CAGR of 4.3% during the forecast period. The report on the coffee creamer market provides a holistic analysis, market size and forecast, trends, growth drivers, and challenges, as well as vendor analysis covering around 25 vendors.
The report offers an up-to-date analysis regarding the current market scenario, the latest trends and drivers, and the overall market environment. The market is driven by growing prominence for online retailing, demand for plant-based coffee creamers, and product launches.
| Market Scope | |
|---|---|
| Base Year | 2025 |
| End Year | 2029 |
| Series Year | 2025-2029 |
| Growth Momentum | Accelerate |
| YOY 2025 | 4.1% |
| CAGR | 4.3% |
| Incremental Value | $2875.5 mn |
The study was conducted using an objective combination of primary and secondary information including inputs from key participants in the industry. The report contains a comprehensive market size data, segment with regional analysis and vendor landscape in addition to an analysis of the key companies. Reports have historic and forecast data.
Technavio's coffee creamer market is segmented as below:
By Type
- Liquid
- Powder
By Channel
- Offline
- Online
By Product
- Non-dairy
- Dairy-based
By Packaging
- Plastic jars
- Tetrapacks
- PET bottles
By Product Type
- Conventional
- Organic
By Geographical Landscape
- North America
- Europe
- APAC
- South America
- Middle East and Africa
This study identifies the clean label movement as one of the prime reasons driving the coffee creamer market growth during the next few years. Also, increasing preference for nutritional and healthy coffee creamers and research and development investment to quickly launch new products as per consumers tastes will lead to sizable demand in the market.
The report on the coffee creamer market covers the following areas:
- Coffee Creamer Market sizing
- Coffee Creamer Market forecast
- Coffee Creamer Market industry analysis
The robust vendor analysis is designed to help clients improve their market position, and in line with this, this report provides a detailed analysis of several leading coffee creamer market vendors that include ALMER MALAYSIA SDN BHD, Barry Callebaut AG, Cafea GmbH, Califia Farms LLC, Chobani Global Holdings LLC, Custom Food Group, Danone SA, DreamPak LLC, Fujian Jumbo Grand Food Co. Ltd., Hiland Dairy, Inspire Brands Inc., Jiangxi Weierbao Food Biological Co. Ltd., Laird Superfood Inc., Nestle SA, nutpods Dairy Free Creamer, Royal FrieslandCampina NV, TURM Sahne GmbH, Viceroy Holland BV, Wenhui Food Industry Co. Ltd., and WhiteWave Services Inc.. Also, the coffee creamer market analysis report includes information on upcoming trends and challenges that will influence market growth. This is to help companies strategize and leverage all forthcoming growth opportunities.
The publisher presents a detailed picture of the market by the way of study, synthesis, and summation of data from multiple sources by an analysis of key parameters such as profit, pricing, competition, and promotions. It presents various market facets by identifying the key industry influencers. The data presented is comprehensive, reliable, and a result of extensive primary and secondary research. The market research reports provide a complete competitive landscape and an in-depth vendor selection methodology and analysis using qualitative and quantitative research to forecast accurate market growth.
Table of Contents
1 Executive Summary
- 1.1 Market overview
- Executive Summary - Chart on Market Overview
- Executive Summary - Data Table on Market Overview
- Executive Summary - Chart on Global Market Characteristics
- Executive Summary - Chart on Market By Geographical Landscape
- Executive Summary - Chart on Market Segmentation by Type
- Executive Summary - Chart on Market Segmentation by Channel
- Executive Summary - Chart on Market Segmentation by Product
- Executive Summary - Chart on Market Segmentation by Packaging
- Executive Summary - Chart on Market Segmentation by Product Type
- Executive Summary - Chart on Incremental Growth
- Executive Summary - Data Table on Incremental Growth
- Executive Summary - Chart on Company Market Positioning
2 Technavio Analysis
- 2.1 Analysis of price sensitivity, lifecycle, customer purchase basket, adoption rates, and purchase criteria
- Analysis of price sensitivity, lifecycle, customer purchase basket, adoption rates, and purchase criteria
- 2.2 Criticality of inputs and Factors of differentiation
- Overview on criticality of inputs and factors of differentiation
- 2.3 Factors of disruption
- Overview on factors of disruption
- 2.4 Impact of drivers and challenges
- Impact of drivers and challenges in 2024 and 2029
3 Market Landscape
- 3.1 Market ecosystem
- Parent Market
- Data Table on - Parent Market
- 3.2 Market characteristics
- Market characteristics analysis
- 3.3 Value chain analysis
- Value chain analysis
4 Market Sizing
- 4.1 Market definition
- Offerings of companies included in the market definition
- 4.2 Market segment analysis
- Market segments
- 4.3 Market size 2024
- 4.4 Market outlook: Forecast for 2024-2029
- Chart on Global - Market size and forecast 2024-2029 ($ million)
- Data Table on Global - Market size and forecast 2024-2029 ($ million)
- Chart on Global Market: Year-over-year growth 2024-2029 (%)
- Data Table on Global Market: Year-over-year growth 2024-2029 (%)
5 Historic Market Size
- 5.1 Global Coffee Creamer Market 2019 - 2023
- Historic Market Size - Data Table on Global Coffee Creamer Market 2019 - 2023 ($ million)
- 5.2 Type segment analysis 2019 - 2023
- Historic Market Size - Type Segment 2019 - 2023 ($ million)
- 5.3 Channel segment analysis 2019 - 2023
- Historic Market Size - Channel Segment 2019 - 2023 ($ million)
- 5.4 Product segment analysis 2019 - 2023
- Historic Market Size - Product Segment 2019 - 2023 ($ million)
- 5.5 Packaging segment analysis 2019 - 2023
- Historic Market Size - Packaging Segment 2019 - 2023 ($ million)
- 5.6 Product Type segment analysis 2019 - 2023
- Historic Market Size - Product Type Segment 2019 - 2023 ($ million)
- 5.7 Geography segment analysis 2019 - 2023
- Historic Market Size - Geography Segment 2019 - 2023 ($ million)
- 5.8 Country segment analysis 2019 - 2023
- Historic Market Size - Country Segment 2019 - 2023 ($ million)
6 Qualitative Analysis
- 6.1 The AI impact on Global Coffee Creamer Market
7 Five Forces Analysis
- 7.1 Five forces summary
- Five forces analysis - Comparison between 2024 and 2029
- 7.2 Bargaining power of buyers
- Bargaining power of buyers - Impact of key factors 2024 and 2029
- 7.3 Bargaining power of suppliers
- Bargaining power of suppliers - Impact of key factors in 2024 and 2029
- 7.4 Threat of new entrants
- Threat of new entrants - Impact of key factors in 2024 and 2029
- 7.5 Threat of substitutes
- Threat of substitutes - Impact of key factors in 2024 and 2029
- 7.6 Threat of rivalry
- Threat of rivalry - Impact of key factors in 2024 and 2029
- 7.7 Market condition
- Chart on Market condition - Five forces 2024 and 2029
8 Market Segmentation by Type
- 8.1 Market segments
- Chart on Type - Market share 2024-2029 (%)
- Data Table on Type - Market share 2024-2029 (%)
- 8.2 Comparison by Type
- Chart on Comparison by Type
- Data Table on Comparison by Type
- 8.3 Liquid - Market size and forecast 2024-2029
- Chart on Liquid - Market size and forecast 2024-2029 ($ million)
- Data Table on Liquid - Market size and forecast 2024-2029 ($ million)
- Chart on Liquid - Year-over-year growth 2024-2029 (%)
- Data Table on Liquid - Year-over-year growth 2024-2029 (%)
- 8.4 Powder - Market size and forecast 2024-2029
- Chart on Powder - Market size and forecast 2024-2029 ($ million)
- Data Table on Powder - Market size and forecast 2024-2029 ($ million)
- Chart on Powder - Year-over-year growth 2024-2029 (%)
- Data Table on Powder - Year-over-year growth 2024-2029 (%)
- 8.5 Market opportunity by Type
- Market opportunity by Type ($ million)
- Data Table on Market opportunity by Type ($ million)
9 Market Segmentation by Channel
- 9.1 Market segments
- Chart on Channel - Market share 2024-2029 (%)
- Data Table on Channel - Market share 2024-2029 (%)
- 9.2 Comparison by Channel
- Chart on Comparison by Channel
- Data Table on Comparison by Channel
- 9.3 Offline - Market size and forecast 2024-2029
- Chart on Offline - Market size and forecast 2024-2029 ($ million)
- Data Table on Offline - Market size and forecast 2024-2029 ($ million)
- Chart on Offline - Year-over-year growth 2024-2029 (%)
- Data Table on Offline - Year-over-year growth 2024-2029 (%)
- 9.4 Online - Market size and forecast 2024-2029
- Chart on Online - Market size and forecast 2024-2029 ($ million)
- Data Table on Online - Market size and forecast 2024-2029 ($ million)
- Chart on Online - Year-over-year growth 2024-2029 (%)
- Data Table on Online - Year-over-year growth 2024-2029 (%)
- 9.5 Market opportunity by Channel
- Market opportunity by Channel ($ million)
- Data Table on Market opportunity by Channel ($ million)
10 Market Segmentation by Product
- 10.1 Market segments
- Chart on Product - Market share 2024-2029 (%)
- Data Table on Product - Market share 2024-2029 (%)
- 10.2 Comparison by Product
- Chart on Comparison by Product
- Data Table on Comparison by Product
- 10.3 Non-dairy - Market size and forecast 2024-2029
- Chart on Non-dairy - Market size and forecast 2024-2029 ($ million)
- Data Table on Non-dairy - Market size and forecast 2024-2029 ($ million)
- Chart on Non-dairy - Year-over-year growth 2024-2029 (%)
- Data Table on Non-dairy - Year-over-year growth 2024-2029 (%)
- 10.4 Dairy-based - Market size and forecast 2024-2029
- Chart on Dairy-based - Market size and forecast 2024-2029 ($ million)
- Data Table on Dairy-based - Market size and forecast 2024-2029 ($ million)
- Chart on Dairy-based - Year-over-year growth 2024-2029 (%)
- Data Table on Dairy-based - Year-over-year growth 2024-2029 (%)
- 10.5 Market opportunity by Product
- Market opportunity by Product ($ million)
- Data Table on Market opportunity by Product ($ million)
11 Market Segmentation by Packaging
- 11.1 Market segments
- Chart on Packaging - Market share 2024-2029 (%)
- Data Table on Packaging - Market share 2024-2029 (%)
- 11.2 Comparison by Packaging
- Chart on Comparison by Packaging
- Data Table on Comparison by Packaging
- 11.3 Plastic jars - Market size and forecast 2024-2029
- Chart on Plastic jars - Market size and forecast 2024-2029 ($ million)
- Data Table on Plastic jars - Market size and forecast 2024-2029 ($ million)
- Chart on Plastic jars - Year-over-year growth 2024-2029 (%)
- Data Table on Plastic jars - Year-over-year growth 2024-2029 (%)
- 11.4 Tetrapacks - Market size and forecast 2024-2029
- Chart on Tetrapacks - Market size and forecast 2024-2029 ($ million)
- Data Table on Tetrapacks - Market size and forecast 2024-2029 ($ million)
- Chart on Tetrapacks - Year-over-year growth 2024-2029 (%)
- Data Table on Tetrapacks - Year-over-year growth 2024-2029 (%)
- 11.5 PET bottles - Market size and forecast 2024-2029
- Chart on PET bottles - Market size and forecast 2024-2029 ($ million)
- Data Table on PET bottles - Market size and forecast 2024-2029 ($ million)
- Chart on PET bottles - Year-over-year growth 2024-2029 (%)
- Data Table on PET bottles - Year-over-year growth 2024-2029 (%)
- 11.6 Market opportunity by Packaging
- Market opportunity by Packaging ($ million)
- Data Table on Market opportunity by Packaging ($ million)
12 Market Segmentation by Product Type
- 12.1 Market segments
- Chart on Product Type - Market share 2024-2029 (%)
- Data Table on Product Type - Market share 2024-2029 (%)
- 12.2 Comparison by Product Type
- Chart on Comparison by Product Type
- Data Table on Comparison by Product Type
- 12.3 Conventional - Market size and forecast 2024-2029
- Chart on Conventional - Market size and forecast 2024-2029 ($ million)
- Data Table on Conventional - Market size and forecast 2024-2029 ($ million)
- Chart on Conventional - Year-over-year growth 2024-2029 (%)
- Data Table on Conventional - Year-over-year growth 2024-2029 (%)
- 12.4 Organic - Market size and forecast 2024-2029
- Chart on Organic - Market size and forecast 2024-2029 ($ million)
- Data Table on Organic - Market size and forecast 2024-2029 ($ million)
- Chart on Organic - Year-over-year growth 2024-2029 (%)
- Data Table on Organic - Year-over-year growth 2024-2029 (%)
- 12.5 Market opportunity by Product Type
- Market opportunity by Product Type ($ million)
- Data Table on Market opportunity by Product Type ($ million)
13 Customer Landscape
- 13.1 Customer landscape overview
- Analysis of price sensitivity, lifecycle, customer purchase basket, adoption rates, and purchase criteria
14 Geographic Landscape
- 14.1 Geographic segmentation
- Chart on Market share By Geographical Landscape 2024-2029 (%)
- Data Table on Market share By Geographical Landscape 2024-2029 (%)
- 14.2 Geographic comparison
- Chart on Geographic comparison
- Data Table on Geographic comparison
- 14.3 North America - Market size and forecast 2024-2029
- Chart on North America - Market size and forecast 2024-2029 ($ million)
- Data Table on North America - Market size and forecast 2024-2029 ($ million)
- Chart on North America - Year-over-year growth 2024-2029 (%)
- Data Table on North America - Year-over-year growth 2024-2029 (%)
- 14.4 Europe - Market size and forecast 2024-2029
- Chart on Europe - Market size and forecast 2024-2029 ($ million)
- Data Table on Europe - Market size and forecast 2024-2029 ($ million)
- Chart on Europe - Year-over-year growth 2024-2029 (%)
- Data Table on Europe - Year-over-year growth 2024-2029 (%)
- 14.5 APAC - Market size and forecast 2024-2029
- Chart on APAC - Market size and forecast 2024-2029 ($ million)
- Data Table on APAC - Market size and forecast 2024-2029 ($ million)
- Chart on APAC - Year-over-year growth 2024-2029 (%)
- Data Table on APAC - Year-over-year growth 2024-2029 (%)
- 14.6 South America - Market size and forecast 2024-2029
- Chart on South America - Market size and forecast 2024-2029 ($ million)
- Data Table on South America - Market size and forecast 2024-2029 ($ million)
- Chart on South America - Year-over-year growth 2024-2029 (%)
- Data Table on South America - Year-over-year growth 2024-2029 (%)
- 14.7 Middle East and Africa - Market size and forecast 2024-2029
- Chart on Middle East and Africa - Market size and forecast 2024-2029 ($ million)
- Data Table on Middle East and Africa - Market size and forecast 2024-2029 ($ million)
- Chart on Middle East and Africa - Year-over-year growth 2024-2029 (%)
- Data Table on Middle East and Africa - Year-over-year growth 2024-2029 (%)
- 14.8 US - Market size and forecast 2024-2029
- Chart on US - Market size and forecast 2024-2029 ($ million)
- Data Table on US - Market size and forecast 2024-2029 ($ million)
- Chart on US - Year-over-year growth 2024-2029 (%)
- Data Table on US - Year-over-year growth 2024-2029 (%)
- 14.9 France - Market size and forecast 2024-2029
- Chart on France - Market size and forecast 2024-2029 ($ million)
- Data Table on France - Market size and forecast 2024-2029 ($ million)
- Chart on France - Year-over-year growth 2024-2029 (%)
- Data Table on France - Year-over-year growth 2024-2029 (%)
- 14.10 UK - Market size and forecast 2024-2029
- Chart on UK - Market size and forecast 2024-2029 ($ million)
- Data Table on UK - Market size and forecast 2024-2029 ($ million)
- Chart on UK - Year-over-year growth 2024-2029 (%)
- Data Table on UK - Year-over-year growth 2024-2029 (%)
- 14.11 India - Market size and forecast 2024-2029
- Chart on India - Market size and forecast 2024-2029 ($ million)
- Data Table on India - Market size and forecast 2024-2029 ($ million)
- Chart on India - Year-over-year growth 2024-2029 (%)
- Data Table on India - Year-over-year growth 2024-2029 (%)
- 14.12 Canada - Market size and forecast 2024-2029
- Chart on Canada - Market size and forecast 2024-2029 ($ million)
- Data Table on Canada - Market size and forecast 2024-2029 ($ million)
- Chart on Canada - Year-over-year growth 2024-2029 (%)
- Data Table on Canada - Year-over-year growth 2024-2029 (%)
- 14.13 Brazil - Market size and forecast 2024-2029
- Chart on Brazil - Market size and forecast 2024-2029 ($ million)
- Data Table on Brazil - Market size and forecast 2024-2029 ($ million)
- Chart on Brazil - Year-over-year growth 2024-2029 (%)
- Data Table on Brazil - Year-over-year growth 2024-2029 (%)
- 14.14 China - Market size and forecast 2024-2029
- Chart on China - Market size and forecast 2024-2029 ($ million)
- Data Table on China - Market size and forecast 2024-2029 ($ million)
- Chart on China - Year-over-year growth 2024-2029 (%)
- Data Table on China - Year-over-year growth 2024-2029 (%)
- 14.15 Germany - Market size and forecast 2024-2029
- Chart on Germany - Market size and forecast 2024-2029 ($ million)
- Data Table on Germany - Market size and forecast 2024-2029 ($ million)
- Chart on Germany - Year-over-year growth 2024-2029 (%)
- Data Table on Germany - Year-over-year growth 2024-2029 (%)
- 14.16 Japan - Market size and forecast 2024-2029
- Chart on Japan - Market size and forecast 2024-2029 ($ million)
- Data Table on Japan - Market size and forecast 2024-2029 ($ million)
- Chart on Japan - Year-over-year growth 2024-2029 (%)
- Data Table on Japan - Year-over-year growth 2024-2029 (%)
- 14.17 Italy - Market size and forecast 2024-2029
- Chart on Italy - Market size and forecast 2024-2029 ($ million)
- Data Table on Italy - Market size and forecast 2024-2029 ($ million)
- Chart on Italy - Year-over-year growth 2024-2029 (%)
- Data Table on Italy - Year-over-year growth 2024-2029 (%)
- 14.18 Market opportunity By Geographical Landscape
- Market opportunity By Geographical Landscape ($ million)
- Data Tables on Market opportunity By Geographical Landscape ($ million)
15 Drivers, Challenges, and Opportunity/Restraints
- 15.1 Market drivers
- 15.2 Market challenges
- 15.3 Impact of drivers and challenges
- Impact of drivers and challenges in 2024 and 2029
- 15.4 Market opportunities/restraints
16 Competitive Landscape
- 16.1 Overview
- 16.2 Competitive Landscape
- Overview on criticality of inputs and factors of differentiation
- 16.3 Landscape disruption
- Overview on factors of disruption
- 16.4 Industry risks
- Impact of key risks on business
17 Competitive Analysis
- 17.1 Companies profiled
- Companies covered
- 17.2 Company ranking index
- Company ranking index
- 17.3 Market positioning of companies
- Matrix on companies position and classification
- 17.4 Barry Callebaut AG
- Barry Callebaut AG - Overview
- Barry Callebaut AG - Business segments
- Barry Callebaut AG - Key news
- Barry Callebaut AG - Key offerings
- Barry Callebaut AG - Segment focus
- SWOT
- 17.5 Cafea GmbH
- Cafea GmbH - Overview
- Cafea GmbH - Product / Service
- Cafea GmbH - Key offerings
- SWOT
- 17.6 Califia Farms LLC
- Califia Farms LLC - Overview
- Califia Farms LLC - Product / Service
- Califia Farms LLC - Key offerings
- SWOT
- 17.7 Custom Food Group
- Custom Food Group - Overview
- Custom Food Group - Product / Service
- Custom Food Group - Key offerings
- SWOT
- 17.8 Danone SA
- Danone SA - Overview
- Danone SA - Business segments
- Danone SA - Key news
- Danone SA - Key offerings
- Danone SA - Segment focus
- SWOT
- 17.9 DreamPak LLC
- DreamPak LLC - Overview
- DreamPak LLC - Product / Service
- DreamPak LLC - Key offerings
- SWOT
- 17.10 Fujian Jumbo Grand Food Co. Ltd.
- Fujian Jumbo Grand Food Co. Ltd. - Overview
- Fujian Jumbo Grand Food Co. Ltd. - Product / Service
- Fujian Jumbo Grand Food Co. Ltd. - Key offerings
- SWOT
- 17.11 Jiangxi Weierbao Food Biological Co. Ltd.
- Jiangxi Weierbao Food Biological Co. Ltd. - Overview
- Jiangxi Weierbao Food Biological Co. Ltd. - Product / Service
- Jiangxi Weierbao Food Biological Co. Ltd. - Key offerings
- SWOT
- 17.12 Laird Superfood Inc.
- Laird Superfood Inc. - Overview
- Laird Superfood Inc. - Product / Service
- Laird Superfood Inc. - Key offerings
- SWOT
- 17.13 Nestle SA
- Nestle SA - Overview
- Nestle SA - Business segments
- Nestle SA - Key news
- Nestle SA - Key offerings
- Nestle SA - Segment focus
- SWOT
- 17.14 nutpods Dairy Free Creamer
- nutpods Dairy Free Creamer - Overview
- nutpods Dairy Free Creamer - Product / Service
- nutpods Dairy Free Creamer - Key offerings
- SWOT
- 17.15 Royal FrieslandCampina NV
- Royal FrieslandCampina NV - Overview
- Royal FrieslandCampina NV - Business segments
- Royal FrieslandCampina NV - Key offerings
- Royal FrieslandCampina NV - Segment focus
- SWOT
- 17.16 TURM Sahne GmbH
- TURM Sahne GmbH - Overview
- TURM Sahne GmbH - Product / Service
- TURM Sahne GmbH - Key offerings
- SWOT
- 17.17 Viceroy Holland BV
- Viceroy Holland BV - Overview
- Viceroy Holland BV - Product / Service
- Viceroy Holland BV - Key offerings
- SWOT
- 17.18 Wenhui Food Industry Co. Ltd.
- Wenhui Food Industry Co. Ltd. - Overview
- Wenhui Food Industry Co. Ltd. - Product / Service
- Wenhui Food Industry Co. Ltd. - Key offerings
- SWOT
18 Appendix
- 18.1 Scope of the report
- 18.2 Inclusions and exclusions checklist
- Inclusions checklist
- Exclusions checklist
- 18.3 Currency conversion rates for US$
- Currency conversion rates for US$
- 18.4 Research methodology
- Research methodology
- 18.5 Data procurement
- Information sources
- 18.6 Data validation
- Data validation
- 18.7 Validation techniques employed for market sizing
- Validation techniques employed for market sizing
- 18.8 Data synthesis
- Data synthesis
- 18.9 360 degree market analysis
- 360 degree market analysis
- 18.10 List of abbreviations
- List of abbreviations

