|
|
市場調査レポート
商品コード
1502502
工業用バルブとアクチュエータの世界市場 2024-2028Global industrial valves and actuators market 2024-2028 |
||||||

|
|||||||
カスタマイズ可能
|
|||||||

| 工業用バルブとアクチュエータの世界市場 2024-2028 |
|
出版日: 2024年05月22日
発行: TechNavio
ページ情報: 英文 194 Pages
納期: 即納可能
|

全表示
- 概要
- 図表
- 目次
Technavio社は工業用バルブとアクチュエータ市場を調査し、2023年から2028年にかけて186億7,900万米ドル、予測期間中のCAGRは4.85%で成長すると予測しています。
当レポートでは、工業用バルブとアクチュエータ市場の全体的な分析、市場規模・予測、動向、成長促進要因、課題、約25のベンダーを網羅したベンダー分析などを掲載しています。
現在の市場シナリオ、最新動向と促進要因、市場環境全体に関する最新分析を提供しています。産業施設の近代化投資の増加、石油・ガスパイプライン市場の成長モメンタムの活用、厳しい政府規制などが市場を牽引しています。
| 市場範囲 | |
|---|---|
| 基準年 | 2024 |
| 終了年 | 2028 |
| 予測期間 | 2024-2028 |
| 成長モメンタム | 加速 |
| 前年比2024年 | 4.54% |
| CAGR | 4.85% |
| 増分額 | 186億7,900万米ドル |
本調査では、バルブ診断の進化が今後数年間の工業用バルブとアクチュエータ市場成長を牽引する主な要因の1つであるとしています。また、シミュレーションソフトの適用拡大や新興国における化学製造施設への投資の増加が、市場の大きな需要につながります。
目次
第1章 エグゼクティブサマリー
- 市場概要
第2章 市場情勢
- 市場エコシステム
- 市場の特徴
- バリューチェーン分析
第3章 市場規模の評価
- 市場の定義
- 市場セグメント分析
- 市場規模 2023
- 市場の見通し 2023-2028
第4章 市場規模実績
- 世界工業用バルブとアクチュエータ市場 2018-2022
- 製品別セグメント分析 2018-2022
- エンドユーザー別セグメント分析 2018-2022
- 地域別セグメント分析 2018-2022
- 国別セグメント分析 2018-2022
第5章 ファイブフォース分析
- ファイブフォースの要約
- 買い手の交渉力
- 供給企業の交渉力
- 新規参入業者の脅威
- 代替品の脅威
- 競争の脅威
- 市況
第6章 市場セグメンテーション:製品別
- 市場セグメンテーション
- 比較:製品別
- 工業用1/4回転バルブ:市場規模と予測 2023-2028
- マルチターンバルブ:市場規模と予測 2023-2028
- 工業用コントロールバルブ:市場規模と予測 2023-2028
- 産業用アクチュエータ:市場規模と予測 2023-2028
- 市場機会:製品別
第7章 市場セグメンテーション:エンドユーザー別
- 市場セグメンテーション
- 比較:エンドユーザー別
- 化学と石油産業:市場規模と予測 2023-2028
- 水道と廃水処理業界:市場規模と予測 2023-2028
- 電力業界:市場規模と予測 2023-2028
- 鉱業と鉱物産業:市場規模と予測 2023-2028
- その他:市場規模と予測 2023-2028
- 市場機会:エンドユーザー別
第8章 顧客情勢
- 顧客情勢の概要
第9章 地域別情勢
- 地域別セグメンテーション
- 地域別比較
- アジア太平洋:市場規模と予測 2023-2028
- 欧州:市場規模と予測 2023-2028
- 北米:市場規模と予測 2023-2028
- 中東・アフリカ:市場規模と予測 2023-2028
- 南米:市場規模と予測 2023-2028
- 中国:市場規模と予測 2023-2028
- 米国:市場規模と予測 2023-2028
- 英国:市場規模と予測 2023-2028
- フランス:市場規模と予測 2023-2028
- 日本:市場規模と予測 2023-2028
- 市場機会:地域情勢別
第10章 促進要因・課題・機会・抑制要因
- 市場促進要因
- 市場の課題
- 促進要因と課題の影響
- 市場の機会・抑制要因
第11章 競合情勢
- 概要
- 競合情勢
- 混乱の状況
- 業界のリスク
第12章 競合分析
- 企業プロファイル
- 企業の市場ポジショニング
- ABB Ltd.
- ACTUATECH Spa
- AUMA Riester GmbH and Co. KG
- AVK Holding AS
- BOMAFA Armaturen GmbH
- Danfoss AS
- EBRO ARMATUREN Gebr. Broer GmbH
- Emerson Electric Co.
- Flowserve Corp.
- General Electric Co.
- Georg Fischer Ltd.
- Honeywell International Inc.
- MRC Global Inc.
- Rotork Plc
- SAMSON AG
第13章 付録
Exhibits:
- Exhibits1: Executive Summary - Chart on Market Overview
- Exhibits2: Executive Summary - Data Table on Market Overview
- Exhibits3: Executive Summary - Chart on Global Market Characteristics
- Exhibits4: Executive Summary - Chart on Market By Geographical Landscape
- Exhibits5: Executive Summary - Chart on Market Segmentation by Product
- Exhibits6: Executive Summary - Chart on Market Segmentation by End-user
- Exhibits7: Executive Summary - Chart on Incremental Growth
- Exhibits8: Executive Summary - Data Table on Incremental Growth
- Exhibits9: Executive Summary - Chart on Company Market Positioning
- Exhibits10: Parent Market
- Exhibits11: Data Table on - Parent Market
- Exhibits12: Market characteristics analysis
- Exhibits13: Value Chain Analysis
- Exhibits14: Offerings of companies included in the market definition
- Exhibits15: Market segments
- Exhibits16: Chart on Global - Market size and forecast 2023-2028 ($ million)
- Exhibits17: Data Table on Global - Market size and forecast 2023-2028 ($ million)
- Exhibits18: Chart on Global Market: Year-over-year growth 2023-2028 (%)
- Exhibits19: Data Table on Global Market: Year-over-year growth 2023-2028 (%)
- Exhibits20: Historic Market Size - Data Table on Global Industrial Valves And Actuators Market 2018 - 2022 ($ million)
- Exhibits21: Historic Market Size - Product Segment 2018 - 2022 ($ million)
- Exhibits22: Historic Market Size - End-user Segment 2018 - 2022 ($ million)
- Exhibits23: Historic Market Size - Geography Segment 2018 - 2022 ($ million)
- Exhibits24: Historic Market Size - Country Segment 2018 - 2022 ($ million)
- Exhibits25: Five forces analysis - Comparison between 2023 and 2028
- Exhibits26: Bargaining power of buyers - Impact of key factors 2023 and 2028
- Exhibits27: Bargaining power of suppliers - Impact of key factors in 2023 and 2028
- Exhibits28: Threat of new entrants - Impact of key factors in 2023 and 2028
- Exhibits29: Threat of substitutes - Impact of key factors in 2023 and 2028
- Exhibits30: Threat of rivalry - Impact of key factors in 2023 and 2028
- Exhibits31: Chart on Market condition - Five forces 2023 and 2028
- Exhibits32: Chart on Product - Market share 2023-2028 (%)
- Exhibits33: Data Table on Product - Market share 2023-2028 (%)
- Exhibits34: Chart on Comparison by Product
- Exhibits35: Data Table on Comparison by Product
- Exhibits36: Chart on Industrial quarter-turn valves - Market size and forecast 2023-2028 ($ million)
- Exhibits37: Data Table on Industrial quarter-turn valves - Market size and forecast 2023-2028 ($ million)
- Exhibits38: Chart on Industrial quarter-turn valves - Year-over-year growth 2023-2028 (%)
- Exhibits39: Data Table on Industrial quarter-turn valves - Year-over-year growth 2023-2028 (%)
- Exhibits40: Chart on Multi-turn valves - Market size and forecast 2023-2028 ($ million)
- Exhibits41: Data Table on Multi-turn valves - Market size and forecast 2023-2028 ($ million)
- Exhibits42: Chart on Multi-turn valves - Year-over-year growth 2023-2028 (%)
- Exhibits43: Data Table on Multi-turn valves - Year-over-year growth 2023-2028 (%)
- Exhibits44: Chart on Industrial control valves - Market size and forecast 2023-2028 ($ million)
- Exhibits45: Data Table on Industrial control valves - Market size and forecast 2023-2028 ($ million)
- Exhibits46: Chart on Industrial control valves - Year-over-year growth 2023-2028 (%)
- Exhibits47: Data Table on Industrial control valves - Year-over-year growth 2023-2028 (%)
- Exhibits48: Chart on Industrial actuators - Market size and forecast 2023-2028 ($ million)
- Exhibits49: Data Table on Industrial actuators - Market size and forecast 2023-2028 ($ million)
- Exhibits50: Chart on Industrial actuators - Year-over-year growth 2023-2028 (%)
- Exhibits51: Data Table on Industrial actuators - Year-over-year growth 2023-2028 (%)
- Exhibits52: Market opportunity by Product ($ million)
- Exhibits53: Data Table on Market opportunity by Product ($ million)
- Exhibits54: Chart on End-user - Market share 2023-2028 (%)
- Exhibits55: Data Table on End-user - Market share 2023-2028 (%)
- Exhibits56: Chart on Comparison by End-user
- Exhibits57: Data Table on Comparison by End-user
- Exhibits58: Chart on Chemical and petroleum industry - Market size and forecast 2023-2028 ($ million)
- Exhibits59: Data Table on Chemical and petroleum industry - Market size and forecast 2023-2028 ($ million)
- Exhibits60: Chart on Chemical and petroleum industry - Year-over-year growth 2023-2028 (%)
- Exhibits61: Data Table on Chemical and petroleum industry - Year-over-year growth 2023-2028 (%)
- Exhibits62: Chart on Water and wastewater industry - Market size and forecast 2023-2028 ($ million)
- Exhibits63: Data Table on Water and wastewater industry - Market size and forecast 2023-2028 ($ million)
- Exhibits64: Chart on Water and wastewater industry - Year-over-year growth 2023-2028 (%)
- Exhibits65: Data Table on Water and wastewater industry - Year-over-year growth 2023-2028 (%)
- Exhibits66: Chart on Power industry - Market size and forecast 2023-2028 ($ million)
- Exhibits67: Data Table on Power industry - Market size and forecast 2023-2028 ($ million)
- Exhibits68: Chart on Power industry - Year-over-year growth 2023-2028 (%)
- Exhibits69: Data Table on Power industry - Year-over-year growth 2023-2028 (%)
- Exhibits70: Chart on Mining and minerals industry - Market size and forecast 2023-2028 ($ million)
- Exhibits71: Data Table on Mining and minerals industry - Market size and forecast 2023-2028 ($ million)
- Exhibits72: Chart on Mining and minerals industry - Year-over-year growth 2023-2028 (%)
- Exhibits73: Data Table on Mining and minerals industry - Year-over-year growth 2023-2028 (%)
- Exhibits74: Chart on Others - Market size and forecast 2023-2028 ($ million)
- Exhibits75: Data Table on Others - Market size and forecast 2023-2028 ($ million)
- Exhibits76: Chart on Others - Year-over-year growth 2023-2028 (%)
- Exhibits77: Data Table on Others - Year-over-year growth 2023-2028 (%)
- Exhibits78: Market opportunity by End-user ($ million)
- Exhibits79: Data Table on Market opportunity by End-user ($ million)
- Exhibits80: Analysis of price sensitivity, lifecycle, customer purchase basket, adoption rates, and purchase criteria
- Exhibits81: Chart on Market share By Geographical Landscape 2023-2028 (%)
- Exhibits82: Data Table on Market share By Geographical Landscape 2023-2028 (%)
- Exhibits83: Chart on Geographic comparison
- Exhibits84: Data Table on Geographic comparison
- Exhibits85: Chart on APAC - Market size and forecast 2023-2028 ($ million)
- Exhibits86: Data Table on APAC - Market size and forecast 2023-2028 ($ million)
- Exhibits87: Chart on APAC - Year-over-year growth 2023-2028 (%)
- Exhibits88: Data Table on APAC - Year-over-year growth 2023-2028 (%)
- Exhibits89: Chart on Europe - Market size and forecast 2023-2028 ($ million)
- Exhibits90: Data Table on Europe - Market size and forecast 2023-2028 ($ million)
- Exhibits91: Chart on Europe - Year-over-year growth 2023-2028 (%)
- Exhibits92: Data Table on Europe - Year-over-year growth 2023-2028 (%)
- Exhibits93: Chart on North America - Market size and forecast 2023-2028 ($ million)
- Exhibits94: Data Table on North America - Market size and forecast 2023-2028 ($ million)
- Exhibits95: Chart on North America - Year-over-year growth 2023-2028 (%)
- Exhibits96: Data Table on North America - Year-over-year growth 2023-2028 (%)
- Exhibits97: Chart on Middle East and Africa - Market size and forecast 2023-2028 ($ million)
- Exhibits98: Data Table on Middle East and Africa - Market size and forecast 2023-2028 ($ million)
- Exhibits99: Chart on Middle East and Africa - Year-over-year growth 2023-2028 (%)
- Exhibits100: Data Table on Middle East and Africa - Year-over-year growth 2023-2028 (%)
- Exhibits101: Chart on South America - Market size and forecast 2023-2028 ($ million)
- Exhibits102: Data Table on South America - Market size and forecast 2023-2028 ($ million)
- Exhibits103: Chart on South America - Year-over-year growth 2023-2028 (%)
- Exhibits104: Data Table on South America - Year-over-year growth 2023-2028 (%)
- Exhibits105: Chart on China - Market size and forecast 2023-2028 ($ million)
- Exhibits106: Data Table on China - Market size and forecast 2023-2028 ($ million)
- Exhibits107: Chart on China - Year-over-year growth 2023-2028 (%)
- Exhibits108: Data Table on China - Year-over-year growth 2023-2028 (%)
- Exhibits109: Chart on US - Market size and forecast 2023-2028 ($ million)
- Exhibits110: Data Table on US - Market size and forecast 2023-2028 ($ million)
- Exhibits111: Chart on US - Year-over-year growth 2023-2028 (%)
- Exhibits112: Data Table on US - Year-over-year growth 2023-2028 (%)
- Exhibits113: Chart on UK - Market size and forecast 2023-2028 ($ million)
- Exhibits114: Data Table on UK - Market size and forecast 2023-2028 ($ million)
- Exhibits115: Chart on UK - Year-over-year growth 2023-2028 (%)
- Exhibits116: Data Table on UK - Year-over-year growth 2023-2028 (%)
- Exhibits117: Chart on France - Market size and forecast 2023-2028 ($ million)
- Exhibits118: Data Table on France - Market size and forecast 2023-2028 ($ million)
- Exhibits119: Chart on France - Year-over-year growth 2023-2028 (%)
- Exhibits120: Data Table on France - Year-over-year growth 2023-2028 (%)
- Exhibits121: Chart on Japan - Market size and forecast 2023-2028 ($ million)
- Exhibits122: Data Table on Japan - Market size and forecast 2023-2028 ($ million)
- Exhibits123: Chart on Japan - Year-over-year growth 2023-2028 (%)
- Exhibits124: Data Table on Japan - Year-over-year growth 2023-2028 (%)
- Exhibits125: Market opportunity By Geographical Landscape ($ million)
- Exhibits126: Data Tables on Market opportunity By Geographical Landscape ($ million)
- Exhibits127: Impact of drivers and challenges in 2023 and 2028
- Exhibits128: Overview on criticality of inputs and factors of differentiation
- Exhibits129: Overview on factors of disruption
- Exhibits130: Impact of key risks on business
- Exhibits131: Companies covered
- Exhibits132: Matrix on companies position and classification
- Exhibits133: ABB Ltd. - Overview
- Exhibits134: ABB Ltd. - Business segments
- Exhibits135: ABB Ltd. - Key news
- Exhibits136: ABB Ltd. - Key offerings
- Exhibits137: ABB Ltd. - Segment focus
- Exhibits138: ACTUATECH Spa - Overview
- Exhibits139: ACTUATECH Spa - Product / Service
- Exhibits140: ACTUATECH Spa - Key offerings
- Exhibits141: AUMA Riester GmbH and Co. KG - Overview
- Exhibits142: AUMA Riester GmbH and Co. KG - Product / Service
- Exhibits143: AUMA Riester GmbH and Co. KG - Key offerings
- Exhibits144: AVK Holding AS - Overview
- Exhibits145: AVK Holding AS - Product / Service
- Exhibits146: AVK Holding AS - Key offerings
- Exhibits147: BOMAFA Armaturen GmbH - Overview
- Exhibits148: BOMAFA Armaturen GmbH - Product / Service
- Exhibits149: BOMAFA Armaturen GmbH - Key offerings
- Exhibits150: Danfoss AS - Overview
- Exhibits151: Danfoss AS - Product / Service
- Exhibits152: Danfoss AS - Key offerings
- Exhibits153: EBRO ARMATUREN Gebr. Broer GmbH - Overview
- Exhibits154: EBRO ARMATUREN Gebr. Broer GmbH - Product / Service
- Exhibits155: EBRO ARMATUREN Gebr. Broer GmbH - Key offerings
- Exhibits156: Emerson Electric Co. - Overview
- Exhibits157: Emerson Electric Co. - Business segments
- Exhibits158: Emerson Electric Co. - Key news
- Exhibits159: Emerson Electric Co. - Key offerings
- Exhibits160: Emerson Electric Co. - Segment focus
- Exhibits161: Flowserve Corp. - Overview
- Exhibits162: Flowserve Corp. - Business segments
- Exhibits163: Flowserve Corp. - Key offerings
- Exhibits164: Flowserve Corp. - Segment focus
- Exhibits165: General Electric Co. - Overview
- Exhibits166: General Electric Co. - Business segments
- Exhibits167: General Electric Co. - Key news
- Exhibits168: General Electric Co. - Key offerings
- Exhibits169: General Electric Co. - Segment focus
- Exhibits170: Georg Fischer Ltd. - Overview
- Exhibits171: Georg Fischer Ltd. - Business segments
- Exhibits172: Georg Fischer Ltd. - Key offerings
- Exhibits173: Georg Fischer Ltd. - Segment focus
- Exhibits174: Honeywell International Inc. - Overview
- Exhibits175: Honeywell International Inc. - Business segments
- Exhibits176: Honeywell International Inc. - Key news
- Exhibits177: Honeywell International Inc. - Key offerings
- Exhibits178: Honeywell International Inc. - Segment focus
- Exhibits179: MRC Global Inc. - Overview
- Exhibits180: MRC Global Inc. - Business segments
- Exhibits181: MRC Global Inc. - Key offerings
- Exhibits182: MRC Global Inc. - Segment focus
- Exhibits183: Rotork Plc - Overview
- Exhibits184: Rotork Plc - Business segments
- Exhibits185: Rotork Plc - Key offerings
- Exhibits186: Rotork Plc - Segment focus
- Exhibits187: SAMSON AG - Overview
- Exhibits188: SAMSON AG - Product / Service
- Exhibits189: SAMSON AG - Key offerings
- Exhibits190: Inclusions checklist
- Exhibits191: Exclusions checklist
- Exhibits192: Currency conversion rates for US$
- Exhibits193: Research methodology
- Exhibits194: Information sources
- Exhibits195: Data validation
- Exhibits196: Validation techniques employed for market sizing
- Exhibits197: Data synthesis
- Exhibits198: 360 degree market analysis
- Exhibits199: List of abbreviations
Technavio has been monitoring the industrial valves and actuators market and is forecast to grow by $ 18679 mn during 2023-2028, accelerating at a CAGR of 4.85% during the forecast period. Our report on the industrial valves and actuators market provides a holistic analysis, market size and forecast, trends, growth drivers, and challenges, as well as vendor analysis covering around 25 vendors.
The report offers an up-to-date analysis regarding the current market scenario, the latest trends and drivers, and the overall market environment. The market is driven by increasing investments in modernizing industrial facilities, capitalization of growth momentum in the oil and gas pipeline market, and stringent government regulations.
Technavio's industrial valves and actuators market is segmented as below:
| Market Scope | |
|---|---|
| Base Year | 2024 |
| End Year | 2028 |
| Series Year | 2024-2028 |
| Growth Momentum | Accelerate |
| YOY 2024 | 4.54% |
| CAGR | 4.85% |
| Incremental Value | $18679mn |
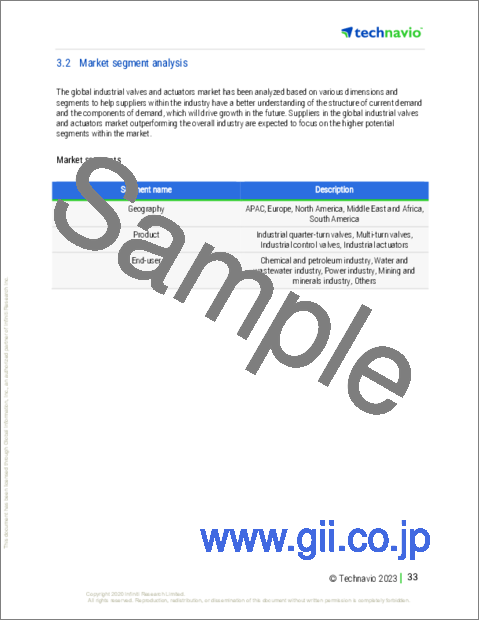
By Product
- Industrial quarter-turn valves
- Multi-turn valves
- Industrial control valves
- Industrial actuators
By End-user
- Chemical and petroleum industry
- Water and wastewater industry
- Power industry
- Mining and minerals industry
- Others
By Geographical Landscape
- APAC
- Europe
- North America
- Middle East and Africa
- South America
This study identifies the evolution of valve diagnostics as one of the prime reasons driving the industrial valves and actuators market growth during the next few years. Also, growing application of simulation software and rising investments in chemical manufacturing facilities in emerging economies will lead to sizable demand in the market.
Technavio presents a detailed picture of the market by the way of study, synthesis, and summation of data from multiple sources by an analysis of key parameters. Our report on the industrial valves and actuators market covers the following areas:
- Industrial valves and actuators market sizing
- Industrial valves and actuators market forecast
- Industrial valves and actuators market industry analysis
Technavio's robust vendor analysis is designed to help clients improve their market position, and in line with this, this report provides a detailed analysis of several leading industrial valves and actuators market vendors that include ABB Ltd., ACTUATECH Spa, AUMA Riester GmbH and Co. KG, Automation Technology Inc., AVK Holding AS, BOMAFA Armaturen GmbH, Danfoss AS, EBRO ARMATUREN Gebr. Broer GmbH, Emerson Electric Co., Flowserve Corp., General Electric Co., Georg Fischer Ltd., Honeywell International Inc., MRC Global Inc., Rotork Plc, SAMSON AG, Schlumberger Ltd., The Weir Group Plc, Velan Inc., and WAMGROUP Spa. Also, the industrial valves and actuators market analysis report includes information on upcoming trends and challenges that will influence market growth. This is to help companies strategize and leverage all forthcoming growth opportunities.
The study was conducted using an objective combination of primary and secondary information including inputs from key participants in the industry. The report contains a comprehensive market and vendor landscape in addition to an analysis of the key vendors.
Technavio presents a detailed picture of the market by the way of study, synthesis, and summation of data from multiple sources by an analysis of key parameters such as profit, pricing, competition, and promotions. It presents various market facets by identifying the key industry influencers. The data presented is comprehensive, reliable, and a result of extensive research - both primary and secondary. Technavio's market research reports provide a complete competitive landscape and an in-depth vendor selection methodology and analysis using qualitative and quantitative research to forecast accurate market growth.
Table of Contents
1 Executive Summary
- 1.1 Market overview
- Executive Summary - Chart on Market Overview
- Executive Summary - Data Table on Market Overview
- Executive Summary - Chart on Global Market Characteristics
- Executive Summary - Chart on Market By Geographical Landscape
- Executive Summary - Chart on Market Segmentation by Product
- Executive Summary - Chart on Market Segmentation by End-user
- Executive Summary - Chart on Incremental Growth
- Executive Summary - Data Table on Incremental Growth
- Executive Summary - Chart on Company Market Positioning
2 Market Landscape
- 2.1 Market ecosystem
- Parent Market
- Data Table on - Parent Market
- 2.2 Market characteristics
- Market characteristics analysis
- 2.3 Value chain analysis
- Value Chain Analysis
3 Market Sizing
- 3.1 Market definition
- Offerings of companies included in the market definition
- 3.2 Market segment analysis
- Market segments
- 3.3 Market size 2023
- 3.4 Market outlook: Forecast for 2023-2028
- Chart on Global - Market size and forecast 2023-2028 ($ million)
- Data Table on Global - Market size and forecast 2023-2028 ($ million)
- Chart on Global Market: Year-over-year growth 2023-2028 (%)
- Data Table on Global Market: Year-over-year growth 2023-2028 (%)
4 Historic Market Size
- 4.1 Global Industrial Valves And Actuators Market 2018 - 2022
- Historic Market Size - Data Table on Global Industrial Valves And Actuators Market 2018 - 2022 ($ million)
- 4.2 Product segment analysis 2018 - 2022
- Historic Market Size - Product Segment 2018 - 2022 ($ million)
- 4.3 End-user segment analysis 2018 - 2022
- Historic Market Size - End-user Segment 2018 - 2022 ($ million)
- 4.4 Geography segment analysis 2018 - 2022
- Historic Market Size - Geography Segment 2018 - 2022 ($ million)
- 4.5 Country segment analysis 2018 - 2022
- Historic Market Size - Country Segment 2018 - 2022 ($ million)
5 Five Forces Analysis
- 5.1 Five forces summary
- Five forces analysis - Comparison between 2023 and 2028
- 5.2 Bargaining power of buyers
- Bargaining power of buyers - Impact of key factors 2023 and 2028
- 5.3 Bargaining power of suppliers
- Bargaining power of suppliers - Impact of key factors in 2023 and 2028
- 5.4 Threat of new entrants
- Threat of new entrants - Impact of key factors in 2023 and 2028
- 5.5 Threat of substitutes
- Threat of substitutes - Impact of key factors in 2023 and 2028
- 5.6 Threat of rivalry
- Threat of rivalry - Impact of key factors in 2023 and 2028
- 5.7 Market condition
- Chart on Market condition - Five forces 2023 and 2028
6 Market Segmentation by Product
- 6.1 Market segments
- Chart on Product - Market share 2023-2028 (%)
- Data Table on Product - Market share 2023-2028 (%)
- 6.2 Comparison by Product
- Chart on Comparison by Product
- Data Table on Comparison by Product
- 6.3 Industrial quarter-turn valves - Market size and forecast 2023-2028
- Chart on Industrial quarter-turn valves - Market size and forecast 2023-2028 ($ million)
- Data Table on Industrial quarter-turn valves - Market size and forecast 2023-2028 ($ million)
- Chart on Industrial quarter-turn valves - Year-over-year growth 2023-2028 (%)
- Data Table on Industrial quarter-turn valves - Year-over-year growth 2023-2028 (%)
- 6.4 Multi-turn valves - Market size and forecast 2023-2028
- Chart on Multi-turn valves - Market size and forecast 2023-2028 ($ million)
- Data Table on Multi-turn valves - Market size and forecast 2023-2028 ($ million)
- Chart on Multi-turn valves - Year-over-year growth 2023-2028 (%)
- Data Table on Multi-turn valves - Year-over-year growth 2023-2028 (%)
- 6.5 Industrial control valves - Market size and forecast 2023-2028
- Chart on Industrial control valves - Market size and forecast 2023-2028 ($ million)
- Data Table on Industrial control valves - Market size and forecast 2023-2028 ($ million)
- Chart on Industrial control valves - Year-over-year growth 2023-2028 (%)
- Data Table on Industrial control valves - Year-over-year growth 2023-2028 (%)
- 6.6 Industrial actuators - Market size and forecast 2023-2028
- Chart on Industrial actuators - Market size and forecast 2023-2028 ($ million)
- Data Table on Industrial actuators - Market size and forecast 2023-2028 ($ million)
- Chart on Industrial actuators - Year-over-year growth 2023-2028 (%)
- Data Table on Industrial actuators - Year-over-year growth 2023-2028 (%)
- 6.7 Market opportunity by Product
- Market opportunity by Product ($ million)
- Data Table on Market opportunity by Product ($ million)
7 Market Segmentation by End-user
- 7.1 Market segments
- Chart on End-user - Market share 2023-2028 (%)
- Data Table on End-user - Market share 2023-2028 (%)
- 7.2 Comparison by End-user
- Chart on Comparison by End-user
- Data Table on Comparison by End-user
- 7.3 Chemical and petroleum industry - Market size and forecast 2023-2028
- Chart on Chemical and petroleum industry - Market size and forecast 2023-2028 ($ million)
- Data Table on Chemical and petroleum industry - Market size and forecast 2023-2028 ($ million)
- Chart on Chemical and petroleum industry - Year-over-year growth 2023-2028 (%)
- Data Table on Chemical and petroleum industry - Year-over-year growth 2023-2028 (%)
- 7.4 Water and wastewater industry - Market size and forecast 2023-2028
- Chart on Water and wastewater industry - Market size and forecast 2023-2028 ($ million)
- Data Table on Water and wastewater industry - Market size and forecast 2023-2028 ($ million)
- Chart on Water and wastewater industry - Year-over-year growth 2023-2028 (%)
- Data Table on Water and wastewater industry - Year-over-year growth 2023-2028 (%)
- 7.5 Power industry - Market size and forecast 2023-2028
- Chart on Power industry - Market size and forecast 2023-2028 ($ million)
- Data Table on Power industry - Market size and forecast 2023-2028 ($ million)
- Chart on Power industry - Year-over-year growth 2023-2028 (%)
- Data Table on Power industry - Year-over-year growth 2023-2028 (%)
- 7.6 Mining and minerals industry - Market size and forecast 2023-2028
- Chart on Mining and minerals industry - Market size and forecast 2023-2028 ($ million)
- Data Table on Mining and minerals industry - Market size and forecast 2023-2028 ($ million)
- Chart on Mining and minerals industry - Year-over-year growth 2023-2028 (%)
- Data Table on Mining and minerals industry - Year-over-year growth 2023-2028 (%)
- 7.7 Others - Market size and forecast 2023-2028
- Chart on Others - Market size and forecast 2023-2028 ($ million)
- Data Table on Others - Market size and forecast 2023-2028 ($ million)
- Chart on Others - Year-over-year growth 2023-2028 (%)
- Data Table on Others - Year-over-year growth 2023-2028 (%)
- 7.8 Market opportunity by End-user
- Market opportunity by End-user ($ million)
- Data Table on Market opportunity by End-user ($ million)
8 Customer Landscape
- 8.1 Customer landscape overview
- Analysis of price sensitivity, lifecycle, customer purchase basket, adoption rates, and purchase criteria
9 Geographic Landscape
- 9.1 Geographic segmentation
- Chart on Market share By Geographical Landscape 2023-2028 (%)
- Data Table on Market share By Geographical Landscape 2023-2028 (%)
- 9.2 Geographic comparison
- Chart on Geographic comparison
- Data Table on Geographic comparison
- 9.3 APAC - Market size and forecast 2023-2028
- Chart on APAC - Market size and forecast 2023-2028 ($ million)
- Data Table on APAC - Market size and forecast 2023-2028 ($ million)
- Chart on APAC - Year-over-year growth 2023-2028 (%)
- Data Table on APAC - Year-over-year growth 2023-2028 (%)
- 9.4 Europe - Market size and forecast 2023-2028
- Chart on Europe - Market size and forecast 2023-2028 ($ million)
- Data Table on Europe - Market size and forecast 2023-2028 ($ million)
- Chart on Europe - Year-over-year growth 2023-2028 (%)
- Data Table on Europe - Year-over-year growth 2023-2028 (%)
- 9.5 North America - Market size and forecast 2023-2028
- Chart on North America - Market size and forecast 2023-2028 ($ million)
- Data Table on North America - Market size and forecast 2023-2028 ($ million)
- Chart on North America - Year-over-year growth 2023-2028 (%)
- Data Table on North America - Year-over-year growth 2023-2028 (%)
- 9.6 Middle East and Africa - Market size and forecast 2023-2028
- Chart on Middle East and Africa - Market size and forecast 2023-2028 ($ million)
- Data Table on Middle East and Africa - Market size and forecast 2023-2028 ($ million)
- Chart on Middle East and Africa - Year-over-year growth 2023-2028 (%)
- Data Table on Middle East and Africa - Year-over-year growth 2023-2028 (%)
- 9.7 South America - Market size and forecast 2023-2028
- Chart on South America - Market size and forecast 2023-2028 ($ million)
- Data Table on South America - Market size and forecast 2023-2028 ($ million)
- Chart on South America - Year-over-year growth 2023-2028 (%)
- Data Table on South America - Year-over-year growth 2023-2028 (%)
- 9.8 China - Market size and forecast 2023-2028
- Chart on China - Market size and forecast 2023-2028 ($ million)
- Data Table on China - Market size and forecast 2023-2028 ($ million)
- Chart on China - Year-over-year growth 2023-2028 (%)
- Data Table on China - Year-over-year growth 2023-2028 (%)
- 9.9 US - Market size and forecast 2023-2028
- Chart on US - Market size and forecast 2023-2028 ($ million)
- Data Table on US - Market size and forecast 2023-2028 ($ million)
- Chart on US - Year-over-year growth 2023-2028 (%)
- Data Table on US - Year-over-year growth 2023-2028 (%)
- 9.10 UK - Market size and forecast 2023-2028
- Chart on UK - Market size and forecast 2023-2028 ($ million)
- Data Table on UK - Market size and forecast 2023-2028 ($ million)
- Chart on UK - Year-over-year growth 2023-2028 (%)
- Data Table on UK - Year-over-year growth 2023-2028 (%)
- 9.11 France - Market size and forecast 2023-2028
- Chart on France - Market size and forecast 2023-2028 ($ million)
- Data Table on France - Market size and forecast 2023-2028 ($ million)
- Chart on France - Year-over-year growth 2023-2028 (%)
- Data Table on France - Year-over-year growth 2023-2028 (%)
- 9.12 Japan - Market size and forecast 2023-2028
- Chart on Japan - Market size and forecast 2023-2028 ($ million)
- Data Table on Japan - Market size and forecast 2023-2028 ($ million)
- Chart on Japan - Year-over-year growth 2023-2028 (%)
- Data Table on Japan - Year-over-year growth 2023-2028 (%)
- 9.13 Market opportunity By Geographical Landscape
- Market opportunity By Geographical Landscape ($ million)
- Data Tables on Market opportunity By Geographical Landscape ($ million)
10 Drivers, Challenges, and Opportunity/Restraints
- 10.1 Market drivers
- 10.2 Market challenges
- 10.3 Impact of drivers and challenges
- Impact of drivers and challenges in 2023 and 2028
- 10.4 Market opportunities/restraints
11 Competitive Landscape
- 11.1 Overview
- 11.2 Competitive Landscape
- Overview on criticality of inputs and factors of differentiation
- 11.3 Landscape disruption
- Overview on factors of disruption
- 11.4 Industry risks
- Impact of key risks on business
12 Competitive Analysis
- 12.1 Companies profiled
- Companies covered
- 12.2 Market positioning of companies
- Matrix on companies position and classification
- 12.3 ABB Ltd.
- ABB Ltd. - Overview
- ABB Ltd. - Business segments
- ABB Ltd. - Key news
- ABB Ltd. - Key offerings
- ABB Ltd. - Segment focus
- 12.4 ACTUATECH Spa
- ACTUATECH Spa - Overview
- ACTUATECH Spa - Product / Service
- ACTUATECH Spa - Key offerings
- 12.5 AUMA Riester GmbH and Co. KG
- AUMA Riester GmbH and Co. KG - Overview
- AUMA Riester GmbH and Co. KG - Product / Service
- AUMA Riester GmbH and Co. KG - Key offerings
- 12.6 AVK Holding AS
- AVK Holding AS - Overview
- AVK Holding AS - Product / Service
- AVK Holding AS - Key offerings
- 12.7 BOMAFA Armaturen GmbH
- BOMAFA Armaturen GmbH - Overview
- BOMAFA Armaturen GmbH - Product / Service
- BOMAFA Armaturen GmbH - Key offerings
- 12.8 Danfoss AS
- Danfoss AS - Overview
- Danfoss AS - Product / Service
- Danfoss AS - Key offerings
- 12.9 EBRO ARMATUREN Gebr. Broer GmbH
- EBRO ARMATUREN Gebr. Broer GmbH - Overview
- EBRO ARMATUREN Gebr. Broer GmbH - Product / Service
- EBRO ARMATUREN Gebr. Broer GmbH - Key offerings
- 12.10 Emerson Electric Co.
- Emerson Electric Co. - Overview
- Emerson Electric Co. - Business segments
- Emerson Electric Co. - Key news
- Emerson Electric Co. - Key offerings
- Emerson Electric Co. - Segment focus
- 12.11 Flowserve Corp.
- Flowserve Corp. - Overview
- Flowserve Corp. - Business segments
- Flowserve Corp. - Key offerings
- Flowserve Corp. - Segment focus
- 12.12 General Electric Co.
- General Electric Co. - Overview
- General Electric Co. - Business segments
- General Electric Co. - Key news
- General Electric Co. - Key offerings
- General Electric Co. - Segment focus
- 12.13 Georg Fischer Ltd.
- Georg Fischer Ltd. - Overview
- Georg Fischer Ltd. - Business segments
- Georg Fischer Ltd. - Key offerings
- Georg Fischer Ltd. - Segment focus
- 12.14 Honeywell International Inc.
- Honeywell International Inc. - Overview
- Honeywell International Inc. - Business segments
- Honeywell International Inc. - Key news
- Honeywell International Inc. - Key offerings
- Honeywell International Inc. - Segment focus
- 12.15 MRC Global Inc.
- MRC Global Inc. - Overview
- MRC Global Inc. - Business segments
- MRC Global Inc. - Key offerings
- MRC Global Inc. - Segment focus
- 12.16 Rotork Plc
- Rotork Plc - Overview
- Rotork Plc - Business segments
- Rotork Plc - Key offerings
- Rotork Plc - Segment focus
- 12.17 SAMSON AG
- SAMSON AG - Overview
- SAMSON AG - Product / Service
- SAMSON AG - Key offerings
13 Appendix
- 13.1 Scope of the report
- 13.2 Inclusions and exclusions checklist
- Inclusions checklist
- Exclusions checklist
- 13.3 Currency conversion rates for US$
- Currency conversion rates for US$
- 13.4 Research methodology
- Research methodology
- 13.5 Data procurement
- Information sources
- 13.6 Data validation
- Data validation
- 13.7 Validation techniques employed for market sizing
- Validation techniques employed for market sizing
- 13.8 Data synthesis
- Data synthesis
- 13.9 360 degree market analysis
- 360 degree market analysis
- 13.10 List of abbreviations
- List of abbreviations
