|
|
市場調査レポート
商品コード
1502352
ピコプロジェクターの世界市場 2024-2028Global pico projectors market 2024-2028 |
||||||

|
|||||||
カスタマイズ可能
|
|||||||

| ピコプロジェクターの世界市場 2024-2028 |
|
出版日: 2024年05月17日
発行: TechNavio
ページ情報: 英文 174 Pages
納期: 即納可能
|

全表示
- 概要
- 図表
- 目次
Technavio社は、ピコプロジェクター市場をモニターしており、2023年から2028年にかけて16億8,730万米ドル、予測期間中のCAGRは10.87%で成長すると予測しています。
当レポートでは、ピコプロジェクター市場の全体的な分析、市場規模・予測、動向、成長促進要因、課題、約25のベンダーを網羅したベンダー分析などを掲載しています。
現在の市場シナリオ、最新動向と促進要因、市場環境全体に関する最新分析を提供しています。市場は、スマートフォンへのピコプロジェクター搭載の増加、ASPの減少、ピコプロジェクターにおけるLCOS技術の採用増加などが牽引しています。
| 市場範囲 | |
|---|---|
| 基準年 | 2024 |
| 終了年 | 2028 |
| 予測期間 | 2024-2028 |
| 成長モメンタム | 加速 |
| 前年比2024年 | 9.53% |
| CAGR | 10.87% |
| 増分額 | 16億8,730万米ドル |
本調査では、今後数年間のピコプロジェクター市場成長を牽引する主要因の1つとして、ピコプロジェクタ性能向上のためのレーザー技術へのシフトを挙げています。また、組み込みピコプロジェクターの採用が多く、家庭用電子機器への支出が増加していることも、市場の大きな需要につながります。
目次
第1章 エグゼクティブサマリー
- 市場概要
第2章 市場情勢
- 市場エコシステム
- 市場の特徴
- バリューチェーン分析
第3章 市場規模の評価
- 市場の定義
- 市場セグメント分析
- 市場規模 2023
- 市場の見通し 2023-2028
第4章 市場規模実績
- 世界ピコプロジェクター市場 2018-2022
- タイプ別セグメント分析 2018-2022
- 技術別セグメント分析 2018-2022
- 地域別セグメント分析 2018-2022
- 国別セグメント分析 2018-2022
第5章 ファイブフォース分析
- ファイブフォースの要約
- 買い手の交渉力
- 供給企業の交渉力
- 新規参入業者の脅威
- 代替品の脅威
- 競争の脅威
- 市況
第6章 市場セグメンテーション:タイプ別
- 市場セグメンテーション
- 比較:タイプ別
- 埋め込み:市場規模と予測 2023-2028
- スタンドアロン:市場規模と予測 2023-2028
- 市場機会:タイプ別
第7章 市場セグメンテーション:技術別
- 市場セグメンテーション
- 比較:技術別
- DLPプロジェクター:市場規模と予測 2023-2028
- LCOSプロジェクター:市場規模と予測 2023-2028
- LBSプロジェクター:市場規模と予測 2023-2028
- 市場機会:技術別
第8章 顧客情勢
- 顧客情勢の概要
第9章 地域別情勢
- 地域別セグメンテーション
- 地域別比較
- 北米:市場規模と予測 2023-2028
- アジア太平洋:市場規模と予測 2023-2028
- 欧州:市場規模と予測 2023-2028
- 南米:市場規模と予測 2023-2028
- 中東・アフリカ:市場規模と予測 2023-2028
- 米国:市場規模と予測 2023-2028
- 中国:市場規模と予測 2023-2028
- ドイツ:市場規模と予測 2023-2028
- 英国:市場規模と予測 2023-2028
- 日本:市場規模と予測 2023-2028
- 市場機会:地域別
第10章 促進要因・課題・機会・抑制要因
- 市場促進要因
- 市場の課題
- 促進要因と課題の影響
- 市場の機会・抑制要因
第11章 競合情勢
- 概要
- 競合情勢
- 混乱の状況
- 業界のリスク
第12章 競合分析
- 企業プロファイル
- 企業の市場ポジショニング
- AAXA Technologies Inc.
- Acer Inc.
- Akaso
- ASUSTeK Computer Inc.
- B and H Foto and Electronics Corp.
- Canon Inc.
- Eastman Kodak Co.
- Koninklijke Philips N.V.
- Magnasonic
- MicroVision Inc.
- Ricoh Co. Ltd.
- Samsung Electronics Co. Ltd.
- Sony Group Corp.
- Syndiant
- Texas Instruments Inc.
第13章 付録
Exhibits:
- Exhibits1: Executive Summary - Chart on Market Overview
- Exhibits2: Executive Summary - Data Table on Market Overview
- Exhibits3: Executive Summary - Chart on Global Market Characteristics
- Exhibits4: Executive Summary - Chart on Market by Geography
- Exhibits5: Executive Summary - Chart on Market Segmentation by Type
- Exhibits6: Executive Summary - Chart on Market Segmentation by Technology
- Exhibits7: Executive Summary - Chart on Incremental Growth
- Exhibits8: Executive Summary - Data Table on Incremental Growth
- Exhibits9: Executive Summary - Chart on Company Market Positioning
- Exhibits10: Parent Market
- Exhibits11: Data Table on - Parent Market
- Exhibits12: Market characteristics analysis
- Exhibits13: Value Chain Analysis
- Exhibits14: Offerings of companies included in the market definition
- Exhibits15: Market segments
- Exhibits16: Chart on Global - Market size and forecast 2023-2028 ($ million)
- Exhibits17: Data Table on Global - Market size and forecast 2023-2028 ($ million)
- Exhibits18: Chart on Global Market: Year-over-year growth 2023-2028 (%)
- Exhibits19: Data Table on Global Market: Year-over-year growth 2023-2028 (%)
- Exhibits20: Historic Market Size - Data Table on Global Pico Projectors Market 2018 - 2022 ($ million)
- Exhibits21: Historic Market Size - Type Segment 2018 - 2022 ($ million)
- Exhibits22: Historic Market Size - Technology Segment 2018 - 2022 ($ million)
- Exhibits23: Historic Market Size - Geography Segment 2018 - 2022 ($ million)
- Exhibits24: Historic Market Size - Country Segment 2018 - 2022 ($ million)
- Exhibits25: Five forces analysis - Comparison between 2023 and 2028
- Exhibits26: Bargaining power of buyers - Impact of key factors 2023 and 2028
- Exhibits27: Bargaining power of suppliers - Impact of key factors in 2023 and 2028
- Exhibits28: Threat of new entrants - Impact of key factors in 2023 and 2028
- Exhibits29: Threat of substitutes - Impact of key factors in 2023 and 2028
- Exhibits30: Threat of rivalry - Impact of key factors in 2023 and 2028
- Exhibits31: Chart on Market condition - Five forces 2023 and 2028
- Exhibits32: Chart on Type - Market share 2023-2028 (%)
- Exhibits33: Data Table on Type - Market share 2023-2028 (%)
- Exhibits34: Chart on Comparison by Type
- Exhibits35: Data Table on Comparison by Type
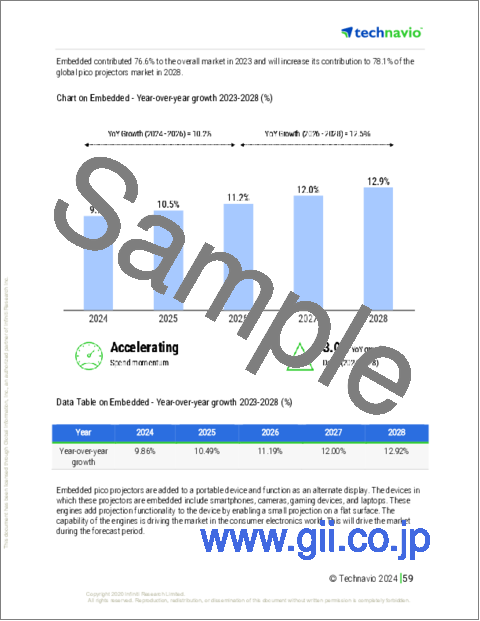
- Exhibits36: Chart on Embedded - Market size and forecast 2023-2028 ($ million)
- Exhibits37: Data Table on Embedded - Market size and forecast 2023-2028 ($ million)
- Exhibits38: Chart on Embedded - Year-over-year growth 2023-2028 (%)
- Exhibits39: Data Table on Embedded - Year-over-year growth 2023-2028 (%)
- Exhibits40: Chart on Standalone - Market size and forecast 2023-2028 ($ million)
- Exhibits41: Data Table on Standalone - Market size and forecast 2023-2028 ($ million)
- Exhibits42: Chart on Standalone - Year-over-year growth 2023-2028 (%)
- Exhibits43: Data Table on Standalone - Year-over-year growth 2023-2028 (%)
- Exhibits44: Market opportunity by Type ($ million)
- Exhibits45: Data Table on Market opportunity by Type ($ million)
- Exhibits46: Chart on Technology - Market share 2023-2028 (%)
- Exhibits47: Data Table on Technology - Market share 2023-2028 (%)
- Exhibits48: Chart on Comparison by Technology
- Exhibits49: Data Table on Comparison by Technology
- Exhibits50: Chart on DLP - Market size and forecast 2023-2028 ($ million)
- Exhibits51: Data Table on DLP - Market size and forecast 2023-2028 ($ million)
- Exhibits52: Chart on DLP - Year-over-year growth 2023-2028 (%)
- Exhibits53: Data Table on DLP - Year-over-year growth 2023-2028 (%)
- Exhibits54: Chart on LCOS - Market size and forecast 2023-2028 ($ million)
- Exhibits55: Data Table on LCOS - Market size and forecast 2023-2028 ($ million)
- Exhibits56: Chart on LCOS - Year-over-year growth 2023-2028 (%)
- Exhibits57: Data Table on LCOS - Year-over-year growth 2023-2028 (%)
- Exhibits58: Chart on LBS - Market size and forecast 2023-2028 ($ million)
- Exhibits59: Data Table on LBS - Market size and forecast 2023-2028 ($ million)
- Exhibits60: Chart on LBS - Year-over-year growth 2023-2028 (%)
- Exhibits61: Data Table on LBS - Year-over-year growth 2023-2028 (%)
- Exhibits62: Market opportunity by Technology ($ million)
- Exhibits63: Data Table on Market opportunity by Technology ($ million)
- Exhibits64: Analysis of price sensitivity, lifecycle, customer purchase basket, adoption rates, and purchase criteria
- Exhibits65: Chart on Market share By Geographical Landscape2023-2028 (%)
- Exhibits66: Data Table on Market share By Geographical Landscape2023-2028 (%)
- Exhibits67: Chart on Geographic comparison
- Exhibits68: Data Table on Geographic comparison
- Exhibits69: Chart on North America - Market size and forecast 2023-2028 ($ million)
- Exhibits70: Data Table on North America - Market size and forecast 2023-2028 ($ million)
- Exhibits71: Chart on North America - Year-over-year growth 2023-2028 (%)
- Exhibits72: Data Table on North America - Year-over-year growth 2023-2028 (%)
- Exhibits73: Chart on APAC - Market size and forecast 2023-2028 ($ million)
- Exhibits74: Data Table on APAC - Market size and forecast 2023-2028 ($ million)
- Exhibits75: Chart on APAC - Year-over-year growth 2023-2028 (%)
- Exhibits76: Data Table on APAC - Year-over-year growth 2023-2028 (%)
- Exhibits77: Chart on Europe - Market size and forecast 2023-2028 ($ million)
- Exhibits78: Data Table on Europe - Market size and forecast 2023-2028 ($ million)
- Exhibits79: Chart on Europe - Year-over-year growth 2023-2028 (%)
- Exhibits80: Data Table on Europe - Year-over-year growth 2023-2028 (%)
- Exhibits81: Chart on South America - Market size and forecast 2023-2028 ($ million)
- Exhibits82: Data Table on South America - Market size and forecast 2023-2028 ($ million)
- Exhibits83: Chart on South America - Year-over-year growth 2023-2028 (%)
- Exhibits84: Data Table on South America - Year-over-year growth 2023-2028 (%)
- Exhibits85: Chart on Middle East and Africa - Market size and forecast 2023-2028 ($ million)
- Exhibits86: Data Table on Middle East and Africa - Market size and forecast 2023-2028 ($ million)
- Exhibits87: Chart on Middle East and Africa - Year-over-year growth 2023-2028 (%)
- Exhibits88: Data Table on Middle East and Africa - Year-over-year growth 2023-2028 (%)
- Exhibits89: Chart on US - Market size and forecast 2023-2028 ($ million)
- Exhibits90: Data Table on US - Market size and forecast 2023-2028 ($ million)
- Exhibits91: Chart on US - Year-over-year growth 2023-2028 (%)
- Exhibits92: Data Table on US - Year-over-year growth 2023-2028 (%)
- Exhibits93: Chart on China - Market size and forecast 2023-2028 ($ million)
- Exhibits94: Data Table on China - Market size and forecast 2023-2028 ($ million)
- Exhibits95: Chart on China - Year-over-year growth 2023-2028 (%)
- Exhibits96: Data Table on China - Year-over-year growth 2023-2028 (%)
- Exhibits97: Chart on Germany - Market size and forecast 2023-2028 ($ million)
- Exhibits98: Data Table on Germany - Market size and forecast 2023-2028 ($ million)
- Exhibits99: Chart on Germany - Year-over-year growth 2023-2028 (%)
- Exhibits100: Data Table on Germany - Year-over-year growth 2023-2028 (%)
- Exhibits101: Chart on UK - Market size and forecast 2023-2028 ($ million)
- Exhibits102: Data Table on UK - Market size and forecast 2023-2028 ($ million)
- Exhibits103: Chart on UK - Year-over-year growth 2023-2028 (%)
- Exhibits104: Data Table on UK - Year-over-year growth 2023-2028 (%)
- Exhibits105: Chart on Japan - Market size and forecast 2023-2028 ($ million)
- Exhibits106: Data Table on Japan - Market size and forecast 2023-2028 ($ million)
- Exhibits107: Chart on Japan - Year-over-year growth 2023-2028 (%)
- Exhibits108: Data Table on Japan - Year-over-year growth 2023-2028 (%)
- Exhibits109: Market opportunity By Geographical Landscape($ million)
- Exhibits110: Data Tables on Market opportunity By Geographical Landscape($ million)
- Exhibits111: Impact of drivers and challenges in 2023 and 2028
- Exhibits112: Overview on criticality of inputs and factors of differentiation
- Exhibits113: Overview on factors of disruption
- Exhibits114: Impact of key risks on business
- Exhibits115: Companies covered
- Exhibits116: Matrix on companies position and classification
- Exhibits117: AAXA Technologies Inc. - Overview
- Exhibits118: AAXA Technologies Inc. - Product / Service
- Exhibits119: AAXA Technologies Inc. - Key offerings
- Exhibits120: Acer Inc. - Overview
- Exhibits121: Acer Inc. - Business segments
- Exhibits122: Acer Inc. - Key news
- Exhibits123: Acer Inc. - Key offerings
- Exhibits124: Acer Inc. - Segment focus
- Exhibits125: Akaso - Overview
- Exhibits126: Akaso - Product / Service
- Exhibits127: Akaso - Key offerings
- Exhibits128: ASUSTeK Computer Inc. - Overview
- Exhibits129: ASUSTeK Computer Inc. - Product / Service
- Exhibits130: ASUSTeK Computer Inc. - Key news
- Exhibits131: ASUSTeK Computer Inc. - Key offerings
- Exhibits132: B and H Foto and Electronics Corp. - Overview
- Exhibits133: B and H Foto and Electronics Corp. - Product / Service
- Exhibits134: B and H Foto and Electronics Corp. - Key offerings
- Exhibits135: Canon Inc. - Overview
- Exhibits136: Canon Inc. - Business segments
- Exhibits137: Canon Inc. - Key offerings
- Exhibits138: Canon Inc. - Segment focus
- Exhibits139: Eastman Kodak Co. - Overview
- Exhibits140: Eastman Kodak Co. - Business segments
- Exhibits141: Eastman Kodak Co. - Key news
- Exhibits142: Eastman Kodak Co. - Key offerings
- Exhibits143: Eastman Kodak Co. - Segment focus
- Exhibits144: Koninklijke Philips N.V. - Overview
- Exhibits145: Koninklijke Philips N.V. - Business segments
- Exhibits146: Koninklijke Philips N.V. - Key news
- Exhibits147: Koninklijke Philips N.V. - Key offerings
- Exhibits148: Koninklijke Philips N.V. - Segment focus
- Exhibits149: Magnasonic - Overview
- Exhibits150: Magnasonic - Product / Service
- Exhibits151: Magnasonic - Key offerings
- Exhibits152: MicroVision Inc. - Overview
- Exhibits153: MicroVision Inc. - Product / Service
- Exhibits154: MicroVision Inc. - Key offerings
- Exhibits155: Ricoh Co. Ltd. - Overview
- Exhibits156: Ricoh Co. Ltd. - Business segments
- Exhibits157: Ricoh Co. Ltd. - Key offerings
- Exhibits158: Ricoh Co. Ltd. - Segment focus
- Exhibits159: Samsung Electronics Co. Ltd. - Overview
- Exhibits160: Samsung Electronics Co. Ltd. - Business segments
- Exhibits161: Samsung Electronics Co. Ltd. - Key news
- Exhibits162: Samsung Electronics Co. Ltd. - Key offerings
- Exhibits163: Samsung Electronics Co. Ltd. - Segment focus
- Exhibits164: Sony Group Corp. - Overview
- Exhibits165: Sony Group Corp. - Business segments
- Exhibits166: Sony Group Corp. - Key news
- Exhibits167: Sony Group Corp. - Key offerings
- Exhibits168: Sony Group Corp. - Segment focus
- Exhibits169: Syndiant - Overview
- Exhibits170: Syndiant - Product / Service
- Exhibits171: Syndiant - Key offerings
- Exhibits172: Texas Instruments Inc. - Overview
- Exhibits173: Texas Instruments Inc. - Business segments
- Exhibits174: Texas Instruments Inc. - Key news
- Exhibits175: Texas Instruments Inc. - Key offerings
- Exhibits176: Texas Instruments Inc. - Segment focus
- Exhibits177: Inclusions checklist
- Exhibits178: Exclusions checklist
- Exhibits179: Currency conversion rates for US$
- Exhibits180: Research methodology
- Exhibits181: Information sources
- Exhibits182: Data validation
- Exhibits183: Validation techniques employed for market sizing
- Exhibits184: Data synthesis
- Exhibits185: 360 degree market analysis
- Exhibits186: List of abbreviations
Technavio has been monitoring the pico projectors market and is forecast to grow by USD 1687.3 mn during 2023-2028, accelerating at a CAGR of 10.87% during the forecast period. Our report on the pico projectors market provides a holistic analysis, market size and forecast, trends, growth drivers, and challenges, as well as vendor analysis covering around 25 vendors.
The report offers an up-to-date analysis regarding the current market scenario, the latest trends and drivers, and the overall market environment. The market is driven by increasing integration of pico projectors in smartphones, decline in asp, and increasing adoption of lcos technology in pico projectors.
Technavio's pico projectors market is segmented as below:
| Market Scope | |
|---|---|
| Base Year | 2024 |
| End Year | 2028 |
| Series Year | 2024-2028 |
| Growth Momentum | Accelerate |
| YOY 2024 | 9.53% |
| CAGR | 10.87% |
| Incremental Value | $1687.3mn |
By Type
- Embedded
- Standalone
By Technology
- DLP
- LCOS
- LBS
By Geography
- North America
- APAC
- Europe
- South America
- Middle East and Africa
This study identifies the shift toward laser technology to improve pico projector performance as one of the prime reasons driving the pico projectors market growth during the next few years. Also, high adoption of embedded pico projectors and increasing spending on consumer electronics will lead to sizable demand in the market.
Technavio presents a detailed picture of the market by the way of study, synthesis, and summation of data from multiple sources by an analysis of key parameters. Our report on the pico projectors market covers the following areas:
- Pico projectors market sizing
- Pico projectors market forecast
- Pico projectors market industry analysis
Technavio's robust vendor analysis is designed to help clients improve their market position, and in line with this, this report provides a detailed analysis of several leading pico projectors market vendors that include AAXA Technologies Inc., Acer Inc., Akaso, ASUSTeK Computer Inc., B and H Foto and Electronics Corp., Canon Inc., Coretronic Corp., Eastman Kodak Co., Koninklijke Philips N.V., Lenovo Group Ltd., LG Electronics Inc., Magnasonic, MicroVision Inc., Qisda Corp., Ricoh Co. Ltd., Samsung Electronics Co. Ltd., Sony Group Corp., Syndiant, Texas Instruments Inc., and ViewSonic Corp.. Also, the pico projectors market analysis report includes information on upcoming trends and challenges that will influence market growth. This is to help companies strategize and leverage all forthcoming growth opportunities.
The study was conducted using an objective combination of primary and secondary information including inputs from key participants in the industry. The report contains a comprehensive market and vendor landscape in addition to an analysis of the key vendors.
Technavio presents a detailed picture of the market by the way of study, synthesis, and summation of data from multiple sources by an analysis of key parameters such as profit, pricing, competition, and promotions. It presents various market facets by identifying the key industry influencers. The data presented is comprehensive, reliable, and a result of extensive research - both primary and secondary. Technavio's market research reports provide a complete competitive landscape and an in-depth vendor selection methodology and analysis using qualitative and quantitative research to forecast accurate market growth.
Table of Contents
1 Executive Summary
- 1.1 Market overview
- Executive Summary - Chart on Market Overview
- Executive Summary - Data Table on Market Overview
- Executive Summary - Chart on Global Market Characteristics
- Executive Summary - Chart on Market by Geography
- Executive Summary - Chart on Market Segmentation by Type
- Executive Summary - Chart on Market Segmentation by Technology
- Executive Summary - Chart on Incremental Growth
- Executive Summary - Data Table on Incremental Growth
- Executive Summary - Chart on Company Market Positioning
2 Market Landscape
- 2.1 Market ecosystem
- Parent Market
- Data Table on - Parent Market
- 2.2 Market characteristics
- Market characteristics analysis
- 2.3 Value chain analysis
- Value Chain Analysis
3 Market Sizing
- 3.1 Market definition
- Offerings of companies included in the market definition
- 3.2 Market segment analysis
- Market segments
- 3.3 Market size 2023
- 3.4 Market outlook: Forecast for 2023-2028
- Chart on Global - Market size and forecast 2023-2028 ($ million)
- Data Table on Global - Market size and forecast 2023-2028 ($ million)
- Chart on Global Market: Year-over-year growth 2023-2028 (%)
- Data Table on Global Market: Year-over-year growth 2023-2028 (%)
4 Historic Market Size
- 4.1 Global Pico Projectors Market 2018 - 2022
- Historic Market Size - Data Table on Global Pico Projectors Market 2018 - 2022 ($ million)
- 4.2 Type segment analysis 2018 - 2022
- Historic Market Size - Type Segment 2018 - 2022 ($ million)
- 4.3 Technology segment analysis 2018 - 2022
- Historic Market Size - Technology Segment 2018 - 2022 ($ million)
- 4.4 Geography segment analysis 2018 - 2022
- Historic Market Size - Geography Segment 2018 - 2022 ($ million)
- 4.5 Country segment analysis 2018 - 2022
- Historic Market Size - Country Segment 2018 - 2022 ($ million)
5 Five Forces Analysis
- 5.1 Five forces summary
- Five forces analysis - Comparison between 2023 and 2028
- 5.2 Bargaining power of buyers
- Bargaining power of buyers - Impact of key factors 2023 and 2028
- 5.3 Bargaining power of suppliers
- Bargaining power of suppliers - Impact of key factors in 2023 and 2028
- 5.4 Threat of new entrants
- Threat of new entrants - Impact of key factors in 2023 and 2028
- 5.5 Threat of substitutes
- Threat of substitutes - Impact of key factors in 2023 and 2028
- 5.6 Threat of rivalry
- Threat of rivalry - Impact of key factors in 2023 and 2028
- 5.7 Market condition
- Chart on Market condition - Five forces 2023 and 2028
6 Market Segmentation by Type
- 6.1 Market segments
- Chart on Type - Market share 2023-2028 (%)
- Data Table on Type - Market share 2023-2028 (%)
- 6.2 Comparison by Type
- Chart on Comparison by Type
- Data Table on Comparison by Type
- 6.3 Embedded - Market size and forecast 2023-2028
- Chart on Embedded - Market size and forecast 2023-2028 ($ million)
- Data Table on Embedded - Market size and forecast 2023-2028 ($ million)
- Chart on Embedded - Year-over-year growth 2023-2028 (%)
- Data Table on Embedded - Year-over-year growth 2023-2028 (%)
- 6.4 Standalone - Market size and forecast 2023-2028
- Chart on Standalone - Market size and forecast 2023-2028 ($ million)
- Data Table on Standalone - Market size and forecast 2023-2028 ($ million)
- Chart on Standalone - Year-over-year growth 2023-2028 (%)
- Data Table on Standalone - Year-over-year growth 2023-2028 (%)
- 6.5 Market opportunity by Type
- Market opportunity by Type ($ million)
- Data Table on Market opportunity by Type ($ million)
7 Market Segmentation by Technology
- 7.1 Market segments
- Chart on Technology - Market share 2023-2028 (%)
- Data Table on Technology - Market share 2023-2028 (%)
- 7.2 Comparison by Technology
- Chart on Comparison by Technology
- Data Table on Comparison by Technology
- 7.3 DLP - Market size and forecast 2023-2028
- Chart on DLP - Market size and forecast 2023-2028 ($ million)
- Data Table on DLP - Market size and forecast 2023-2028 ($ million)
- Chart on DLP - Year-over-year growth 2023-2028 (%)
- Data Table on DLP - Year-over-year growth 2023-2028 (%)
- 7.4 LCOS - Market size and forecast 2023-2028
- Chart on LCOS - Market size and forecast 2023-2028 ($ million)
- Data Table on LCOS - Market size and forecast 2023-2028 ($ million)
- Chart on LCOS - Year-over-year growth 2023-2028 (%)
- Data Table on LCOS - Year-over-year growth 2023-2028 (%)
- 7.5 LBS - Market size and forecast 2023-2028
- Chart on LBS - Market size and forecast 2023-2028 ($ million)
- Data Table on LBS - Market size and forecast 2023-2028 ($ million)
- Chart on LBS - Year-over-year growth 2023-2028 (%)
- Data Table on LBS - Year-over-year growth 2023-2028 (%)
- 7.6 Market opportunity by Technology
- Market opportunity by Technology ($ million)
- Data Table on Market opportunity by Technology ($ million)
8 Customer Landscape
- 8.1 Customer landscape overview
- Analysis of price sensitivity, lifecycle, customer purchase basket, adoption rates, and purchase criteria
9 Geographic Landscape
- 9.1 Geographic segmentation
- Chart on Market share By Geographical Landscape2023-2028 (%)
- Data Table on Market share By Geographical Landscape2023-2028 (%)
- 9.2 Geographic comparison
- Chart on Geographic comparison
- Data Table on Geographic comparison
- 9.3 North America - Market size and forecast 2023-2028
- Chart on North America - Market size and forecast 2023-2028 ($ million)
- Data Table on North America - Market size and forecast 2023-2028 ($ million)
- Chart on North America - Year-over-year growth 2023-2028 (%)
- Data Table on North America - Year-over-year growth 2023-2028 (%)
- 9.4 APAC - Market size and forecast 2023-2028
- Chart on APAC - Market size and forecast 2023-2028 ($ million)
- Data Table on APAC - Market size and forecast 2023-2028 ($ million)
- Chart on APAC - Year-over-year growth 2023-2028 (%)
- Data Table on APAC - Year-over-year growth 2023-2028 (%)
- 9.5 Europe - Market size and forecast 2023-2028
- Chart on Europe - Market size and forecast 2023-2028 ($ million)
- Data Table on Europe - Market size and forecast 2023-2028 ($ million)
- Chart on Europe - Year-over-year growth 2023-2028 (%)
- Data Table on Europe - Year-over-year growth 2023-2028 (%)
- 9.6 South America - Market size and forecast 2023-2028
- Chart on South America - Market size and forecast 2023-2028 ($ million)
- Data Table on South America - Market size and forecast 2023-2028 ($ million)
- Chart on South America - Year-over-year growth 2023-2028 (%)
- Data Table on South America - Year-over-year growth 2023-2028 (%)
- 9.7 Middle East and Africa - Market size and forecast 2023-2028
- Chart on Middle East and Africa - Market size and forecast 2023-2028 ($ million)
- Data Table on Middle East and Africa - Market size and forecast 2023-2028 ($ million)
- Chart on Middle East and Africa - Year-over-year growth 2023-2028 (%)
- Data Table on Middle East and Africa - Year-over-year growth 2023-2028 (%)
- 9.8 US - Market size and forecast 2023-2028
- Chart on US - Market size and forecast 2023-2028 ($ million)
- Data Table on US - Market size and forecast 2023-2028 ($ million)
- Chart on US - Year-over-year growth 2023-2028 (%)
- Data Table on US - Year-over-year growth 2023-2028 (%)
- 9.9 China - Market size and forecast 2023-2028
- Chart on China - Market size and forecast 2023-2028 ($ million)
- Data Table on China - Market size and forecast 2023-2028 ($ million)
- Chart on China - Year-over-year growth 2023-2028 (%)
- Data Table on China - Year-over-year growth 2023-2028 (%)
- 9.10 Germany - Market size and forecast 2023-2028
- Chart on Germany - Market size and forecast 2023-2028 ($ million)
- Data Table on Germany - Market size and forecast 2023-2028 ($ million)
- Chart on Germany - Year-over-year growth 2023-2028 (%)
- Data Table on Germany - Year-over-year growth 2023-2028 (%)
- 9.11 UK - Market size and forecast 2023-2028
- Chart on UK - Market size and forecast 2023-2028 ($ million)
- Data Table on UK - Market size and forecast 2023-2028 ($ million)
- Chart on UK - Year-over-year growth 2023-2028 (%)
- Data Table on UK - Year-over-year growth 2023-2028 (%)
- 9.12 Japan - Market size and forecast 2023-2028
- Chart on Japan - Market size and forecast 2023-2028 ($ million)
- Data Table on Japan - Market size and forecast 2023-2028 ($ million)
- Chart on Japan - Year-over-year growth 2023-2028 (%)
- Data Table on Japan - Year-over-year growth 2023-2028 (%)
- 9.13 Market opportunity by geography
- Market opportunity By Geographical Landscape($ million)
- Data Tables on Market opportunity By Geographical Landscape($ million)
10 Drivers, Challenges, and Opportunity/Restraints
- 10.1 Market drivers
- 10.2 Market challenges
- 10.3 Impact of drivers and challenges
- Impact of drivers and challenges in 2023 and 2028
- 10.4 Market opportunities/restraints
11 Competitive Landscape
- 11.1 Overview
- 11.2 Competitive Landscape
- Overview on criticality of inputs and factors of differentiation
- 11.3 Landscape disruption
- Overview on factors of disruption
- 11.4 Industry risks
- Impact of key risks on business
12 Competitive Analysis
- 12.1 Companies profiled
- Companies covered
- 12.2 Market positioning of companies
- Matrix on companies position and classification
- 12.3 AAXA Technologies Inc.
- AAXA Technologies Inc. - Overview
- AAXA Technologies Inc. - Product / Service
- AAXA Technologies Inc. - Key offerings
- 12.4 Acer Inc.
- Acer Inc. - Overview
- Acer Inc. - Business segments
- Acer Inc. - Key news
- Acer Inc. - Key offerings
- Acer Inc. - Segment focus
- 12.5 Akaso
- Akaso - Overview
- Akaso - Product / Service
- Akaso - Key offerings
- 12.6 ASUSTeK Computer Inc.
- ASUSTeK Computer Inc. - Overview
- ASUSTeK Computer Inc. - Product / Service
- ASUSTeK Computer Inc. - Key news
- ASUSTeK Computer Inc. - Key offerings
- 12.7 B and H Foto and Electronics Corp.
- B and H Foto and Electronics Corp. - Overview
- B and H Foto and Electronics Corp. - Product / Service
- B and H Foto and Electronics Corp. - Key offerings
- 12.8 Canon Inc.
- Canon Inc. - Overview
- Canon Inc. - Business segments
- Canon Inc. - Key news
- Canon Inc. - Key offerings
- Canon Inc. - Segment focus
- 12.9 Eastman Kodak Co.
- Eastman Kodak Co. - Overview
- Eastman Kodak Co. - Business segments
- Eastman Kodak Co. - Key news
- Eastman Kodak Co. - Key offerings
- Eastman Kodak Co. - Segment focus
- 12.10 Koninklijke Philips N.V.
- Koninklijke Philips N.V. - Overview
- Koninklijke Philips N.V. - Business segments
- Koninklijke Philips N.V. - Key news
- Koninklijke Philips N.V. - Key offerings
- Koninklijke Philips N.V. - Segment focus
- 12.11 Magnasonic
- Magnasonic - Overview
- Magnasonic - Product / Service
- Magnasonic - Key offerings
- 12.12 MicroVision Inc.
- MicroVision Inc. - Overview
- MicroVision Inc. - Product / Service
- MicroVision Inc. - Key offerings
- 12.13 Ricoh Co. Ltd.
- Ricoh Co. Ltd. - Overview
- Ricoh Co. Ltd. - Business segments
- Ricoh Co. Ltd. - Key news
- Ricoh Co. Ltd. - Key offerings
- Ricoh Co. Ltd. - Segment focus
- 12.14 Samsung Electronics Co. Ltd.
- Samsung Electronics Co. Ltd. - Overview
- Samsung Electronics Co. Ltd. - Business segments
- Samsung Electronics Co. Ltd. - Key news
- Samsung Electronics Co. Ltd. - Key offerings
- Samsung Electronics Co. Ltd. - Segment focus
- 12.15 Sony Group Corp.
- Sony Group Corp. - Overview
- Sony Group Corp. - Business segments
- Sony Group Corp. - Key news
- Sony Group Corp. - Key offerings
- Sony Group Corp. - Segment focus
- 12.16 Syndiant
- Syndiant - Overview
- Syndiant - Product / Service
- Syndiant - Key offerings
- 12.17 Texas Instruments Inc.
- Texas Instruments Inc. - Overview
- Texas Instruments Inc. - Business segments
- Texas Instruments Inc. - Key news
- Texas Instruments Inc. - Key offerings
- Texas Instruments Inc. - Segment focus
13 Appendix
- 13.1 Scope of the report
- 13.2 Inclusions and exclusions checklist
- Inclusions checklist
- Exclusions checklist
- 13.3 Currency conversion rates for US$
- Currency conversion rates for US$
- 13.4 Research methodology
- Research methodology
- 13.5 Data procurement
- Information sources
- 13.6 Data validation
- Data validation
- 13.7 Validation techniques employed for market sizing
- Validation techniques employed for market sizing
- 13.8 Data synthesis
- Data synthesis
- 13.9 360 degree market analysis
- 360 degree market analysis
- 13.10 List of abbreviations
- List of abbreviations
