|
|
市場調査レポート
商品コード
1502192
ナノファイバーの世界市場 2024-2028Global nanofiber market 2024-2028 |
||||||
|
|||||||
カスタマイズ可能
|
|||||||


| ナノファイバーの世界市場 2024-2028 |
|
出版日: 2024年05月17日
発行: TechNavio
ページ情報: 英文 192 Pages
納期: 即納可能
|

全表示
- 概要
- 図表
- 目次
Technavio社は、ナノファイバー市場をモニターしており、2023年から2028年にかけて115億3,550万米ドル、予測期間中のCAGRは33.85%で成長すると予測しています。
当レポートでは、ナノファイバー市場の全体的な分析、市場規模・予測、動向、成長促進要因、課題、約25のベンダーを網羅したベンダー分析などを掲載しています。
現在の市場シナリオ、最新動向と促進要因、市場環境全体に関する最新分析を提供しています。市場は、再生可能エネルギーや持続可能な製品に対する需要の高まり、ナノファイバーの生産技術の向上、空気や液体のろ過システムにおけるナノファイバーの使用の増加によって牽引されています。
| 市場範囲 | |
|---|---|
| 基準年 | 2024 |
| 終了年 | 2028 |
| 予測期間 | 2024-2028 |
| 成長モメンタム | 加速 |
| 前年比2024年 | 25.4% |
| CAGR | 33.85% |
| 増分額 | 115億3,550万米ドル |
本調査では、新製品開拓が今後数年間のナノファイバー市場成長を牽引する主要因の1つであるとしています。また、バイオセンサーの需要増とナノファイバーの新しい応用が市場の大きな需要につながります。
目次
第1章 エグゼクティブサマリー
- 市場概要
第2章 市場情勢
- 市場エコシステム
- 市場の特徴
- バリューチェーン分析
第3章 市場規模の評価
- 市場の定義
- 市場セグメント分析
- 市場規模 2023
- 市場の見通し 2023-2028
第4章 市場規模実績
- 世界ナノファイバー市場 2018-2022
- 製品別セグメント分析 2018-2022
- 用途別セグメント分析 2018-2022
- 地域別セグメント分析 2018-2022
- 国別セグメント分析 2018-2022
第5章 ファイブフォース分析
- ファイブフォースの要約
- 買い手の交渉力
- 供給企業の交渉力
- 新規参入業者の脅威
- 代替品の脅威
- 競争の脅威
- 市況
第6章 市場セグメンテーション:製品別
- 市場セグメンテーション
- 比較:製品別
- ポリマー:市場規模と予測 2023-2028
- 炭素:市場規模と予測 2023-2028
- ガラス:市場規模と予測 2023-2028
- セラミック:市場規模と予測 2023-2028
- その他:市場規模と予測 2023-2028
- 市場機会:製品別
第7章 市場セグメンテーション:用途別
- 市場セグメンテーション
- 比較:用途別
- 空気と液体のろ過:市場規模と予測 2023-2028
- エネルギー:市場規模と予測 2023-2028
- エレクトロニクス:市場規模と予測 2023-2028
- 医療:市場規模と予測 2023-2028
- その他:市場規模と予測 2023-2028
- 市場機会:用途別
第8章 顧客情勢
- 顧客情勢の概要
第9章 地域別情勢
- 地域別セグメンテーション
- 地域別比較
- アジア太平洋:市場規模と予測 2023-2028
- 北米:市場規模と予測 2023-2028
- 欧州:市場規模と予測 2023-2028
- 南米:市場規模と予測 2023-2028
- 中東・アフリカ:市場規模と予測 2023-2028
- 米国:市場規模と予測 2023-2028
- 中国:市場規模と予測 2023-2028
- 日本:市場規模と予測 2023-2028
- 韓国:市場規模と予測 2023-2028
- ドイツ:市場規模と予測 2023-2028
- 市場機会:地域別
第10章 促進要因・課題・機会・抑制要因
- 市場促進要因
- 市場の課題
- 促進要因と課題の影響
- 市場の機会・抑制要因
第11章 競合情勢
- 概要
- 競合情勢
- 混乱の状況
- 業界のリスク
第12章 競合分析
- 企業プロファイル
- 企業の市場ポジショニング
- Abalioglu Holding AS
- Ahlstrom Holding 3 Oy
- Asahi Kasei Corp.
- Berkshire Hathaway Inc.
- Donaldson Co. Inc.
- DuPont de Nemours Inc.
- eSpin Technologies Inc.
- Freudenberg and Co. KG
- Hollingsworth and Vose
- Mitsubishi Chemical Group Corp.
- Nippon Paper Industries Co. Ltd.
- Oji Holdings Corp.
- Teijin Ltd.
- Toray Industries Inc.
- US Global Nanospace Inc.
第13章 付録
Exhibits:
- Exhibits1: Executive Summary - Chart on Market Overview
- Exhibits2: Executive Summary - Data Table on Market Overview
- Exhibits3: Executive Summary - Chart on Global Market Characteristics
- Exhibits4: Executive Summary - Chart on Market by Geography
- Exhibits5: Executive Summary - Chart on Market Segmentation by Product
- Exhibits6: Executive Summary - Chart on Market Segmentation by Application
- Exhibits7: Executive Summary - Chart on Incremental Growth
- Exhibits8: Executive Summary - Data Table on Incremental Growth
- Exhibits9: Executive Summary - Chart on Company Market Positioning
- Exhibits10: Parent Market
- Exhibits11: Data Table on - Parent Market
- Exhibits12: Market characteristics analysis
- Exhibits13: Value Chain Analysis
- Exhibits14: Offerings of companies included in the market definition
- Exhibits15: Market segments
- Exhibits16: Chart on Global - Market size and forecast 2023-2028 ($ million)
- Exhibits17: Data Table on Global - Market size and forecast 2023-2028 ($ million)
- Exhibits18: Chart on Global Market: Year-over-year growth 2023-2028 (%)
- Exhibits19: Data Table on Global Market: Year-over-year growth 2023-2028 (%)
- Exhibits20: Historic Market Size - Data Table on Global Nanofiber Market 2018 - 2022 ($ million)
- Exhibits21: Historic Market Size - Product Segment 2018 - 2022 ($ million)
- Exhibits22: Historic Market Size - Application Segment 2018 - 2022 ($ million)
- Exhibits23: Historic Market Size - Geography Segment 2018 - 2022 ($ million)
- Exhibits24: Historic Market Size - Country Segment 2018 - 2022 ($ million)
- Exhibits25: Five forces analysis - Comparison between 2023 and 2028
- Exhibits26: Bargaining power of buyers - Impact of key factors 2023 and 2028
- Exhibits27: Bargaining power of suppliers - Impact of key factors in 2023 and 2028
- Exhibits28: Threat of new entrants - Impact of key factors in 2023 and 2028
- Exhibits29: Threat of substitutes - Impact of key factors in 2023 and 2028
- Exhibits30: Threat of rivalry - Impact of key factors in 2023 and 2028
- Exhibits31: Chart on Market condition - Five forces 2023 and 2028
- Exhibits32: Chart on Product - Market share 2023-2028 (%)
- Exhibits33: Data Table on Product - Market share 2023-2028 (%)
- Exhibits34: Chart on Comparison by Product
- Exhibits35: Data Table on Comparison by Product
- Exhibits36: Chart on Polymer - Market size and forecast 2023-2028 ($ million)
- Exhibits37: Data Table on Polymer - Market size and forecast 2023-2028 ($ million)
- Exhibits38: Chart on Polymer - Year-over-year growth 2023-2028 (%)
- Exhibits39: Data Table on Polymer - Year-over-year growth 2023-2028 (%)
- Exhibits40: Chart on Carbon - Market size and forecast 2023-2028 ($ million)
- Exhibits41: Data Table on Carbon - Market size and forecast 2023-2028 ($ million)
- Exhibits42: Chart on Carbon - Year-over-year growth 2023-2028 (%)
- Exhibits43: Data Table on Carbon - Year-over-year growth 2023-2028 (%)
- Exhibits44: Chart on Glass - Market size and forecast 2023-2028 ($ million)
- Exhibits45: Data Table on Glass - Market size and forecast 2023-2028 ($ million)
- Exhibits46: Chart on Glass - Year-over-year growth 2023-2028 (%)
- Exhibits47: Data Table on Glass - Year-over-year growth 2023-2028 (%)
- Exhibits48: Chart on Ceramic - Market size and forecast 2023-2028 ($ million)
- Exhibits49: Data Table on Ceramic - Market size and forecast 2023-2028 ($ million)
- Exhibits50: Chart on Ceramic - Year-over-year growth 2023-2028 (%)
- Exhibits51: Data Table on Ceramic - Year-over-year growth 2023-2028 (%)
- Exhibits52: Chart on Others - Market size and forecast 2023-2028 ($ million)
- Exhibits53: Data Table on Others - Market size and forecast 2023-2028 ($ million)
- Exhibits54: Chart on Others - Year-over-year growth 2023-2028 (%)
- Exhibits55: Data Table on Others - Year-over-year growth 2023-2028 (%)
- Exhibits56: Market opportunity by Product ($ million)
- Exhibits57: Data Table on Market opportunity by Product ($ million)
- Exhibits58: Chart on Application - Market share 2023-2028 (%)
- Exhibits59: Data Table on Application - Market share 2023-2028 (%)
- Exhibits60: Chart on Comparison by Application
- Exhibits61: Data Table on Comparison by Application
- Exhibits62: Chart on Air and liquid filtration - Market size and forecast 2023-2028 ($ million)
- Exhibits63: Data Table on Air and liquid filtration - Market size and forecast 2023-2028 ($ million)
- Exhibits64: Chart on Air and liquid filtration - Year-over-year growth 2023-2028 (%)
- Exhibits65: Data Table on Air and liquid filtration - Year-over-year growth 2023-2028 (%)
- Exhibits66: Chart on Energy - Market size and forecast 2023-2028 ($ million)
- Exhibits67: Data Table on Energy - Market size and forecast 2023-2028 ($ million)
- Exhibits68: Chart on Energy - Year-over-year growth 2023-2028 (%)
- Exhibits69: Data Table on Energy - Year-over-year growth 2023-2028 (%)
- Exhibits70: Chart on Electronics - Market size and forecast 2023-2028 ($ million)
- Exhibits71: Data Table on Electronics - Market size and forecast 2023-2028 ($ million)
- Exhibits72: Chart on Electronics - Year-over-year growth 2023-2028 (%)
- Exhibits73: Data Table on Electronics - Year-over-year growth 2023-2028 (%)
- Exhibits74: Chart on Medical - Market size and forecast 2023-2028 ($ million)
- Exhibits75: Data Table on Medical - Market size and forecast 2023-2028 ($ million)
- Exhibits76: Chart on Medical - Year-over-year growth 2023-2028 (%)
- Exhibits77: Data Table on Medical - Year-over-year growth 2023-2028 (%)
- Exhibits78: Chart on Others - Market size and forecast 2023-2028 ($ million)
- Exhibits79: Data Table on Others - Market size and forecast 2023-2028 ($ million)
- Exhibits80: Chart on Others - Year-over-year growth 2023-2028 (%)
- Exhibits81: Data Table on Others - Year-over-year growth 2023-2028 (%)
- Exhibits82: Market opportunity by Application ($ million)
- Exhibits83: Data Table on Market opportunity by Application ($ million)
- Exhibits84: Analysis of price sensitivity, lifecycle, customer purchase basket, adoption rates, and purchase criteria
- Exhibits85: Chart on Market share By Geographical Landscape2023-2028 (%)
- Exhibits86: Data Table on Market share By Geographical Landscape2023-2028 (%)
- Exhibits87: Chart on Geographic comparison
- Exhibits88: Data Table on Geographic comparison
- Exhibits89: Chart on APAC - Market size and forecast 2023-2028 ($ million)
- Exhibits90: Data Table on APAC - Market size and forecast 2023-2028 ($ million)
- Exhibits91: Chart on APAC - Year-over-year growth 2023-2028 (%)
- Exhibits92: Data Table on APAC - Year-over-year growth 2023-2028 (%)
- Exhibits93: Chart on North America - Market size and forecast 2023-2028 ($ million)
- Exhibits94: Data Table on North America - Market size and forecast 2023-2028 ($ million)
- Exhibits95: Chart on North America - Year-over-year growth 2023-2028 (%)
- Exhibits96: Data Table on North America - Year-over-year growth 2023-2028 (%)
- Exhibits97: Chart on Europe - Market size and forecast 2023-2028 ($ million)
- Exhibits98: Data Table on Europe - Market size and forecast 2023-2028 ($ million)
- Exhibits99: Chart on Europe - Year-over-year growth 2023-2028 (%)
- Exhibits100: Data Table on Europe - Year-over-year growth 2023-2028 (%)
- Exhibits101: Chart on South America - Market size and forecast 2023-2028 ($ million)
- Exhibits102: Data Table on South America - Market size and forecast 2023-2028 ($ million)
- Exhibits103: Chart on South America - Year-over-year growth 2023-2028 (%)
- Exhibits104: Data Table on South America - Year-over-year growth 2023-2028 (%)
- Exhibits105: Chart on Middle East and Africa - Market size and forecast 2023-2028 ($ million)
- Exhibits106: Data Table on Middle East and Africa - Market size and forecast 2023-2028 ($ million)
- Exhibits107: Chart on Middle East and Africa - Year-over-year growth 2023-2028 (%)
- Exhibits108: Data Table on Middle East and Africa - Year-over-year growth 2023-2028 (%)
- Exhibits109: Chart on US - Market size and forecast 2023-2028 ($ million)
- Exhibits110: Data Table on US - Market size and forecast 2023-2028 ($ million)
- Exhibits111: Chart on US - Year-over-year growth 2023-2028 (%)
- Exhibits112: Data Table on US - Year-over-year growth 2023-2028 (%)
- Exhibits113: Chart on China - Market size and forecast 2023-2028 ($ million)
- Exhibits114: Data Table on China - Market size and forecast 2023-2028 ($ million)
- Exhibits115: Chart on China - Year-over-year growth 2023-2028 (%)
- Exhibits116: Data Table on China - Year-over-year growth 2023-2028 (%)
- Exhibits117: Chart on Japan - Market size and forecast 2023-2028 ($ million)
- Exhibits118: Data Table on Japan - Market size and forecast 2023-2028 ($ million)
- Exhibits119: Chart on Japan - Year-over-year growth 2023-2028 (%)
- Exhibits120: Data Table on Japan - Year-over-year growth 2023-2028 (%)
- Exhibits121: Chart on South Korea - Market size and forecast 2023-2028 ($ million)
- Exhibits122: Data Table on South Korea - Market size and forecast 2023-2028 ($ million)
- Exhibits123: Chart on South Korea - Year-over-year growth 2023-2028 (%)
- Exhibits124: Data Table on South Korea - Year-over-year growth 2023-2028 (%)
- Exhibits125: Chart on Germany - Market size and forecast 2023-2028 ($ million)
- Exhibits126: Data Table on Germany - Market size and forecast 2023-2028 ($ million)
- Exhibits127: Chart on Germany - Year-over-year growth 2023-2028 (%)
- Exhibits128: Data Table on Germany - Year-over-year growth 2023-2028 (%)
- Exhibits129: Market opportunity By Geographical Landscape($ million)
- Exhibits130: Data Tables on Market opportunity By Geographical Landscape($ million)
- Exhibits131: Impact of drivers and challenges in 2023 and 2028
- Exhibits132: Overview on criticality of inputs and factors of differentiation
- Exhibits133: Overview on factors of disruption
- Exhibits134: Impact of key risks on business
- Exhibits135: Companies covered
- Exhibits136: Matrix on companies position and classification
- Exhibits137: Abalioglu Holding AS - Overview
- Exhibits138: Abalioglu Holding AS - Product / Service
- Exhibits139: Abalioglu Holding AS - Key offerings
- Exhibits140: Ahlstrom Holding 3 Oy - Overview
- Exhibits141: Ahlstrom Holding 3 Oy - Product / Service
- Exhibits142: Ahlstrom Holding 3 Oy - Key news
- Exhibits143: Ahlstrom Holding 3 Oy - Key offerings
- Exhibits144: Asahi Kasei Corp. - Overview
- Exhibits145: Asahi Kasei Corp. - Business segments
- Exhibits146: Asahi Kasei Corp. - Key news
- Exhibits147: Asahi Kasei Corp. - Key offerings
- Exhibits148: Asahi Kasei Corp. - Segment focus
- Exhibits149: Berkshire Hathaway Inc. - Overview
- Exhibits150: Berkshire Hathaway Inc. - Business segments
- Exhibits151: Berkshire Hathaway Inc. - Key news
- Exhibits152: Berkshire Hathaway Inc. - Key offerings
- Exhibits153: Berkshire Hathaway Inc. - Segment focus
- Exhibits154: Donaldson Co. Inc. - Overview
- Exhibits155: Donaldson Co. Inc. - Business segments
- Exhibits156: Donaldson Co. Inc. - Key news
- Exhibits157: Donaldson Co. Inc. - Key offerings
- Exhibits158: Donaldson Co. Inc. - Segment focus
- Exhibits159: DuPont de Nemours Inc. - Overview
- Exhibits160: DuPont de Nemours Inc. - Business segments
- Exhibits161: DuPont de Nemours Inc. - Key news
- Exhibits162: DuPont de Nemours Inc. - Key offerings
- Exhibits163: DuPont de Nemours Inc. - Segment focus
- Exhibits164: eSpin Technologies Inc. - Overview
- Exhibits165: eSpin Technologies Inc. - Product / Service
- Exhibits166: eSpin Technologies Inc. - Key offerings
- Exhibits167: Freudenberg and Co. KG - Overview
- Exhibits168: Freudenberg and Co. KG - Business segments
- Exhibits169: Freudenberg and Co. KG - Key news
- Exhibits170: Freudenberg and Co. KG - Key offerings
- Exhibits171: Freudenberg and Co. KG - Segment focus
- Exhibits172: Hollingsworth and Vose - Overview
- Exhibits173: Hollingsworth and Vose - Product / Service
- Exhibits174: Hollingsworth and Vose - Key offerings
- Exhibits175: Mitsubishi Chemical Group Corp. - Overview
- Exhibits176: Mitsubishi Chemical Group Corp. - Business segments
- Exhibits177: Mitsubishi Chemical Group Corp. - Key news
- Exhibits178: Mitsubishi Chemical Group Corp. - Key offerings
- Exhibits179: Mitsubishi Chemical Group Corp. - Segment focus
- Exhibits180: Nippon Paper Industries Co. Ltd. - Overview
- Exhibits181: Nippon Paper Industries Co. Ltd. - Business segments
- Exhibits182: Nippon Paper Industries Co. Ltd. - Key news
- Exhibits183: Nippon Paper Industries Co. Ltd. - Key offerings
- Exhibits184: Nippon Paper Industries Co. Ltd. - Segment focus
- Exhibits185: Oji Holdings Corp. - Overview
- Exhibits186: Oji Holdings Corp. - Business segments
- Exhibits187: Oji Holdings Corp. - Key offerings
- Exhibits188: Oji Holdings Corp. - Segment focus
- Exhibits189: Teijin Ltd. - Overview
- Exhibits190: Teijin Ltd. - Business segments
- Exhibits191: Teijin Ltd. - Key offerings
- Exhibits192: Teijin Ltd. - Segment focus
- Exhibits193: Toray Industries Inc. - Overview
- Exhibits194: Toray Industries Inc. - Business segments
- Exhibits195: Toray Industries Inc. - Key news
- Exhibits196: Toray Industries Inc. - Key offerings
- Exhibits197: Toray Industries Inc. - Segment focus
- Exhibits198: US Global Nanospace Inc. - Overview
- Exhibits199: US Global Nanospace Inc. - Product / Service
- Exhibits200: US Global Nanospace Inc. - Key offerings
- Exhibits201: Inclusions checklist
- Exhibits202: Exclusions checklist
- Exhibits203: Currency conversion rates for US$
- Exhibits204: Research methodology
- Exhibits205: Information sources
- Exhibits206: Data validation
- Exhibits207: Validation techniques employed for market sizing
- Exhibits208: Data synthesis
- Exhibits209: 360 degree market analysis
- Exhibits210: List of abbreviations
Technavio has been monitoring the nanofiber market and is forecast to grow by USD 11535.5 mn during 2023-2028, accelerating at a CAGR of 33.85% during the forecast period. Our report on the nanofiber market provides a holistic analysis, market size and forecast, trends, growth drivers, and challenges, as well as vendor analysis covering around 25 vendors.
The report offers an up-to-date analysis regarding the current market scenario, the latest trends and drivers, and the overall market environment. The market is driven by growing demand for renewable energy and sustainable products, improvements in production technology of nanofibers, and increasing use of nanofibers in air and liquid filtration systems.
Technavio's nanofiber market is segmented as below:
| Market Scope | |
|---|---|
| Base Year | 2024 |
| End Year | 2028 |
| Series Year | 2024-2028 |
| Growth Momentum | Accelerate |
| YOY 2024 | 25.4% |
| CAGR | 33.85% |
| Incremental Value | $11535.5mn |
By Product
- Polymer
- Carbon
- Glass
- Ceramic
- Others
By Application
- Air and liquid filtration
- Energy
- Electronics
- Medical
- Others
By Geography
- APAC
- North America
- Europe
- South America
- Middle East and Africa
This study identifies the new product developments as one of the prime reasons driving the nanofiber market growth during the next few years. Also, growing demand for biosensors and new applications of nanofibers will lead to sizable demand in the market.
Technavio presents a detailed picture of the market by the way of study, synthesis, and summation of data from multiple sources by an analysis of key parameters. Our report on the nanofiber market covers the following areas:
- Nanofiber market sizing
- Nanofiber market forecast
- Nanofiber market industry analysis
Technavio's robust vendor analysis is designed to help clients improve their market position, and in line with this, this report provides a detailed analysis of several leading nanofiber market vendors that include Abalioglu Holding AS, Ahlstrom Holding 3 Oy, Asahi Kasei Corp., Berkshire Hathaway Inc., Donaldson Co. Inc., DuPont de Nemours Inc., eSpin Technologies Inc., Freudenberg and Co. KG, Grupo Antolin Irausa SA, Hollingsworth and Vose, Inovenso Inc., Mitsubishi Chemical Group Corp., Nanolayr Ltd., NanoTechLabs Inc., Nippon Paper Industries Co. Ltd., Oji Holdings Corp., Teijin Ltd., Toray Industries Inc., US Global Nanospace Inc., and Verdex Technologies Inc.. Also, the nanofiber market analysis report includes information on upcoming trends and challenges that will influence market growth. This is to help companies strategize and leverage all forthcoming growth opportunities.
The study was conducted using an objective combination of primary and secondary information including inputs from key participants in the industry. The report contains a comprehensive market and vendor landscape in addition to an analysis of the key vendors.
Technavio presents a detailed picture of the market by the way of study, synthesis, and summation of data from multiple sources by an analysis of key parameters such as profit, pricing, competition, and promotions. It presents various market facets by identifying the key industry influencers. The data presented is comprehensive, reliable, and a result of extensive research - both primary and secondary. Technavio's market research reports provide a complete competitive landscape and an in-depth vendor selection methodology and analysis using qualitative and quantitative research to forecast accurate market growth.
Table of Contents
1 Executive Summary
- 1.1 Market overview
- Executive Summary - Chart on Market Overview
- Executive Summary - Data Table on Market Overview
- Executive Summary - Chart on Global Market Characteristics
- Executive Summary - Chart on Market by Geography
- Executive Summary - Chart on Market Segmentation by Product
- Executive Summary - Chart on Market Segmentation by Application
- Executive Summary - Chart on Incremental Growth
- Executive Summary - Data Table on Incremental Growth
- Executive Summary - Chart on Company Market Positioning
2 Market Landscape
- 2.1 Market ecosystem
- Parent Market
- Data Table on - Parent Market
- 2.2 Market characteristics
- Market characteristics analysis
- 2.3 Value chain analysis
- Value Chain Analysis
3 Market Sizing
- 3.1 Market definition
- Offerings of companies included in the market definition
- 3.2 Market segment analysis
- Market segments
- 3.3 Market size 2023
- 3.4 Market outlook: Forecast for 2023-2028
- Chart on Global - Market size and forecast 2023-2028 ($ million)
- Data Table on Global - Market size and forecast 2023-2028 ($ million)
- Chart on Global Market: Year-over-year growth 2023-2028 (%)
- Data Table on Global Market: Year-over-year growth 2023-2028 (%)
4 Historic Market Size
- 4.1 Global Nanofiber Market 2018 - 2022
- Historic Market Size - Data Table on Global Nanofiber Market 2018 - 2022 ($ million)
- 4.2 Product segment analysis 2018 - 2022
- Historic Market Size - Product Segment 2018 - 2022 ($ million)
- 4.3 Application segment analysis 2018 - 2022
- Historic Market Size - Application Segment 2018 - 2022 ($ million)
- 4.4 Geography segment analysis 2018 - 2022
- Historic Market Size - Geography Segment 2018 - 2022 ($ million)
- 4.5 Country segment analysis 2018 - 2022
- Historic Market Size - Country Segment 2018 - 2022 ($ million)
5 Five Forces Analysis
- 5.1 Five forces summary
- Five forces analysis - Comparison between 2023 and 2028
- 5.2 Bargaining power of buyers
- Bargaining power of buyers - Impact of key factors 2023 and 2028
- 5.3 Bargaining power of suppliers
- Bargaining power of suppliers - Impact of key factors in 2023 and 2028
- 5.4 Threat of new entrants
- Threat of new entrants - Impact of key factors in 2023 and 2028
- 5.5 Threat of substitutes
- Threat of substitutes - Impact of key factors in 2023 and 2028
- 5.6 Threat of rivalry
- Threat of rivalry - Impact of key factors in 2023 and 2028
- 5.7 Market condition
- Chart on Market condition - Five forces 2023 and 2028
6 Market Segmentation by Product
- 6.1 Market segments
- Chart on Product - Market share 2023-2028 (%)
- Data Table on Product - Market share 2023-2028 (%)
- 6.2 Comparison by Product
- Chart on Comparison by Product
- Data Table on Comparison by Product
- 6.3 Polymer - Market size and forecast 2023-2028
- Chart on Polymer - Market size and forecast 2023-2028 ($ million)
- Data Table on Polymer - Market size and forecast 2023-2028 ($ million)
- Chart on Polymer - Year-over-year growth 2023-2028 (%)
- Data Table on Polymer - Year-over-year growth 2023-2028 (%)
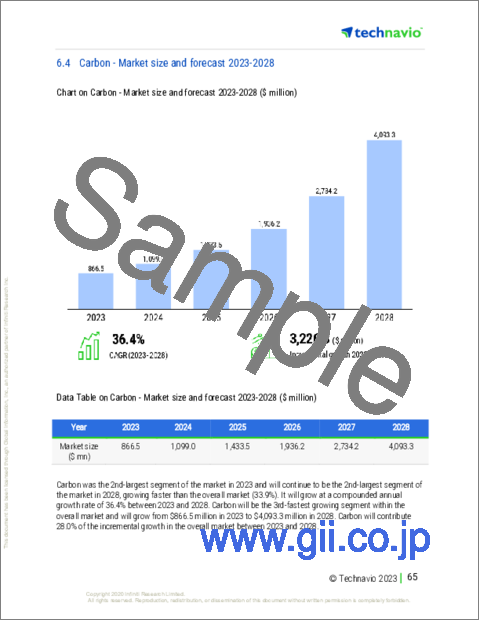
- 6.4 Carbon - Market size and forecast 2023-2028
- Chart on Carbon - Market size and forecast 2023-2028 ($ million)
- Data Table on Carbon - Market size and forecast 2023-2028 ($ million)
- Chart on Carbon - Year-over-year growth 2023-2028 (%)
- Data Table on Carbon - Year-over-year growth 2023-2028 (%)
- 6.5 Glass - Market size and forecast 2023-2028
- Chart on Glass - Market size and forecast 2023-2028 ($ million)
- Data Table on Glass - Market size and forecast 2023-2028 ($ million)
- Chart on Glass - Year-over-year growth 2023-2028 (%)
- Data Table on Glass - Year-over-year growth 2023-2028 (%)
- 6.6 Ceramic - Market size and forecast 2023-2028
- Chart on Ceramic - Market size and forecast 2023-2028 ($ million)
- Data Table on Ceramic - Market size and forecast 2023-2028 ($ million)
- Chart on Ceramic - Year-over-year growth 2023-2028 (%)
- Data Table on Ceramic - Year-over-year growth 2023-2028 (%)
- 6.7 Others - Market size and forecast 2023-2028
- Chart on Others - Market size and forecast 2023-2028 ($ million)
- Data Table on Others - Market size and forecast 2023-2028 ($ million)
- Chart on Others - Year-over-year growth 2023-2028 (%)
- Data Table on Others - Year-over-year growth 2023-2028 (%)
- 6.8 Market opportunity by Product
- Market opportunity by Product ($ million)
- Data Table on Market opportunity by Product ($ million)
7 Market Segmentation by Application
- 7.1 Market segments
- Chart on Application - Market share 2023-2028 (%)
- Data Table on Application - Market share 2023-2028 (%)
- 7.2 Comparison by Application
- Chart on Comparison by Application
- Data Table on Comparison by Application
- 7.3 Air and liquid filtration - Market size and forecast 2023-2028
- Chart on Air and liquid filtration - Market size and forecast 2023-2028 ($ million)
- Data Table on Air and liquid filtration - Market size and forecast 2023-2028 ($ million)
- Chart on Air and liquid filtration - Year-over-year growth 2023-2028 (%)
- Data Table on Air and liquid filtration - Year-over-year growth 2023-2028 (%)
- 7.4 Energy - Market size and forecast 2023-2028
- Chart on Energy - Market size and forecast 2023-2028 ($ million)
- Data Table on Energy - Market size and forecast 2023-2028 ($ million)
- Chart on Energy - Year-over-year growth 2023-2028 (%)
- Data Table on Energy - Year-over-year growth 2023-2028 (%)
- 7.5 Electronics - Market size and forecast 2023-2028
- Chart on Electronics - Market size and forecast 2023-2028 ($ million)
- Data Table on Electronics - Market size and forecast 2023-2028 ($ million)
- Chart on Electronics - Year-over-year growth 2023-2028 (%)
- Data Table on Electronics - Year-over-year growth 2023-2028 (%)
- 7.6 Medical - Market size and forecast 2023-2028
- Chart on Medical - Market size and forecast 2023-2028 ($ million)
- Data Table on Medical - Market size and forecast 2023-2028 ($ million)
- Chart on Medical - Year-over-year growth 2023-2028 (%)
- Data Table on Medical - Year-over-year growth 2023-2028 (%)
- 7.7 Others - Market size and forecast 2023-2028
- Chart on Others - Market size and forecast 2023-2028 ($ million)
- Data Table on Others - Market size and forecast 2023-2028 ($ million)
- Chart on Others - Year-over-year growth 2023-2028 (%)
- Data Table on Others - Year-over-year growth 2023-2028 (%)
- 7.8 Market opportunity by Application
- Market opportunity by Application ($ million)
- Data Table on Market opportunity by Application ($ million)
8 Customer Landscape
- 8.1 Customer landscape overview
- Analysis of price sensitivity, lifecycle, customer purchase basket, adoption rates, and purchase criteria
9 Geographic Landscape
- 9.1 Geographic segmentation
- Chart on Market share By Geographical Landscape2023-2028 (%)
- Data Table on Market share By Geographical Landscape2023-2028 (%)
- 9.2 Geographic comparison
- Chart on Geographic comparison
- Data Table on Geographic comparison
- 9.3 APAC - Market size and forecast 2023-2028
- Chart on APAC - Market size and forecast 2023-2028 ($ million)
- Data Table on APAC - Market size and forecast 2023-2028 ($ million)
- Chart on APAC - Year-over-year growth 2023-2028 (%)
- Data Table on APAC - Year-over-year growth 2023-2028 (%)
- 9.4 North America - Market size and forecast 2023-2028
- Chart on North America - Market size and forecast 2023-2028 ($ million)
- Data Table on North America - Market size and forecast 2023-2028 ($ million)
- Chart on North America - Year-over-year growth 2023-2028 (%)
- Data Table on North America - Year-over-year growth 2023-2028 (%)
- 9.5 Europe - Market size and forecast 2023-2028
- Chart on Europe - Market size and forecast 2023-2028 ($ million)
- Data Table on Europe - Market size and forecast 2023-2028 ($ million)
- Chart on Europe - Year-over-year growth 2023-2028 (%)
- Data Table on Europe - Year-over-year growth 2023-2028 (%)
- 9.6 South America - Market size and forecast 2023-2028
- Chart on South America - Market size and forecast 2023-2028 ($ million)
- Data Table on South America - Market size and forecast 2023-2028 ($ million)
- Chart on South America - Year-over-year growth 2023-2028 (%)
- Data Table on South America - Year-over-year growth 2023-2028 (%)
- 9.7 Middle East and Africa - Market size and forecast 2023-2028
- Chart on Middle East and Africa - Market size and forecast 2023-2028 ($ million)
- Data Table on Middle East and Africa - Market size and forecast 2023-2028 ($ million)
- Chart on Middle East and Africa - Year-over-year growth 2023-2028 (%)
- Data Table on Middle East and Africa - Year-over-year growth 2023-2028 (%)
- 9.8 US - Market size and forecast 2023-2028
- Chart on US - Market size and forecast 2023-2028 ($ million)
- Data Table on US - Market size and forecast 2023-2028 ($ million)
- Chart on US - Year-over-year growth 2023-2028 (%)
- Data Table on US - Year-over-year growth 2023-2028 (%)
- 9.9 China - Market size and forecast 2023-2028
- Chart on China - Market size and forecast 2023-2028 ($ million)
- Data Table on China - Market size and forecast 2023-2028 ($ million)
- Chart on China - Year-over-year growth 2023-2028 (%)
- Data Table on China - Year-over-year growth 2023-2028 (%)
- 9.10 Japan - Market size and forecast 2023-2028
- Chart on Japan - Market size and forecast 2023-2028 ($ million)
- Data Table on Japan - Market size and forecast 2023-2028 ($ million)
- Chart on Japan - Year-over-year growth 2023-2028 (%)
- Data Table on Japan - Year-over-year growth 2023-2028 (%)
- 9.11 South Korea - Market size and forecast 2023-2028
- Chart on South Korea - Market size and forecast 2023-2028 ($ million)
- Data Table on South Korea - Market size and forecast 2023-2028 ($ million)
- Chart on South Korea - Year-over-year growth 2023-2028 (%)
- Data Table on South Korea - Year-over-year growth 2023-2028 (%)
- 9.12 Germany - Market size and forecast 2023-2028
- Chart on Germany - Market size and forecast 2023-2028 ($ million)
- Data Table on Germany - Market size and forecast 2023-2028 ($ million)
- Chart on Germany - Year-over-year growth 2023-2028 (%)
- Data Table on Germany - Year-over-year growth 2023-2028 (%)
- 9.13 Market opportunity by geography
- Market opportunity By Geographical Landscape($ million)
- Data Tables on Market opportunity By Geographical Landscape($ million)
10 Drivers, Challenges, and Opportunity/Restraints
- 10.1 Market drivers
- 10.2 Market challenges
- 10.3 Impact of drivers and challenges
- Impact of drivers and challenges in 2023 and 2028
- 10.4 Market opportunities/restraints
11 Competitive Landscape
- 11.1 Overview
- 11.2 Competitive Landscape
- Overview on criticality of inputs and factors of differentiation
- 11.3 Landscape disruption
- Overview on factors of disruption
- 11.4 Industry risks
- Impact of key risks on business
12 Competitive Analysis
- 12.1 Companies profiled
- Companies covered
- 12.2 Market positioning of companies
- Matrix on companies position and classification
- 12.3 Abalioglu Holding AS
- Abalioglu Holding AS - Overview
- Abalioglu Holding AS - Product / Service
- Abalioglu Holding AS - Key offerings
- 12.4 Ahlstrom Holding 3 Oy
- Ahlstrom Holding 3 Oy - Overview
- Ahlstrom Holding 3 Oy - Product / Service
- Ahlstrom Holding 3 Oy - Key news
- Ahlstrom Holding 3 Oy - Key offerings
- 12.5 Asahi Kasei Corp.
- Asahi Kasei Corp. - Overview
- Asahi Kasei Corp. - Business segments
- Asahi Kasei Corp. - Key news
- Asahi Kasei Corp. - Key offerings
- Asahi Kasei Corp. - Segment focus
- 12.6 Berkshire Hathaway Inc.
- Berkshire Hathaway Inc. - Overview
- Berkshire Hathaway Inc. - Business segments
- Berkshire Hathaway Inc. - Key news
- Berkshire Hathaway Inc. - Key offerings
- Berkshire Hathaway Inc. - Segment focus
- 12.7 Donaldson Co. Inc.
- Donaldson Co. Inc. - Overview
- Donaldson Co. Inc. - Business segments
- Donaldson Co. Inc. - Key news
- Donaldson Co. Inc. - Key offerings
- Donaldson Co. Inc. - Segment focus
- 12.8 DuPont de Nemours Inc.
- DuPont de Nemours Inc. - Overview
- DuPont de Nemours Inc. - Business segments
- DuPont de Nemours Inc. - Key news
- DuPont de Nemours Inc. - Key offerings
- DuPont de Nemours Inc. - Segment focus
- 12.9 eSpin Technologies Inc.
- eSpin Technologies Inc. - Overview
- eSpin Technologies Inc. - Product / Service
- eSpin Technologies Inc. - Key offerings
- 12.10 Freudenberg and Co. KG
- Freudenberg and Co. KG - Overview
- Freudenberg and Co. KG - Business segments
- Freudenberg and Co. KG - Key news
- Freudenberg and Co. KG - Key offerings
- Freudenberg and Co. KG - Segment focus
- 12.11 Hollingsworth and Vose
- Hollingsworth and Vose - Overview
- Hollingsworth and Vose - Product / Service
- Hollingsworth and Vose - Key offerings
- 12.12 Mitsubishi Chemical Group Corp.
- Mitsubishi Chemical Group Corp. - Overview
- Mitsubishi Chemical Group Corp. - Business segments
- Mitsubishi Chemical Group Corp. - Key news
- Mitsubishi Chemical Group Corp. - Key offerings
- Mitsubishi Chemical Group Corp. - Segment focus
- 12.13 Nippon Paper Industries Co. Ltd.
- Nippon Paper Industries Co. Ltd. - Overview
- Nippon Paper Industries Co. Ltd. - Business segments
- Nippon Paper Industries Co. Ltd. - Key news
- Nippon Paper Industries Co. Ltd. - Key offerings
- Nippon Paper Industries Co. Ltd. - Segment focus
- 12.14 Oji Holdings Corp.
- Oji Holdings Corp. - Overview
- Oji Holdings Corp. - Business segments
- Oji Holdings Corp. - Key offerings
- Oji Holdings Corp. - Segment focus
- 12.15 Teijin Ltd.
- Teijin Ltd. - Overview
- Teijin Ltd. - Business segments
- Teijin Ltd. - Key offerings
- Teijin Ltd. - Segment focus
- 12.16 Toray Industries Inc.
- Toray Industries Inc. - Overview
- Toray Industries Inc. - Business segments
- Toray Industries Inc. - Key news
- Toray Industries Inc. - Key offerings
- Toray Industries Inc. - Segment focus
- 12.17 US Global Nanospace Inc.
- US Global Nanospace Inc. - Overview
- US Global Nanospace Inc. - Product / Service
- US Global Nanospace Inc. - Key offerings
13 Appendix
- 13.1 Scope of the report
- 13.2 Inclusions and exclusions checklist
- Inclusions checklist
- Exclusions checklist
- 13.3 Currency conversion rates for US$
- Currency conversion rates for US$
- 13.4 Research methodology
- Research methodology
- 13.5 Data procurement
- Information sources
- 13.6 Data validation
- Data validation
- 13.7 Validation techniques employed for market sizing
- Validation techniques employed for market sizing
- 13.8 Data synthesis
- Data synthesis
- 13.9 360 degree market analysis
- 360 degree market analysis
- 13.10 List of abbreviations
- List of abbreviations
