|
|
市場調査レポート
商品コード
1723020
開発・製造受託機関アウトソーシング世界市場 2025~2029年Global Contract Development and Manufacturing Organization Outsourcing Market 2025-2029 |
||||||

|
|||||||
カスタマイズ可能
|
|||||||


| 開発・製造受託機関アウトソーシング世界市場 2025~2029年 |
|
出版日: 2025年05月07日
発行: TechNavio
ページ情報: 英文 216 Pages
納期: 即納可能
|

全表示
- 概要
- 図表
- 目次
開発・製造受託機関アウトソーシング市場は2024~2029年に1,864億米ドル、予測期間中のCAGRは19.5%で成長すると予測されます。
当レポートでは、開発・製造受託機関アウトソーシング市場の全体的な分析、市場規模と予測、動向、市場促進要因・課題、約25のベンダーを網羅したベンダー分析などを掲載しています。
現在の市場シナリオ、最新動向と促進要因、市場環境全体に関する最新分析を提供しています。市場を牽引しているのは、製薬業界の成長、ワンストップショップ型開発・製造受託機関への需要の高まり、運用コストと資本コストの削減における開発・製造受託機関のサポートなどです。
| 市場範囲 | |
|---|---|
| 基準年 | 2025年 |
| 終了年 | 2029年 |
| 予測期間 | 2025~2029年 |
| 成長モメンタム | 加速 |
| 前年比2025年 | 14.8% |
| CAGR | 19.5% |
| 増分額 | 1,864億米ドル |
本調査は、業界の主要参加者からのインプットを含め、一次情報と二次情報を客観的に組み合わせて実施しました。本レポートには、主要企業の分析に加え、包括的な市場規模データ、地域別分析によるセグメント、ベンダー情勢が含まれています。レポートには過去データと予測データがあります。
本調査では、開発・製造受託機関によるアナリティクスの利用拡大が、今後数年間の開発・製造受託市場の成長を促進する主な要因の1つであると分析しています。また、細胞治療や遺伝子治療に対する開発・製造受託機関の需要の高まりや、市場統合の増加は、市場の大きな需要につながるでしょう。
目次
第1章 エグゼクティブサマリー
- 市場概要
第2章 Technavio分析
- 価格・ライフサイクル・顧客購入バスケット・採用率・購入基準の分析
- インプットの重要性と差別化の要因
- 混乱の要因
- 促進要因と課題の影響
第3章 市場情勢
- 市場エコシステム
- 市場の特徴
- バリューチェーン分析
第4章 市場規模
- 市場の定義
- 市場セグメント分析
- 市場規模 2024年
- 市場の見通し 2024~2029年
第5章 市場規模実績
- 開発・製造受託機関アウトソーシング世界市場 2019~2023年
- 製品別セグメント分析 2019~2023年
- サービス別セグメント分析 2019~2023年
- エンドユーザー別セグメント分析 2019~2023年
- 地域別セグメント分析 2019~2023年
- 国別セグメント分析 2019~2023年
第6章 定性分析
- AIの影響開発・製造受託機関アウトソーシング世界市場
第7章 ファイブフォース分析
- ファイブフォースの要約
- 買い手の交渉力
- 供給企業の交渉力
- 新規参入業者の脅威
- 代替品の脅威
- 競争の脅威
- 市況
第8章 市場セグメンテーション:製品別
- 市場セグメント
- 比較:製品別
- 低分子:市場規模と予測 2024~2029年
- 生物学的製剤:市場規模と予測 2024~2029年
- 市場機会:製品別
第9章 市場セグメンテーション:サービス別
- 市場セグメント
- 比較:サービス別
- API/バルク医薬品:市場規模と予測 2024~2029年
- 医薬品製造:市場規模と予測 2024~2029年
- パッケージ:市場規模と予測 2024~2029年
- 市場機会:サービス別
第10章 市場セグメンテーション:エンドユーザー別
- 市場セグメント
- 比較:エンドユーザー別
- 製薬会社:市場規模と予測 2024~2029年
- バイオテクノロジー企業:市場規模と予測 2024~2029年
- 政府および学術調査機関:市場規模と予測 2024~2029年
- 市場機会:エンドユーザー別
第11章 顧客情勢
- 顧客情勢の概要
第12章 地域別情勢
- 地域別セグメンテーション
- 地域別比較
- 北米:市場規模と予測 2024~2029年
- 欧州:市場規模と予測 2024~2029年
- アジア太平洋:市場規模と予測 2024~2029年
- 南米:市場規模と予測 2024~2029年
- 中東・アフリカ:市場規模と予測 2024~2029年
- 米国:市場規模と予測 2024~2029年
- 中国:市場規模と予測 2024~2029年
- ドイツ:市場規模と予測 2024~2029年
- インド:市場規模と予測 2024~2029年
- スイス:市場規模と予測 2024~2029年
- カナダ:市場規模と予測 2024~2029年
- フランス:市場規模と予測 2024~2029年
- 韓国:市場規模と予測 2024~2029年
- 英国:市場規模と予測 2024~2029年
- 日本:市場規模と予測 2024~2029年
- 市場機会:地域情勢別
第13章 促進要因・課題・機会・抑制要因
- 市場促進要因
- 市場の課題
- 促進要因と課題の影響
- 市場の機会・抑制要因
第14章 競合情勢
- 概要
- 競合情勢
- 混乱の状況
- 業界のリスク
第15章 競合分析
- 企業プロファイル
- 企業ランキング指数
- 企業の市場ポジショニング
- Aenova Holding GmbH
- Alcami Corp.
- Almac Group Ltd.
- Boehringer Ingelheim International GmbH
- Catalent Inc.
- Celonic AG
- Corden Pharma International GmbH
- Curia Global Inc.
- Eurofins Scientific SE
- FAMAR Health Care Services
- FUJIFILM Holdings Corp.
- Lonza Group Ltd.
- Piramal Enterprises Ltd.
- Recipharm AB
- Siegfried Holding AG
第16章 付録
Exhibits:
- Exhibits1: Executive Summary - Chart on Market Overview
- Exhibits2: Executive Summary - Data Table on Market Overview
- Exhibits3: Executive Summary - Chart on Global Market Characteristics
- Exhibits4: Executive Summary - Chart on Market By Geographical Landscape
- Exhibits5: Executive Summary - Chart on Market Segmentation by Product
- Exhibits6: Executive Summary - Chart on Market Segmentation by Service
- Exhibits7: Executive Summary - Chart on Market Segmentation by End-user
- Exhibits8: Executive Summary - Chart on Incremental Growth
- Exhibits9: Executive Summary - Data Table on Incremental Growth
- Exhibits10: Executive Summary - Chart on Company Market Positioning
- Exhibits11: Analysis of price sensitivity, lifecycle, customer purchase basket, adoption rates, and purchase criteria
- Exhibits12: Overview on criticality of inputs and factors of differentiation
- Exhibits13: Overview on factors of disruption
- Exhibits14: Impact of drivers and challenges in 2024 and 2029
- Exhibits15: Parent Market
- Exhibits16: Data Table on - Parent Market
- Exhibits17: Market characteristics analysis
- Exhibits18: Value chain analysis
- Exhibits19: Offerings of companies included in the market definition
- Exhibits20: Market segments
- Exhibits21: Chart on Global - Market size and forecast 2024-2029 ($ billion)
- Exhibits22: Data Table on Global - Market size and forecast 2024-2029 ($ billion)
- Exhibits23: Chart on Global Market: Year-over-year growth 2024-2029 (%)
- Exhibits24: Data Table on Global Market: Year-over-year growth 2024-2029 (%)
- Exhibits25: Historic Market Size - Data Table on Global Contract Development And Manufacturing Organization Outsourcing Market 2019 - 2023 ($ billion)
- Exhibits26: Historic Market Size - Product Segment 2019 - 2023 ($ billion)
- Exhibits27: Historic Market Size - Service Segment 2019 - 2023 ($ billion)
- Exhibits28: Historic Market Size - End-user Segment 2019 - 2023 ($ billion)
- Exhibits29: Historic Market Size - Geography Segment 2019 - 2023 ($ billion)
- Exhibits30: Historic Market Size - Country Segment 2019 - 2023 ($ billion)
- Exhibits31: Five forces analysis - Comparison between 2024 and 2029
- Exhibits32: Bargaining power of buyers - Impact of key factors 2024 and 2029
- Exhibits33: Bargaining power of suppliers - Impact of key factors in 2024 and 2029
- Exhibits34: Threat of new entrants - Impact of key factors in 2024 and 2029
- Exhibits35: Threat of substitutes - Impact of key factors in 2024 and 2029
- Exhibits36: Threat of rivalry - Impact of key factors in 2024 and 2029
- Exhibits37: Chart on Market condition - Five forces 2024 and 2029
- Exhibits38: Chart on Product - Market share 2024-2029 (%)
- Exhibits39: Data Table on Product - Market share 2024-2029 (%)
- Exhibits40: Chart on Comparison by Product
- Exhibits41: Data Table on Comparison by Product
- Exhibits42: Chart on Small molecules - Market size and forecast 2024-2029 ($ billion)
- Exhibits43: Data Table on Small molecules - Market size and forecast 2024-2029 ($ billion)
- Exhibits44: Chart on Small molecules - Year-over-year growth 2024-2029 (%)
- Exhibits45: Data Table on Small molecules - Year-over-year growth 2024-2029 (%)
- Exhibits46: Chart on Biologics - Market size and forecast 2024-2029 ($ billion)
- Exhibits47: Data Table on Biologics - Market size and forecast 2024-2029 ($ billion)
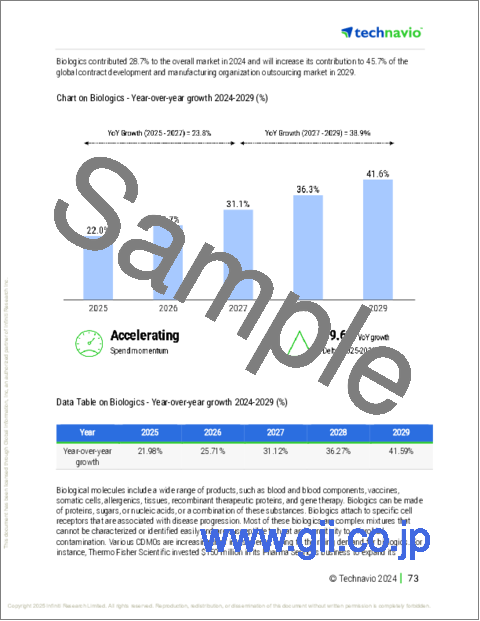
- Exhibits48: Chart on Biologics - Year-over-year growth 2024-2029 (%)
- Exhibits49: Data Table on Biologics - Year-over-year growth 2024-2029 (%)
- Exhibits50: Market opportunity by Product ($ billion)
- Exhibits51: Data Table on Market opportunity by Product ($ billion)
- Exhibits52: Chart on Service - Market share 2024-2029 (%)
- Exhibits53: Data Table on Service - Market share 2024-2029 (%)
- Exhibits54: Chart on Comparison by Service
- Exhibits55: Data Table on Comparison by Service
- Exhibits56: Chart on API/bulk drugs - Market size and forecast 2024-2029 ($ billion)
- Exhibits57: Data Table on API/bulk drugs - Market size and forecast 2024-2029 ($ billion)
- Exhibits58: Chart on API/bulk drugs - Year-over-year growth 2024-2029 (%)
- Exhibits59: Data Table on API/bulk drugs - Year-over-year growth 2024-2029 (%)
- Exhibits60: Chart on Drug product manufacturing - Market size and forecast 2024-2029 ($ billion)
- Exhibits61: Data Table on Drug product manufacturing - Market size and forecast 2024-2029 ($ billion)
- Exhibits62: Chart on Drug product manufacturing - Year-over-year growth 2024-2029 (%)
- Exhibits63: Data Table on Drug product manufacturing - Year-over-year growth 2024-2029 (%)
- Exhibits64: Chart on Packaging - Market size and forecast 2024-2029 ($ billion)
- Exhibits65: Data Table on Packaging - Market size and forecast 2024-2029 ($ billion)
- Exhibits66: Chart on Packaging - Year-over-year growth 2024-2029 (%)
- Exhibits67: Data Table on Packaging - Year-over-year growth 2024-2029 (%)
- Exhibits68: Market opportunity by Service ($ billion)
- Exhibits69: Data Table on Market opportunity by Service ($ billion)
- Exhibits70: Chart on End-user - Market share 2024-2029 (%)
- Exhibits71: Data Table on End-user - Market share 2024-2029 (%)
- Exhibits72: Chart on Comparison by End-user
- Exhibits73: Data Table on Comparison by End-user
- Exhibits74: Chart on Pharmaceutical companies - Market size and forecast 2024-2029 ($ billion)
- Exhibits75: Data Table on Pharmaceutical companies - Market size and forecast 2024-2029 ($ billion)
- Exhibits76: Chart on Pharmaceutical companies - Year-over-year growth 2024-2029 (%)
- Exhibits77: Data Table on Pharmaceutical companies - Year-over-year growth 2024-2029 (%)
- Exhibits78: Chart on Biotechnology companies - Market size and forecast 2024-2029 ($ billion)
- Exhibits79: Data Table on Biotechnology companies - Market size and forecast 2024-2029 ($ billion)
- Exhibits80: Chart on Biotechnology companies - Year-over-year growth 2024-2029 (%)
- Exhibits81: Data Table on Biotechnology companies - Year-over-year growth 2024-2029 (%)
- Exhibits82: Chart on Government and academic research institutes - Market size and forecast 2024-2029 ($ billion)
- Exhibits83: Data Table on Government and academic research institutes - Market size and forecast 2024-2029 ($ billion)
- Exhibits84: Chart on Government and academic research institutes - Year-over-year growth 2024-2029 (%)
- Exhibits85: Data Table on Government and academic research institutes - Year-over-year growth 2024-2029 (%)
- Exhibits86: Market opportunity by End-user ($ billion)
- Exhibits87: Data Table on Market opportunity by End-user ($ billion)
- Exhibits88: Analysis of price sensitivity, lifecycle, customer purchase basket, adoption rates, and purchase criteria
- Exhibits89: Chart on Market share By Geographical Landscape 2024-2029 (%)
- Exhibits90: Data Table on Market share By Geographical Landscape 2024-2029 (%)
- Exhibits91: Chart on Geographic comparison
- Exhibits92: Data Table on Geographic comparison
- Exhibits93: Chart on North America - Market size and forecast 2024-2029 ($ billion)
- Exhibits94: Data Table on North America - Market size and forecast 2024-2029 ($ billion)
- Exhibits95: Chart on North America - Year-over-year growth 2024-2029 (%)
- Exhibits96: Data Table on North America - Year-over-year growth 2024-2029 (%)
- Exhibits97: Chart on Europe - Market size and forecast 2024-2029 ($ billion)
- Exhibits98: Data Table on Europe - Market size and forecast 2024-2029 ($ billion)
- Exhibits99: Chart on Europe - Year-over-year growth 2024-2029 (%)
- Exhibits100: Data Table on Europe - Year-over-year growth 2024-2029 (%)
- Exhibits101: Chart on APAC - Market size and forecast 2024-2029 ($ billion)
- Exhibits102: Data Table on APAC - Market size and forecast 2024-2029 ($ billion)
- Exhibits103: Chart on APAC - Year-over-year growth 2024-2029 (%)
- Exhibits104: Data Table on APAC - Year-over-year growth 2024-2029 (%)
- Exhibits105: Chart on South America - Market size and forecast 2024-2029 ($ billion)
- Exhibits106: Data Table on South America - Market size and forecast 2024-2029 ($ billion)
- Exhibits107: Chart on South America - Year-over-year growth 2024-2029 (%)
- Exhibits108: Data Table on South America - Year-over-year growth 2024-2029 (%)
- Exhibits109: Chart on Middle East and Africa - Market size and forecast 2024-2029 ($ billion)
- Exhibits110: Data Table on Middle East and Africa - Market size and forecast 2024-2029 ($ billion)
- Exhibits111: Chart on Middle East and Africa - Year-over-year growth 2024-2029 (%)
- Exhibits112: Data Table on Middle East and Africa - Year-over-year growth 2024-2029 (%)
- Exhibits113: Chart on US - Market size and forecast 2024-2029 ($ billion)
- Exhibits114: Data Table on US - Market size and forecast 2024-2029 ($ billion)
- Exhibits115: Chart on US - Year-over-year growth 2024-2029 (%)
- Exhibits116: Data Table on US - Year-over-year growth 2024-2029 (%)
- Exhibits117: Chart on China - Market size and forecast 2024-2029 ($ billion)
- Exhibits118: Data Table on China - Market size and forecast 2024-2029 ($ billion)
- Exhibits119: Chart on China - Year-over-year growth 2024-2029 (%)
- Exhibits120: Data Table on China - Year-over-year growth 2024-2029 (%)
- Exhibits121: Chart on Germany - Market size and forecast 2024-2029 ($ billion)
- Exhibits122: Data Table on Germany - Market size and forecast 2024-2029 ($ billion)
- Exhibits123: Chart on Germany - Year-over-year growth 2024-2029 (%)
- Exhibits124: Data Table on Germany - Year-over-year growth 2024-2029 (%)
- Exhibits125: Chart on India - Market size and forecast 2024-2029 ($ billion)
- Exhibits126: Data Table on India - Market size and forecast 2024-2029 ($ billion)
- Exhibits127: Chart on India - Year-over-year growth 2024-2029 (%)
- Exhibits128: Data Table on India - Year-over-year growth 2024-2029 (%)
- Exhibits129: Chart on Switzerland - Market size and forecast 2024-2029 ($ billion)
- Exhibits130: Data Table on Switzerland - Market size and forecast 2024-2029 ($ billion)
- Exhibits131: Chart on Switzerland - Year-over-year growth 2024-2029 (%)
- Exhibits132: Data Table on Switzerland - Year-over-year growth 2024-2029 (%)
- Exhibits133: Chart on Canada - Market size and forecast 2024-2029 ($ billion)
- Exhibits134: Data Table on Canada - Market size and forecast 2024-2029 ($ billion)
- Exhibits135: Chart on Canada - Year-over-year growth 2024-2029 (%)
- Exhibits136: Data Table on Canada - Year-over-year growth 2024-2029 (%)
- Exhibits137: Chart on France - Market size and forecast 2024-2029 ($ billion)
- Exhibits138: Data Table on France - Market size and forecast 2024-2029 ($ billion)
- Exhibits139: Chart on France - Year-over-year growth 2024-2029 (%)
- Exhibits140: Data Table on France - Year-over-year growth 2024-2029 (%)
- Exhibits141: Chart on South Korea - Market size and forecast 2024-2029 ($ billion)
- Exhibits142: Data Table on South Korea - Market size and forecast 2024-2029 ($ billion)
- Exhibits143: Chart on South Korea - Year-over-year growth 2024-2029 (%)
- Exhibits144: Data Table on South Korea - Year-over-year growth 2024-2029 (%)
- Exhibits145: Chart on UK - Market size and forecast 2024-2029 ($ billion)
- Exhibits146: Data Table on UK - Market size and forecast 2024-2029 ($ billion)
- Exhibits147: Chart on UK - Year-over-year growth 2024-2029 (%)
- Exhibits148: Data Table on UK - Year-over-year growth 2024-2029 (%)
- Exhibits149: Chart on Japan - Market size and forecast 2024-2029 ($ billion)
- Exhibits150: Data Table on Japan - Market size and forecast 2024-2029 ($ billion)
- Exhibits151: Chart on Japan - Year-over-year growth 2024-2029 (%)
- Exhibits152: Data Table on Japan - Year-over-year growth 2024-2029 (%)
- Exhibits153: Market opportunity By Geographical Landscape ($ billion)
- Exhibits154: Data Tables on Market opportunity By Geographical Landscape ($ billion)
- Exhibits155: Impact of drivers and challenges in 2024 and 2029
- Exhibits156: Overview on criticality of inputs and factors of differentiation
- Exhibits157: Overview on factors of disruption
- Exhibits158: Impact of key risks on business
- Exhibits159: Companies covered
- Exhibits160: Company ranking index
- Exhibits161: Matrix on companies position and classification
- Exhibits162: Aenova Holding GmbH - Overview
- Exhibits163: Aenova Holding GmbH - Product / Service
- Exhibits164: Aenova Holding GmbH - Key offerings
- Exhibits165: SWOT
- Exhibits166: Alcami Corp. - Overview
- Exhibits167: Alcami Corp. - Product / Service
- Exhibits168: Alcami Corp. - Key offerings
- Exhibits169: SWOT
- Exhibits170: Almac Group Ltd. - Overview
- Exhibits171: Almac Group Ltd. - Product / Service
- Exhibits172: Almac Group Ltd. - Key offerings
- Exhibits173: SWOT
- Exhibits174: Boehringer Ingelheim International GmbH - Overview
- Exhibits175: Boehringer Ingelheim International GmbH - Product / Service
- Exhibits176: Boehringer Ingelheim International GmbH - Key news
- Exhibits177: Boehringer Ingelheim International GmbH - Key offerings
- Exhibits178: SWOT
- Exhibits179: Catalent Inc. - Overview
- Exhibits180: Catalent Inc. - Business segments
- Exhibits181: Catalent Inc. - Key offerings
- Exhibits182: Catalent Inc. - Segment focus
- Exhibits183: SWOT
- Exhibits184: Celonic AG - Overview
- Exhibits185: Celonic AG - Product / Service
- Exhibits186: Celonic AG - Key offerings
- Exhibits187: SWOT
- Exhibits188: Corden Pharma International GmbH - Overview
- Exhibits189: Corden Pharma International GmbH - Product / Service
- Exhibits190: Corden Pharma International GmbH - Key offerings
- Exhibits191: SWOT
- Exhibits192: Curia Global Inc. - Overview
- Exhibits193: Curia Global Inc. - Product / Service
- Exhibits194: Curia Global Inc. - Key offerings
- Exhibits195: SWOT
- Exhibits196: Eurofins Scientific SE - Overview
- Exhibits197: Eurofins Scientific SE - Business segments
- Exhibits198: Eurofins Scientific SE - Key offerings
- Exhibits199: Eurofins Scientific SE - Segment focus
- Exhibits200: SWOT
- Exhibits201: FAMAR Health Care Services - Overview
- Exhibits202: FAMAR Health Care Services - Product / Service
- Exhibits203: FAMAR Health Care Services - Key offerings
- Exhibits204: SWOT
- Exhibits205: FUJIFILM Holdings Corp. - Overview
- Exhibits206: FUJIFILM Holdings Corp. - Business segments
- Exhibits207: FUJIFILM Holdings Corp. - Key news
- Exhibits208: FUJIFILM Holdings Corp. - Key offerings
- Exhibits209: FUJIFILM Holdings Corp. - Segment focus
- Exhibits210: SWOT
- Exhibits211: Lonza Group Ltd. - Overview
- Exhibits212: Lonza Group Ltd. - Business segments
- Exhibits213: Lonza Group Ltd. - Key news
- Exhibits214: Lonza Group Ltd. - Key offerings
- Exhibits215: Lonza Group Ltd. - Segment focus
- Exhibits216: SWOT
- Exhibits217: Piramal Enterprises Ltd. - Overview
- Exhibits218: Piramal Enterprises Ltd. - Product / Service
- Exhibits219: Piramal Enterprises Ltd. - Key offerings
- Exhibits220: SWOT
- Exhibits221: Recipharm AB - Overview
- Exhibits222: Recipharm AB - Business segments
- Exhibits223: Recipharm AB - Key offerings
- Exhibits224: Recipharm AB - Segment focus
- Exhibits225: SWOT
- Exhibits226: Siegfried Holding AG - Overview
- Exhibits227: Siegfried Holding AG - Business segments
- Exhibits228: Siegfried Holding AG - Key offerings
- Exhibits229: Siegfried Holding AG - Segment focus
- Exhibits230: SWOT
- Exhibits231: Inclusions checklist
- Exhibits232: Exclusions checklist
- Exhibits233: Currency conversion rates for US$
- Exhibits234: Research methodology
- Exhibits235: Information sources
- Exhibits236: Data validation
- Exhibits237: Validation techniques employed for market sizing
- Exhibits238: Data synthesis
- Exhibits239: 360 degree market analysis
- Exhibits240: List of abbreviations
The contract development and manufacturing organization outsourcing market is forecasted to grow by USD 186.4 bn during 2024-2029, accelerating at a CAGR of 19.5% during the forecast period. The report on the contract development and manufacturing organization outsourcing market provides a holistic analysis, market size and forecast, trends, growth drivers, and challenges, as well as vendor analysis covering around 25 vendors.
The report offers an up-to-date analysis regarding the current market scenario, the latest trends and drivers, and the overall market environment. The market is driven by growing pharmaceutical industry, increasing demand for one-stop-shop cdmos, and support of cdmo in reducing operational and capital expenses.
| Market Scope | |
|---|---|
| Base Year | 2025 |
| End Year | 2029 |
| Series Year | 2025-2029 |
| Growth Momentum | Accelerate |
| YOY 2025 | 14.8% |
| CAGR | 19.5% |
| Incremental Value | $186.4 bn |
The study was conducted using an objective combination of primary and secondary information including inputs from key participants in the industry. The report contains a comprehensive market size data, segment with regional analysis and vendor landscape in addition to an analysis of the key companies. Reports have historic and forecast data.
Technavio's contract development and manufacturing organization outsourcing market is segmented as below:
By Product
- Small molecules
- Biologics
By Service
- API/bulk drugs
- Drug product manufacturing
- Packaging
By End-user
- Pharmaceutical companies
- Biotechnology companies
- Government and academic research institutes
By Geographical Landscape
- North America
- Europe
- APAC
- South America
- Middle East and Africa
This study identifies the growing use of analytics by cdmos as one of the prime reasons driving the contract development and manufacturing organization outsourcing market growth during the next few years. Also, growing demand for cdmos for cell and gene therapies and increasing market consolidation will lead to sizable demand in the market.
The report on the contract development and manufacturing organization outsourcing market covers the following areas:
- Contract Development And Manufacturing Organization Outsourcing Market sizing
- Contract Development And Manufacturing Organization Outsourcing Market forecast
- Contract Development And Manufacturing Organization Outsourcing Market industry analysis
The robust vendor analysis is designed to help clients improve their market position, and in line with this, this report provides a detailed analysis of several leading contract development and manufacturing organization outsourcing market vendors that include Aenova Holding GmbH, Alcami Corp., Almac Group Ltd., Boehringer Ingelheim International GmbH, Catalent Inc., Celonic AG, Corden Pharma International GmbH, Curia Global Inc., Eurofins Scientific SE, FAMAR Health Care Services, FUJIFILM Holdings Corp., Laboratory Corp. of America Holdings, Lonza Group Ltd., NextPharma GmbH, Piramal Enterprises Ltd., Recipharm AB, Siegfried Holding AG, The Lubrizol Corp., Thermo Fisher Scientific Inc., and Vetter Pharma Fertigung GmbH and Co. KG. Also, the contract development and manufacturing organization outsourcing market analysis report includes information on upcoming trends and challenges that will influence market growth. This is to help companies strategize and leverage all forthcoming growth opportunities.
The publisher presents a detailed picture of the market by the way of study, synthesis, and summation of data from multiple sources by an analysis of key parameters such as profit, pricing, competition, and promotions. It presents various market facets by identifying the key industry influencers. The data presented is comprehensive, reliable, and a result of extensive primary and secondary research. The market research reports provide a complete competitive landscape and an in-depth vendor selection methodology and analysis using qualitative and quantitative research to forecast accurate market growth.
Table of Contents
1 Executive Summary
- 1.1 Market overview
- Executive Summary - Chart on Market Overview
- Executive Summary - Data Table on Market Overview
- Executive Summary - Chart on Global Market Characteristics
- Executive Summary - Chart on Market By Geographical Landscape
- Executive Summary - Chart on Market Segmentation by Product
- Executive Summary - Chart on Market Segmentation by Service
- Executive Summary - Chart on Market Segmentation by End-user
- Executive Summary - Chart on Incremental Growth
- Executive Summary - Data Table on Incremental Growth
- Executive Summary - Chart on Company Market Positioning
2 Technavio Analysis
- 2.1 Analysis of price sensitivity, lifecycle, customer purchase basket, adoption rates, and purchase criteria
- Analysis of price sensitivity, lifecycle, customer purchase basket, adoption rates, and purchase criteria
- 2.2 Criticality of inputs and Factors of differentiation
- Overview on criticality of inputs and factors of differentiation
- 2.3 Factors of disruption
- Overview on factors of disruption
- 2.4 Impact of drivers and challenges
- Impact of drivers and challenges in 2024 and 2029
3 Market Landscape
- 3.1 Market ecosystem
- Parent Market
- Data Table on - Parent Market
- 3.2 Market characteristics
- Market characteristics analysis
- 3.3 Value chain analysis
- Value chain analysis
4 Market Sizing
- 4.1 Market definition
- Offerings of companies included in the market definition
- 4.2 Market segment analysis
- Market segments
- 4.3 Market size 2024
- 4.4 Market outlook: Forecast for 2024-2029
- Chart on Global - Market size and forecast 2024-2029 ($ billion)
- Data Table on Global - Market size and forecast 2024-2029 ($ billion)
- Chart on Global Market: Year-over-year growth 2024-2029 (%)
- Data Table on Global Market: Year-over-year growth 2024-2029 (%)
5 Historic Market Size
- 5.1 Global Contract Development And Manufacturing Organization Outsourcing Market 2019 - 2023
- Historic Market Size - Data Table on Global Contract Development And Manufacturing Organization Outsourcing Market 2019 - 2023 ($ billion)
- 5.2 Product segment analysis 2019 - 2023
- Historic Market Size - Product Segment 2019 - 2023 ($ billion)
- 5.3 Service segment analysis 2019 - 2023
- Historic Market Size - Service Segment 2019 - 2023 ($ billion)
- 5.4 End-user segment analysis 2019 - 2023
- Historic Market Size - End-user Segment 2019 - 2023 ($ billion)
- 5.5 Geography segment analysis 2019 - 2023
- Historic Market Size - Geography Segment 2019 - 2023 ($ billion)
- 5.6 Country segment analysis 2019 - 2023
- Historic Market Size - Country Segment 2019 - 2023 ($ billion)
6 Qualitative Analysis
- 6.1 Impact of AI in global contract development and manufacturing organization outsourcing market
7 Five Forces Analysis
- 7.1 Five forces summary
- Five forces analysis - Comparison between 2024 and 2029
- 7.2 Bargaining power of buyers
- Bargaining power of buyers - Impact of key factors 2024 and 2029
- 7.3 Bargaining power of suppliers
- Bargaining power of suppliers - Impact of key factors in 2024 and 2029
- 7.4 Threat of new entrants
- Threat of new entrants - Impact of key factors in 2024 and 2029
- 7.5 Threat of substitutes
- Threat of substitutes - Impact of key factors in 2024 and 2029
- 7.6 Threat of rivalry
- Threat of rivalry - Impact of key factors in 2024 and 2029
- 7.7 Market condition
- Chart on Market condition - Five forces 2024 and 2029
8 Market Segmentation by Product
- 8.1 Market segments
- Chart on Product - Market share 2024-2029 (%)
- Data Table on Product - Market share 2024-2029 (%)
- 8.2 Comparison by Product
- Chart on Comparison by Product
- Data Table on Comparison by Product
- 8.3 Small molecules - Market size and forecast 2024-2029
- Chart on Small molecules - Market size and forecast 2024-2029 ($ billion)
- Data Table on Small molecules - Market size and forecast 2024-2029 ($ billion)
- Chart on Small molecules - Year-over-year growth 2024-2029 (%)
- Data Table on Small molecules - Year-over-year growth 2024-2029 (%)
- 8.4 Biologics - Market size and forecast 2024-2029
- Chart on Biologics - Market size and forecast 2024-2029 ($ billion)
- Data Table on Biologics - Market size and forecast 2024-2029 ($ billion)
- Chart on Biologics - Year-over-year growth 2024-2029 (%)
- Data Table on Biologics - Year-over-year growth 2024-2029 (%)
- 8.5 Market opportunity by Product
- Market opportunity by Product ($ billion)
- Data Table on Market opportunity by Product ($ billion)
9 Market Segmentation by Service
- 9.1 Market segments
- Chart on Service - Market share 2024-2029 (%)
- Data Table on Service - Market share 2024-2029 (%)
- 9.2 Comparison by Service
- Chart on Comparison by Service
- Data Table on Comparison by Service
- 9.3 API/bulk drugs - Market size and forecast 2024-2029
- Chart on API/bulk drugs - Market size and forecast 2024-2029 ($ billion)
- Data Table on API/bulk drugs - Market size and forecast 2024-2029 ($ billion)
- Chart on API/bulk drugs - Year-over-year growth 2024-2029 (%)
- Data Table on API/bulk drugs - Year-over-year growth 2024-2029 (%)
- 9.4 Drug product manufacturing - Market size and forecast 2024-2029
- Chart on Drug product manufacturing - Market size and forecast 2024-2029 ($ billion)
- Data Table on Drug product manufacturing - Market size and forecast 2024-2029 ($ billion)
- Chart on Drug product manufacturing - Year-over-year growth 2024-2029 (%)
- Data Table on Drug product manufacturing - Year-over-year growth 2024-2029 (%)
- 9.5 Packaging - Market size and forecast 2024-2029
- Chart on Packaging - Market size and forecast 2024-2029 ($ billion)
- Data Table on Packaging - Market size and forecast 2024-2029 ($ billion)
- Chart on Packaging - Year-over-year growth 2024-2029 (%)
- Data Table on Packaging - Year-over-year growth 2024-2029 (%)
- 9.6 Market opportunity by Service
- Market opportunity by Service ($ billion)
- Data Table on Market opportunity by Service ($ billion)
10 Market Segmentation by End-user
- 10.1 Market segments
- Chart on End-user - Market share 2024-2029 (%)
- Data Table on End-user - Market share 2024-2029 (%)
- 10.2 Comparison by End-user
- Chart on Comparison by End-user
- Data Table on Comparison by End-user
- 10.3 Pharmaceutical companies - Market size and forecast 2024-2029
- Chart on Pharmaceutical companies - Market size and forecast 2024-2029 ($ billion)
- Data Table on Pharmaceutical companies - Market size and forecast 2024-2029 ($ billion)
- Chart on Pharmaceutical companies - Year-over-year growth 2024-2029 (%)
- Data Table on Pharmaceutical companies - Year-over-year growth 2024-2029 (%)
- 10.4 Biotechnology companies - Market size and forecast 2024-2029
- Chart on Biotechnology companies - Market size and forecast 2024-2029 ($ billion)
- Data Table on Biotechnology companies - Market size and forecast 2024-2029 ($ billion)
- Chart on Biotechnology companies - Year-over-year growth 2024-2029 (%)
- Data Table on Biotechnology companies - Year-over-year growth 2024-2029 (%)
- 10.5 Government and academic research institutes - Market size and forecast 2024-2029
- Chart on Government and academic research institutes - Market size and forecast 2024-2029 ($ billion)
- Data Table on Government and academic research institutes - Market size and forecast 2024-2029 ($ billion)
- Chart on Government and academic research institutes - Year-over-year growth 2024-2029 (%)
- Data Table on Government and academic research institutes - Year-over-year growth 2024-2029 (%)
- 10.6 Market opportunity by End-user
- Market opportunity by End-user ($ billion)
- Data Table on Market opportunity by End-user ($ billion)
11 Customer Landscape
- 11.1 Customer landscape overview
- Analysis of price sensitivity, lifecycle, customer purchase basket, adoption rates, and purchase criteria
12 Geographic Landscape
- 12.1 Geographic segmentation
- Chart on Market share By Geographical Landscape 2024-2029 (%)
- Data Table on Market share By Geographical Landscape 2024-2029 (%)
- 12.2 Geographic comparison
- Chart on Geographic comparison
- Data Table on Geographic comparison
- 12.3 North America - Market size and forecast 2024-2029
- Chart on North America - Market size and forecast 2024-2029 ($ billion)
- Data Table on North America - Market size and forecast 2024-2029 ($ billion)
- Chart on North America - Year-over-year growth 2024-2029 (%)
- Data Table on North America - Year-over-year growth 2024-2029 (%)
- 12.4 Europe - Market size and forecast 2024-2029
- Chart on Europe - Market size and forecast 2024-2029 ($ billion)
- Data Table on Europe - Market size and forecast 2024-2029 ($ billion)
- Chart on Europe - Year-over-year growth 2024-2029 (%)
- Data Table on Europe - Year-over-year growth 2024-2029 (%)
- 12.5 APAC - Market size and forecast 2024-2029
- Chart on APAC - Market size and forecast 2024-2029 ($ billion)
- Data Table on APAC - Market size and forecast 2024-2029 ($ billion)
- Chart on APAC - Year-over-year growth 2024-2029 (%)
- Data Table on APAC - Year-over-year growth 2024-2029 (%)
- 12.6 South America - Market size and forecast 2024-2029
- Chart on South America - Market size and forecast 2024-2029 ($ billion)
- Data Table on South America - Market size and forecast 2024-2029 ($ billion)
- Chart on South America - Year-over-year growth 2024-2029 (%)
- Data Table on South America - Year-over-year growth 2024-2029 (%)
- 12.7 Middle East and Africa - Market size and forecast 2024-2029
- Chart on Middle East and Africa - Market size and forecast 2024-2029 ($ billion)
- Data Table on Middle East and Africa - Market size and forecast 2024-2029 ($ billion)
- Chart on Middle East and Africa - Year-over-year growth 2024-2029 (%)
- Data Table on Middle East and Africa - Year-over-year growth 2024-2029 (%)
- 12.8 US - Market size and forecast 2024-2029
- Chart on US - Market size and forecast 2024-2029 ($ billion)
- Data Table on US - Market size and forecast 2024-2029 ($ billion)
- Chart on US - Year-over-year growth 2024-2029 (%)
- Data Table on US - Year-over-year growth 2024-2029 (%)
- 12.9 China - Market size and forecast 2024-2029
- Chart on China - Market size and forecast 2024-2029 ($ billion)
- Data Table on China - Market size and forecast 2024-2029 ($ billion)
- Chart on China - Year-over-year growth 2024-2029 (%)
- Data Table on China - Year-over-year growth 2024-2029 (%)
- 12.10 Germany - Market size and forecast 2024-2029
- Chart on Germany - Market size and forecast 2024-2029 ($ billion)
- Data Table on Germany - Market size and forecast 2024-2029 ($ billion)
- Chart on Germany - Year-over-year growth 2024-2029 (%)
- Data Table on Germany - Year-over-year growth 2024-2029 (%)
- 12.11 India - Market size and forecast 2024-2029
- Chart on India - Market size and forecast 2024-2029 ($ billion)
- Data Table on India - Market size and forecast 2024-2029 ($ billion)
- Chart on India - Year-over-year growth 2024-2029 (%)
- Data Table on India - Year-over-year growth 2024-2029 (%)
- 12.12 Switzerland - Market size and forecast 2024-2029
- Chart on Switzerland - Market size and forecast 2024-2029 ($ billion)
- Data Table on Switzerland - Market size and forecast 2024-2029 ($ billion)
- Chart on Switzerland - Year-over-year growth 2024-2029 (%)
- Data Table on Switzerland - Year-over-year growth 2024-2029 (%)
- 12.13 Canada - Market size and forecast 2024-2029
- Chart on Canada - Market size and forecast 2024-2029 ($ billion)
- Data Table on Canada - Market size and forecast 2024-2029 ($ billion)
- Chart on Canada - Year-over-year growth 2024-2029 (%)
- Data Table on Canada - Year-over-year growth 2024-2029 (%)
- 12.14 France - Market size and forecast 2024-2029
- Chart on France - Market size and forecast 2024-2029 ($ billion)
- Data Table on France - Market size and forecast 2024-2029 ($ billion)
- Chart on France - Year-over-year growth 2024-2029 (%)
- Data Table on France - Year-over-year growth 2024-2029 (%)
- 12.15 South Korea - Market size and forecast 2024-2029
- Chart on South Korea - Market size and forecast 2024-2029 ($ billion)
- Data Table on South Korea - Market size and forecast 2024-2029 ($ billion)
- Chart on South Korea - Year-over-year growth 2024-2029 (%)
- Data Table on South Korea - Year-over-year growth 2024-2029 (%)
- 12.16 UK - Market size and forecast 2024-2029
- Chart on UK - Market size and forecast 2024-2029 ($ billion)
- Data Table on UK - Market size and forecast 2024-2029 ($ billion)
- Chart on UK - Year-over-year growth 2024-2029 (%)
- Data Table on UK - Year-over-year growth 2024-2029 (%)
- 12.17 Japan - Market size and forecast 2024-2029
- Chart on Japan - Market size and forecast 2024-2029 ($ billion)
- Data Table on Japan - Market size and forecast 2024-2029 ($ billion)
- Chart on Japan - Year-over-year growth 2024-2029 (%)
- Data Table on Japan - Year-over-year growth 2024-2029 (%)
- 12.18 Market opportunity By Geographical Landscape
- Market opportunity By Geographical Landscape ($ billion)
- Data Tables on Market opportunity By Geographical Landscape ($ billion)
13 Drivers, Challenges, and Opportunity/Restraints
- 13.1 Market drivers
- 13.2 Market challenges
- 13.3 Impact of drivers and challenges
- Impact of drivers and challenges in 2024 and 2029
- 13.4 Market opportunities/restraints
14 Competitive Landscape
- 14.1 Overview
- 14.2 Competitive Landscape
- Overview on criticality of inputs and factors of differentiation
- 14.3 Landscape disruption
- Overview on factors of disruption
- 14.4 Industry risks
- Impact of key risks on business
15 Competitive Analysis
- 15.1 Companies profiled
- Companies covered
- 15.2 Company ranking index
- Company ranking index
- 15.3 Market positioning of companies
- Matrix on companies position and classification
- 15.4 Aenova Holding GmbH
- Aenova Holding GmbH - Overview
- Aenova Holding GmbH - Product / Service
- Aenova Holding GmbH - Key offerings
- SWOT
- 15.5 Alcami Corp.
- Alcami Corp. - Overview
- Alcami Corp. - Product / Service
- Alcami Corp. - Key offerings
- SWOT
- 15.6 Almac Group Ltd.
- Almac Group Ltd. - Overview
- Almac Group Ltd. - Product / Service
- Almac Group Ltd. - Key offerings
- SWOT
- 15.7 Boehringer Ingelheim International GmbH
- Boehringer Ingelheim International GmbH - Overview
- Boehringer Ingelheim International GmbH - Product / Service
- Boehringer Ingelheim International GmbH - Key news
- Boehringer Ingelheim International GmbH - Key offerings
- SWOT
- 15.8 Catalent Inc.
- Catalent Inc. - Overview
- Catalent Inc. - Business segments
- Catalent Inc. - Key offerings
- Catalent Inc. - Segment focus
- SWOT
- 15.9 Celonic AG
- Celonic AG - Overview
- Celonic AG - Product / Service
- Celonic AG - Key offerings
- SWOT
- 15.10 Corden Pharma International GmbH
- Corden Pharma International GmbH - Overview
- Corden Pharma International GmbH - Product / Service
- Corden Pharma International GmbH - Key offerings
- SWOT
- 15.11 Curia Global Inc.
- Curia Global Inc. - Overview
- Curia Global Inc. - Product / Service
- Curia Global Inc. - Key offerings
- SWOT
- 15.12 Eurofins Scientific SE
- Eurofins Scientific SE - Overview
- Eurofins Scientific SE - Business segments
- Eurofins Scientific SE - Key offerings
- Eurofins Scientific SE - Segment focus
- SWOT
- 15.13 FAMAR Health Care Services
- FAMAR Health Care Services - Overview
- FAMAR Health Care Services - Product / Service
- FAMAR Health Care Services - Key offerings
- SWOT
- 15.14 FUJIFILM Holdings Corp.
- FUJIFILM Holdings Corp. - Overview
- FUJIFILM Holdings Corp. - Business segments
- FUJIFILM Holdings Corp. - Key news
- FUJIFILM Holdings Corp. - Key offerings
- FUJIFILM Holdings Corp. - Segment focus
- SWOT
- 15.15 Lonza Group Ltd.
- Lonza Group Ltd. - Overview
- Lonza Group Ltd. - Business segments
- Lonza Group Ltd. - Key news
- Lonza Group Ltd. - Key offerings
- Lonza Group Ltd. - Segment focus
- SWOT
- 15.16 Piramal Enterprises Ltd.
- Piramal Enterprises Ltd. - Overview
- Piramal Enterprises Ltd. - Product / Service
- Piramal Enterprises Ltd. - Key offerings
- SWOT
- 15.17 Recipharm AB
- Recipharm AB - Overview
- Recipharm AB - Business segments
- Recipharm AB - Key offerings
- Recipharm AB - Segment focus
- SWOT
- 15.18 Siegfried Holding AG
- Siegfried Holding AG - Overview
- Siegfried Holding AG - Business segments
- Siegfried Holding AG - Key offerings
- Siegfried Holding AG - Segment focus
- SWOT
16 Appendix
- 16.1 Scope of the report
- 16.2 Inclusions and exclusions checklist
- Inclusions checklist
- Exclusions checklist
- 16.3 Currency conversion rates for US$
- Currency conversion rates for US$
- 16.4 Research methodology
- Research methodology
- 16.5 Data procurement
- Information sources
- 16.6 Data validation
- Data validation
- 16.7 Validation techniques employed for market sizing
- Validation techniques employed for market sizing
- 16.8 Data synthesis
- Data synthesis
- 16.9 360 degree market analysis
- 360 degree market analysis
- 16.10 List of abbreviations
- List of abbreviations

