|
|
市場調査レポート
商品コード
1501997
自動車用LiDARセンサーの世界市場 2024-2028Global automotive LiDAR sensors market 2024-2028 |
||||||
|
|||||||
カスタマイズ可能
|
|||||||

| 自動車用LiDARセンサーの世界市場 2024-2028 |
|
出版日: 2024年05月17日
発行: TechNavio
ページ情報: 英文 170 Pages
納期: 即納可能
|

全表示
- 概要
- 図表
- 目次
自動車用LiDARセンサー市場は2023-2028年に6億9,360万米ドル、予測期間中のCAGRは22.08%で成長すると予測されます。
当レポートでは、自動車用LiDARセンサー市場の全体的な分析、市場規模・予測、動向、成長促進要因、課題、約25のベンダーを網羅したベンダー分析などを掲載しています。
現在の市場シナリオ、最新動向と促進要因、市場環境全体に関する最新分析を提供しています。市場は、自律走行車技術の急速な発展、ADASにおけるライダーセンサーの重要な役割、より汎用性の高い固体ライダーセンサーの開発によって牽引されています。
| 市場範囲 | |
|---|---|
| 基準年 | 2024 |
| 終了年 | 2028 |
| 予測期間 | 2024-2028 |
| 成長モメンタム | 加速 |
| 前年比2024年 | 17.79% |
| CAGR | 22.08% |
| 増分額 | 6億9,360万米ドル |
本調査では、ライダーセンサの継続的なコスト削減が、今後数年間の自動車用LiDARセンサー市場成長を牽引する主要因の1つであると指摘しています。また、ビジョン、レーダー、ライダーセンサからのデータを結合し、レンジ汎用性を生み出すために使用されるセンサフュージョンや、連続波周波数変調(CFM)技術に基づくライダーセンサは、市場の大きな需要につながります。
目次
第1章 エグゼクティブサマリー
- 市場概要
第2章 市場情勢
- 市場エコシステム
- 市場の特徴
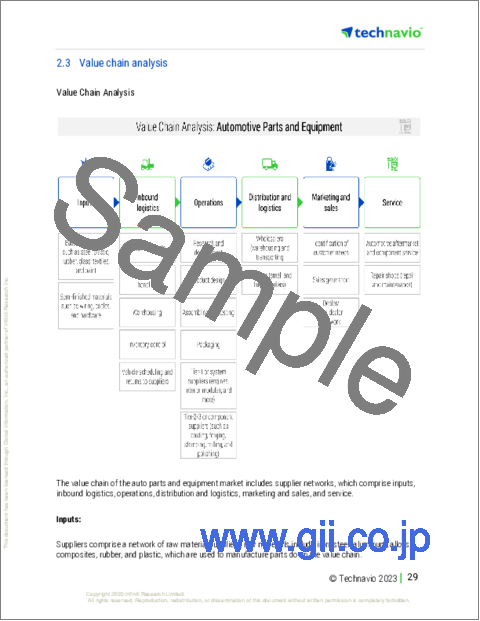
- バリューチェーン分析
第3章 市場規模の評価
- 市場の定義
- 市場セグメント分析
- 市場規模 2023
- 市場の見通し 2023-2028
第4章 市場規模実績
- 世界の自動車用LiDARセンサー市場 2018-2022
- 用途別セグメント分析 2018-2022
- 技術別セグメント分析 2018-2022
- 地域別セグメント分析 2018-2022
- 国別セグメント分析 2018-2022
第5章 ファイブフォース分析
- ファイブフォースの要約
- 買い手の交渉力
- 供給企業の交渉力
- 新規参入業者の脅威
- 代替品の脅威
- 競争の脅威
- 市況
第6章 市場セグメンテーション:用途別
- 市場セグメンテーション
- 比較:用途別
- ADAS:市場規模と予測 2023-2028
- 自律運転車:市場規模と予測 2023-2028
- 市場機会:用途別
第7章 市場セグメンテーション:技術別
- 市場セグメンテーション
- 比較:技術別
- ソリッドステート:市場規模と予測 2023-2028
- 電気機械:市場規模と予測 2023-2028
- 市場機会:技術別
第8章 顧客情勢
- 顧客情勢の概要
第9章 地域別情勢
- 地域別セグメンテーション
- 地域別比較
- 北米:市場規模と予測 2023-2028
- 欧州:市場規模と予測 2023-2028
- アジア太平洋:市場規模と予測 2023-2028
- 中東・アフリカ:市場規模と予測 2023-2028
- 南米:市場規模と予測 2023-2028
- 米国:市場規模と予測 2023-2028
- ドイツ:市場規模と予測 2023-2028
- 中国:市場規模と予測 2023-2028
- カナダ:市場規模と予測 2023-2028
- 日本:市場規模と予測 2023-2028
- 市場機会:地域別
第10章 促進要因・課題・機会・抑制要因
- 市場促進要因
- 市場の課題
- 促進要因と課題の影響
- 市場の機会・抑制要因
第11章 競合情勢
- 概要
- 競合情勢
- 混乱の状況
- 業界のリスク
第12章 競合分析
- 企業プロファイル
- 企業の市場ポジショニング
- Benewake Beijing Co. Ltd
- Cepton Inc.
- Continental AG
- DENSO Corp.
- HELLA GmbH and Co. KGaA
- Ibeo Automotive Systems GmbH
- Infineon Technologies AG
- Innoviz Technologies Ltd.
- LeddarTech Inc.
- Leishen Intelligent Systems Co. Ltd.
- Lumibird Canada
- Luminar Technologies Inc.
- Ouster Inc.
- Quanergy Systems Inc.
- TE Connectivity Ltd.
第13章 付録
Exhibits:
- Exhibits1: Executive Summary - Chart on Market Overview
- Exhibits2: Executive Summary - Data Table on Market Overview
- Exhibits3: Executive Summary - Chart on Global Market Characteristics
- Exhibits4: Executive Summary - Chart on Market by Geography
- Exhibits5: Executive Summary - Chart on Market Segmentation by Application
- Exhibits6: Executive Summary - Chart on Market Segmentation by Technology
- Exhibits7: Executive Summary - Chart on Incremental Growth
- Exhibits8: Executive Summary - Data Table on Incremental Growth
- Exhibits9: Executive Summary - Chart on Company Market Positioning
- Exhibits10: Parent Market
- Exhibits11: Data Table on - Parent Market
- Exhibits12: Market characteristics analysis
- Exhibits13: Value Chain Analysis
- Exhibits14: Offerings of companies included in the market definition
- Exhibits15: Market segments
- Exhibits16: Chart on Global - Market size and forecast 2023-2028 ($ million)
- Exhibits17: Data Table on Global - Market size and forecast 2023-2028 ($ million)
- Exhibits18: Chart on Global Market: Year-over-year growth 2023-2028 (%)
- Exhibits19: Data Table on Global Market: Year-over-year growth 2023-2028 (%)
- Exhibits20: Historic Market Size - Data Table on Global Automotive LiDAR Sensors Market 2018 - 2022 ($ million)
- Exhibits21: Historic Market Size - Application Segment 2018 - 2022 ($ million)
- Exhibits22: Historic Market Size - Technology Segment 2018 - 2022 ($ million)
- Exhibits23: Historic Market Size - Geography Segment 2018 - 2022 ($ million)
- Exhibits24: Historic Market Size - Country Segment 2018 - 2022 ($ million)
- Exhibits25: Five forces analysis - Comparison between 2023 and 2028
- Exhibits26: Bargaining power of buyers - Impact of key factors 2023 and 2028
- Exhibits27: Bargaining power of suppliers - Impact of key factors in 2023 and 2028
- Exhibits28: Threat of new entrants - Impact of key factors in 2023 and 2028
- Exhibits29: Threat of substitutes - Impact of key factors in 2023 and 2028
- Exhibits30: Threat of rivalry - Impact of key factors in 2023 and 2028
- Exhibits31: Chart on Market condition - Five forces 2023 and 2028
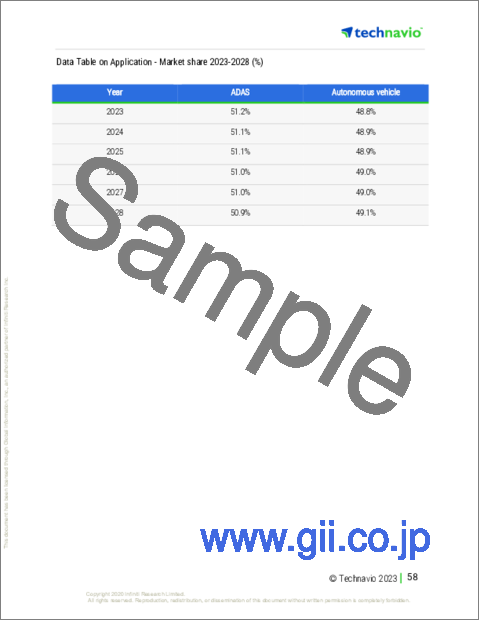
- Exhibits32: Chart on Application - Market share 2023-2028 (%)
- Exhibits33: Data Table on Application - Market share 2023-2028 (%)
- Exhibits34: Chart on Comparison by Application
- Exhibits35: Data Table on Comparison by Application
- Exhibits36: Chart on ADAS - Market size and forecast 2023-2028 ($ million)
- Exhibits37: Data Table on ADAS - Market size and forecast 2023-2028 ($ million)
- Exhibits38: Chart on ADAS - Year-over-year growth 2023-2028 (%)
- Exhibits39: Data Table on ADAS - Year-over-year growth 2023-2028 (%)
- Exhibits40: Chart on Autonomous vehicle - Market size and forecast 2023-2028 ($ million)
- Exhibits41: Data Table on Autonomous vehicle - Market size and forecast 2023-2028 ($ million)
- Exhibits42: Chart on Autonomous vehicle - Year-over-year growth 2023-2028 (%)
- Exhibits43: Data Table on Autonomous vehicle - Year-over-year growth 2023-2028 (%)
- Exhibits44: Market opportunity by Application ($ million)
- Exhibits45: Data Table on Market opportunity by Application ($ million)
- Exhibits46: Chart on Technology - Market share 2023-2028 (%)
- Exhibits47: Data Table on Technology - Market share 2023-2028 (%)
- Exhibits48: Chart on Comparison by Technology
- Exhibits49: Data Table on Comparison by Technology
- Exhibits50: Chart on Solid-state - Market size and forecast 2023-2028 ($ million)
- Exhibits51: Data Table on Solid-state - Market size and forecast 2023-2028 ($ million)
- Exhibits52: Chart on Solid-state - Year-over-year growth 2023-2028 (%)
- Exhibits53: Data Table on Solid-state - Year-over-year growth 2023-2028 (%)
- Exhibits54: Chart on Electro mechanical - Market size and forecast 2023-2028 ($ million)
- Exhibits55: Data Table on Electro mechanical - Market size and forecast 2023-2028 ($ million)
- Exhibits56: Chart on Electro mechanical - Year-over-year growth 2023-2028 (%)
- Exhibits57: Data Table on Electro mechanical - Year-over-year growth 2023-2028 (%)
- Exhibits58: Market opportunity by Technology ($ million)
- Exhibits59: Data Table on Market opportunity by Technology ($ million)
- Exhibits60: Analysis of price sensitivity, lifecycle, customer purchase basket, adoption rates, and purchase criteria
- Exhibits61: Chart on Market share By Geographical Landscape2023-2028 (%)
- Exhibits62: Data Table on Market share By Geographical Landscape2023-2028 (%)
- Exhibits63: Chart on Geographic comparison
- Exhibits64: Data Table on Geographic comparison
- Exhibits65: Chart on North America - Market size and forecast 2023-2028 ($ million)
- Exhibits66: Data Table on North America - Market size and forecast 2023-2028 ($ million)
- Exhibits67: Chart on North America - Year-over-year growth 2023-2028 (%)
- Exhibits68: Data Table on North America - Year-over-year growth 2023-2028 (%)
- Exhibits69: Chart on Europe - Market size and forecast 2023-2028 ($ million)
- Exhibits70: Data Table on Europe - Market size and forecast 2023-2028 ($ million)
- Exhibits71: Chart on Europe - Year-over-year growth 2023-2028 (%)
- Exhibits72: Data Table on Europe - Year-over-year growth 2023-2028 (%)
- Exhibits73: Chart on APAC - Market size and forecast 2023-2028 ($ million)
- Exhibits74: Data Table on APAC - Market size and forecast 2023-2028 ($ million)
- Exhibits75: Chart on APAC - Year-over-year growth 2023-2028 (%)
- Exhibits76: Data Table on APAC - Year-over-year growth 2023-2028 (%)
- Exhibits77: Chart on Middle East and Africa - Market size and forecast 2023-2028 ($ million)
- Exhibits78: Data Table on Middle East and Africa - Market size and forecast 2023-2028 ($ million)
- Exhibits79: Chart on Middle East and Africa - Year-over-year growth 2023-2028 (%)
- Exhibits80: Data Table on Middle East and Africa - Year-over-year growth 2023-2028 (%)
- Exhibits81: Chart on South America - Market size and forecast 2023-2028 ($ million)
- Exhibits82: Data Table on South America - Market size and forecast 2023-2028 ($ million)
- Exhibits83: Chart on South America - Year-over-year growth 2023-2028 (%)
- Exhibits84: Data Table on South America - Year-over-year growth 2023-2028 (%)
- Exhibits85: Chart on US - Market size and forecast 2023-2028 ($ million)
- Exhibits86: Data Table on US - Market size and forecast 2023-2028 ($ million)
- Exhibits87: Chart on US - Year-over-year growth 2023-2028 (%)
- Exhibits88: Data Table on US - Year-over-year growth 2023-2028 (%)
- Exhibits89: Chart on Germany - Market size and forecast 2023-2028 ($ million)
- Exhibits90: Data Table on Germany - Market size and forecast 2023-2028 ($ million)
- Exhibits91: Chart on Germany - Year-over-year growth 2023-2028 (%)
- Exhibits92: Data Table on Germany - Year-over-year growth 2023-2028 (%)
- Exhibits93: Chart on China - Market size and forecast 2023-2028 ($ million)
- Exhibits94: Data Table on China - Market size and forecast 2023-2028 ($ million)
- Exhibits95: Chart on China - Year-over-year growth 2023-2028 (%)
- Exhibits96: Data Table on China - Year-over-year growth 2023-2028 (%)
- Exhibits97: Chart on Canada - Market size and forecast 2023-2028 ($ million)
- Exhibits98: Data Table on Canada - Market size and forecast 2023-2028 ($ million)
- Exhibits99: Chart on Canada - Year-over-year growth 2023-2028 (%)
- Exhibits100: Data Table on Canada - Year-over-year growth 2023-2028 (%)
- Exhibits101: Chart on Japan - Market size and forecast 2023-2028 ($ million)
- Exhibits102: Data Table on Japan - Market size and forecast 2023-2028 ($ million)
- Exhibits103: Chart on Japan - Year-over-year growth 2023-2028 (%)
- Exhibits104: Data Table on Japan - Year-over-year growth 2023-2028 (%)
- Exhibits105: Market opportunity By Geographical Landscape($ million)
- Exhibits106: Data Tables on Market opportunity By Geographical Landscape($ million)
- Exhibits107: Impact of drivers and challenges in 2023 and 2028
- Exhibits108: Overview on criticality of inputs and factors of differentiation
- Exhibits109: Overview on factors of disruption
- Exhibits110: Impact of key risks on business
- Exhibits111: Companies covered
- Exhibits112: Matrix on companies position and classification
- Exhibits113: Benewake Beijing Co. Ltd - Overview
- Exhibits114: Benewake Beijing Co. Ltd - Product / Service
- Exhibits115: Benewake Beijing Co. Ltd - Key offerings
- Exhibits116: Cepton Inc. - Overview
- Exhibits117: Cepton Inc. - Product / Service
- Exhibits118: Cepton Inc. - Key offerings
- Exhibits119: Continental AG - Overview
- Exhibits120: Continental AG - Business segments
- Exhibits121: Continental AG - Key offerings
- Exhibits122: Continental AG - Segment focus
- Exhibits123: DENSO Corp. - Overview
- Exhibits124: DENSO Corp. - Business segments
- Exhibits125: DENSO Corp. - Key news
- Exhibits126: DENSO Corp. - Key offerings
- Exhibits127: DENSO Corp. - Segment focus
- Exhibits128: HELLA GmbH and Co. KGaA - Overview
- Exhibits129: HELLA GmbH and Co. KGaA - Business segments
- Exhibits130: HELLA GmbH and Co. KGaA - Key offerings
- Exhibits131: HELLA GmbH and Co. KGaA - Segment focus
- Exhibits132: Ibeo Automotive Systems GmbH - Overview
- Exhibits133: Ibeo Automotive Systems GmbH - Product / Service
- Exhibits134: Ibeo Automotive Systems GmbH - Key offerings
- Exhibits135: Infineon Technologies AG - Overview
- Exhibits136: Infineon Technologies AG - Business segments
- Exhibits137: Infineon Technologies AG - Key offerings
- Exhibits138: Infineon Technologies AG - Segment focus
- Exhibits139: Innoviz Technologies Ltd. - Overview
- Exhibits140: Innoviz Technologies Ltd. - Business segments
- Exhibits141: Innoviz Technologies Ltd. - Key offerings
- Exhibits142: Innoviz Technologies Ltd. - Segment focus
- Exhibits143: LeddarTech Inc. - Overview
- Exhibits144: LeddarTech Inc. - Product / Service
- Exhibits145: LeddarTech Inc. - Key offerings
- Exhibits146: Leishen Intelligent Systems Co. Ltd. - Overview
- Exhibits147: Leishen Intelligent Systems Co. Ltd. - Product / Service
- Exhibits148: Leishen Intelligent Systems Co. Ltd. - Key offerings
- Exhibits149: Lumibird Canada - Overview
- Exhibits150: Lumibird Canada - Product / Service
- Exhibits151: Lumibird Canada - Key offerings
- Exhibits152: Luminar Technologies Inc. - Overview
- Exhibits153: Luminar Technologies Inc. - Business segments
- Exhibits154: Luminar Technologies Inc. - Key offerings
- Exhibits155: Luminar Technologies Inc. - Segment focus
- Exhibits156: Ouster Inc. - Overview
- Exhibits157: Ouster Inc. - Product / Service
- Exhibits158: Ouster Inc. - Key offerings
- Exhibits159: Quanergy Systems Inc. - Overview
- Exhibits160: Quanergy Systems Inc. - Product / Service
- Exhibits161: Quanergy Systems Inc. - Key offerings
- Exhibits162: TE Connectivity Ltd. - Overview
- Exhibits163: TE Connectivity Ltd. - Business segments
- Exhibits164: TE Connectivity Ltd. - Key offerings
- Exhibits165: TE Connectivity Ltd. - Segment focus
- Exhibits166: Inclusions checklist
- Exhibits167: Exclusions checklist
- Exhibits168: Currency conversion rates for US$
- Exhibits169: Research methodology
- Exhibits170: Information sources
- Exhibits171: Data validation
- Exhibits172: Validation techniques employed for market sizing
- Exhibits173: Data synthesis
- Exhibits174: 360 degree market analysis
- Exhibits175: List of abbreviations
The automotive Lidar sensors market is forecasted to grow by USD 693.6 mn during 2023-2028, accelerating at a CAGR of 22.08% during the forecast period. The report on the automotive Lidar sensors market provides a holistic analysis, market size and forecast, trends, growth drivers, and challenges, as well as vendor analysis covering around 25 vendors.
The report offers an up-to-date analysis regarding the current market scenario, the latest trends and drivers, and the overall market environment. The market is driven by rapid developments in autonomous vehicle technology, key role of Lidar sensors in ADAS, and development of more versatile solid-state Lidar sensors.
Technavio's automotive Lidar sensors market is segmented as below:
| Market Scope | |
|---|---|
| Base Year | 2024 |
| End Year | 2028 |
| Series Year | 2024-2028 |
| Growth Momentum | Accelerate |
| YOY 2024 | 17.79% |
| CAGR | 22.08% |
| Incremental Value | $693.6mn |
By Application
- ADAS
- Autonomous vehicle
By Technology
- Solid-state
- Electro mechanical
By Geography
- North America
- Europe
- APAC
- Middle East and Africa
- South America
This study identifies the continuous cost reduction of lidar sensors as one of the prime reasons driving the automotive lidar sensors market growth during the next few years. Also, sensor fusion to be used to combine data from vision, radar, and lidar sensors and create range versatility and lidar sensors based on continuous-wave frequency modulation (CFM) technology will lead to sizable demand in the market.
The report on the automotive Lidar sensors market covers the following areas:
- Automotive Lidar sensors market sizing
- Automotive Lidar sensors market forecast
- Automotive Lidar sensors market industry analysis
The robust vendor analysis is designed to help clients improve their market position, and in line with this, this report provides a detailed analysis of several leading automotive lidar sensors market vendors that include Benewake Beijing Co. Ltd, Cepton Inc., Continental AG, DENSO Corp., HELLA GmbH and Co. KGaA, Ibeo Automotive Systems GmbH, Infineon Technologies AG, Innoviz Technologies Ltd., LeddarTech Inc., Leishen Intelligent Systems Co. Ltd., Lumibird Canada, Luminar Technologies Inc., Ouster Inc., Quanergy Systems Inc., TE Connectivity Ltd., TetraVue Inc., Valeo SA, Velodyne Lidar Inc., and ZF Friedrichshafen AG. Also, the automotive lidar sensors market analysis report includes information on upcoming trends and challenges that will influence market growth. This is to help companies strategize and leverage all forthcoming growth opportunities.
The study was conducted using an objective combination of primary and secondary information including inputs from key participants in the industry. The report contains a comprehensive market and vendor landscape in addition to an analysis of the key vendors.
The publisher presents a detailed picture of the market by the way of study, synthesis, and summation of data from multiple sources by an analysis of key parameters such as profit, pricing, competition, and promotions. It presents various market facets by identifying the key industry influencers. The data presented is comprehensive, reliable, and a result of extensive research - both primary and secondary. The market research reports provide a complete competitive landscape and an in-depth vendor selection methodology and analysis using qualitative and quantitative research to forecast the accurate market growth.
Table of Contents
1 Executive Summary
- 1.1 Market overview
- Executive Summary - Chart on Market Overview
- Executive Summary - Data Table on Market Overview
- Executive Summary - Chart on Global Market Characteristics
- Executive Summary - Chart on Market by Geography
- Executive Summary - Chart on Market Segmentation by Application
- Executive Summary - Chart on Market Segmentation by Technology
- Executive Summary - Chart on Incremental Growth
- Executive Summary - Data Table on Incremental Growth
- Executive Summary - Chart on Company Market Positioning
2 Market Landscape
- 2.1 Market ecosystem
- Parent Market
- Data Table on - Parent Market
- 2.2 Market characteristics
- Market characteristics analysis
- 2.3 Value chain analysis
- Value Chain Analysis
3 Market Sizing
- 3.1 Market definition
- Offerings of companies included in the market definition
- 3.2 Market segment analysis
- Market segments
- 3.3 Market size 2023
- 3.4 Market outlook: Forecast for 2023-2028
- Chart on Global - Market size and forecast 2023-2028 ($ million)
- Data Table on Global - Market size and forecast 2023-2028 ($ million)
- Chart on Global Market: Year-over-year growth 2023-2028 (%)
- Data Table on Global Market: Year-over-year growth 2023-2028 (%)
4 Historic Market Size
- 4.1 Global Automotive LiDAR Sensors Market 2018 - 2022
- Historic Market Size - Data Table on Global Automotive LiDAR Sensors Market 2018 - 2022 ($ million)
- 4.2 Application segment analysis 2018 - 2022
- Historic Market Size - Application Segment 2018 - 2022 ($ million)
- 4.3 Technology segment analysis 2018 - 2022
- Historic Market Size - Technology Segment 2018 - 2022 ($ million)
- 4.4 Geography segment analysis 2018 - 2022
- Historic Market Size - Geography Segment 2018 - 2022 ($ million)
- 4.5 Country segment analysis 2018 - 2022
- Historic Market Size - Country Segment 2018 - 2022 ($ million)
5 Five Forces Analysis
- 5.1 Five forces summary
- Five forces analysis - Comparison between 2023 and 2028
- 5.2 Bargaining power of buyers
- Bargaining power of buyers - Impact of key factors 2023 and 2028
- 5.3 Bargaining power of suppliers
- Bargaining power of suppliers - Impact of key factors in 2023 and 2028
- 5.4 Threat of new entrants
- Threat of new entrants - Impact of key factors in 2023 and 2028
- 5.5 Threat of substitutes
- Threat of substitutes - Impact of key factors in 2023 and 2028
- 5.6 Threat of rivalry
- Threat of rivalry - Impact of key factors in 2023 and 2028
- 5.7 Market condition
- Chart on Market condition - Five forces 2023 and 2028
6 Market Segmentation by Application
- 6.1 Market segments
- Chart on Application - Market share 2023-2028 (%)
- Data Table on Application - Market share 2023-2028 (%)
- 6.2 Comparison by Application
- Chart on Comparison by Application
- Data Table on Comparison by Application
- 6.3 ADAS - Market size and forecast 2023-2028
- Chart on ADAS - Market size and forecast 2023-2028 ($ million)
- Data Table on ADAS - Market size and forecast 2023-2028 ($ million)
- Chart on ADAS - Year-over-year growth 2023-2028 (%)
- Data Table on ADAS - Year-over-year growth 2023-2028 (%)
- 6.4 Autonomous vehicle - Market size and forecast 2023-2028
- Chart on Autonomous vehicle - Market size and forecast 2023-2028 ($ million)
- Data Table on Autonomous vehicle - Market size and forecast 2023-2028 ($ million)
- Chart on Autonomous vehicle - Year-over-year growth 2023-2028 (%)
- Data Table on Autonomous vehicle - Year-over-year growth 2023-2028 (%)
- 6.5 Market opportunity by Application
- Market opportunity by Application ($ million)
- Data Table on Market opportunity by Application ($ million)
7 Market Segmentation by Technology
- 7.1 Market segments
- Chart on Technology - Market share 2023-2028 (%)
- Data Table on Technology - Market share 2023-2028 (%)
- 7.2 Comparison by Technology
- Chart on Comparison by Technology
- Data Table on Comparison by Technology
- 7.3 Solid-state - Market size and forecast 2023-2028
- Chart on Solid-state - Market size and forecast 2023-2028 ($ million)
- Data Table on Solid-state - Market size and forecast 2023-2028 ($ million)
- Chart on Solid-state - Year-over-year growth 2023-2028 (%)
- Data Table on Solid-state - Year-over-year growth 2023-2028 (%)
- 7.4 Electro mechanical - Market size and forecast 2023-2028
- Chart on Electro mechanical - Market size and forecast 2023-2028 ($ million)
- Data Table on Electro mechanical - Market size and forecast 2023-2028 ($ million)
- Chart on Electro mechanical - Year-over-year growth 2023-2028 (%)
- Data Table on Electro mechanical - Year-over-year growth 2023-2028 (%)
- 7.5 Market opportunity by Technology
- Market opportunity by Technology ($ million)
- Data Table on Market opportunity by Technology ($ million)
8 Customer Landscape
- 8.1 Customer landscape overview
- Analysis of price sensitivity, lifecycle, customer purchase basket, adoption rates, and purchase criteria
9 Geographic Landscape
- 9.1 Geographic segmentation
- Chart on Market share By Geographical Landscape2023-2028 (%)
- Data Table on Market share By Geographical Landscape2023-2028 (%)
- 9.2 Geographic comparison
- Chart on Geographic comparison
- Data Table on Geographic comparison
- 9.3 North America - Market size and forecast 2023-2028
- Chart on North America - Market size and forecast 2023-2028 ($ million)
- Data Table on North America - Market size and forecast 2023-2028 ($ million)
- Chart on North America - Year-over-year growth 2023-2028 (%)
- Data Table on North America - Year-over-year growth 2023-2028 (%)
- 9.4 Europe - Market size and forecast 2023-2028
- Chart on Europe - Market size and forecast 2023-2028 ($ million)
- Data Table on Europe - Market size and forecast 2023-2028 ($ million)
- Chart on Europe - Year-over-year growth 2023-2028 (%)
- Data Table on Europe - Year-over-year growth 2023-2028 (%)
- 9.5 APAC - Market size and forecast 2023-2028
- Chart on APAC - Market size and forecast 2023-2028 ($ million)
- Data Table on APAC - Market size and forecast 2023-2028 ($ million)
- Chart on APAC - Year-over-year growth 2023-2028 (%)
- Data Table on APAC - Year-over-year growth 2023-2028 (%)
- 9.6 Middle East and Africa - Market size and forecast 2023-2028
- Chart on Middle East and Africa - Market size and forecast 2023-2028 ($ million)
- Data Table on Middle East and Africa - Market size and forecast 2023-2028 ($ million)
- Chart on Middle East and Africa - Year-over-year growth 2023-2028 (%)
- Data Table on Middle East and Africa - Year-over-year growth 2023-2028 (%)
- 9.7 South America - Market size and forecast 2023-2028
- Chart on South America - Market size and forecast 2023-2028 ($ million)
- Data Table on South America - Market size and forecast 2023-2028 ($ million)
- Chart on South America - Year-over-year growth 2023-2028 (%)
- Data Table on South America - Year-over-year growth 2023-2028 (%)
- 9.8 US - Market size and forecast 2023-2028
- Chart on US - Market size and forecast 2023-2028 ($ million)
- Data Table on US - Market size and forecast 2023-2028 ($ million)
- Chart on US - Year-over-year growth 2023-2028 (%)
- Data Table on US - Year-over-year growth 2023-2028 (%)
- 9.9 Germany - Market size and forecast 2023-2028
- Chart on Germany - Market size and forecast 2023-2028 ($ million)
- Data Table on Germany - Market size and forecast 2023-2028 ($ million)
- Chart on Germany - Year-over-year growth 2023-2028 (%)
- Data Table on Germany - Year-over-year growth 2023-2028 (%)
- 9.10 China - Market size and forecast 2023-2028
- Chart on China - Market size and forecast 2023-2028 ($ million)
- Data Table on China - Market size and forecast 2023-2028 ($ million)
- Chart on China - Year-over-year growth 2023-2028 (%)
- Data Table on China - Year-over-year growth 2023-2028 (%)
- 9.11 Canada - Market size and forecast 2023-2028
- Chart on Canada - Market size and forecast 2023-2028 ($ million)
- Data Table on Canada - Market size and forecast 2023-2028 ($ million)
- Chart on Canada - Year-over-year growth 2023-2028 (%)
- Data Table on Canada - Year-over-year growth 2023-2028 (%)
- 9.12 Japan - Market size and forecast 2023-2028
- Chart on Japan - Market size and forecast 2023-2028 ($ million)
- Data Table on Japan - Market size and forecast 2023-2028 ($ million)
- Chart on Japan - Year-over-year growth 2023-2028 (%)
- Data Table on Japan - Year-over-year growth 2023-2028 (%)
- 9.13 Market opportunity by geography
- Market opportunity By Geographical Landscape($ million)
- Data Tables on Market opportunity By Geographical Landscape($ million)
10 Drivers, Challenges, and Opportunity/Restraints
- 10.1 Market drivers
- 10.2 Market challenges
- 10.3 Impact of drivers and challenges
- Impact of drivers and challenges in 2023 and 2028
- 10.4 Market opportunities/restraints
11 Competitive Landscape
- 11.1 Overview
- 11.2 Competitive Landscape
- Overview on criticality of inputs and factors of differentiation
- 11.3 Landscape disruption
- Overview on factors of disruption
- 11.4 Industry risks
- Impact of key risks on business
12 Competitive Analysis
- 12.1 Companies profiled
- Companies covered
- 12.2 Market positioning of companies
- Matrix on companies position and classification
- 12.3 Benewake Beijing Co. Ltd
- Benewake Beijing Co. Ltd - Overview
- Benewake Beijing Co. Ltd - Product / Service
- Benewake Beijing Co. Ltd - Key offerings
- 12.4 Cepton Inc.
- Cepton Inc. - Overview
- Cepton Inc. - Product / Service
- Cepton Inc. - Key offerings
- 12.5 Continental AG
- Continental AG - Overview
- Continental AG - Business segments
- Continental AG - Key offerings
- Continental AG - Segment focus
- 12.6 DENSO Corp.
- DENSO Corp. - Overview
- DENSO Corp. - Business segments
- DENSO Corp. - Key news
- DENSO Corp. - Key offerings
- DENSO Corp. - Segment focus
- 12.7 HELLA GmbH and Co. KGaA
- HELLA GmbH and Co. KGaA - Overview
- HELLA GmbH and Co. KGaA - Business segments
- HELLA GmbH and Co. KGaA - Key offerings
- HELLA GmbH and Co. KGaA - Segment focus
- 12.8 Ibeo Automotive Systems GmbH
- Ibeo Automotive Systems GmbH - Overview
- Ibeo Automotive Systems GmbH - Product / Service
- Ibeo Automotive Systems GmbH - Key offerings
- 12.9 Infineon Technologies AG
- Infineon Technologies AG - Overview
- Infineon Technologies AG - Business segments
- Infineon Technologies AG - Key offerings
- Infineon Technologies AG - Segment focus
- 12.10 Innoviz Technologies Ltd.
- Innoviz Technologies Ltd. - Overview
- Innoviz Technologies Ltd. - Business segments
- Innoviz Technologies Ltd. - Key offerings
- Innoviz Technologies Ltd. - Segment focus
- 12.11 LeddarTech Inc.
- LeddarTech Inc. - Overview
- LeddarTech Inc. - Product / Service
- LeddarTech Inc. - Key offerings
- 12.12 Leishen Intelligent Systems Co. Ltd.
- Leishen Intelligent Systems Co. Ltd. - Overview
- Leishen Intelligent Systems Co. Ltd. - Product / Service
- Leishen Intelligent Systems Co. Ltd. - Key offerings
- 12.13 Lumibird Canada
- Lumibird Canada - Overview
- Lumibird Canada - Product / Service
- Lumibird Canada - Key offerings
- 12.14 Luminar Technologies Inc.
- Luminar Technologies Inc. - Overview
- Luminar Technologies Inc. - Business segments
- Luminar Technologies Inc. - Key offerings
- Luminar Technologies Inc. - Segment focus
- 12.15 Ouster Inc.
- Ouster Inc. - Overview
- Ouster Inc. - Product / Service
- Ouster Inc. - Key offerings
- 12.16 Quanergy Systems Inc.
- Quanergy Systems Inc. - Overview
- Quanergy Systems Inc. - Product / Service
- Quanergy Systems Inc. - Key offerings
- 12.17 TE Connectivity Ltd.
- TE Connectivity Ltd. - Overview
- TE Connectivity Ltd. - Business segments
- TE Connectivity Ltd. - Key offerings
- TE Connectivity Ltd. - Segment focus
13 Appendix
- 13.1 Scope of the report
- 13.2 Inclusions and exclusions checklist
- Inclusions checklist
- Exclusions checklist
- 13.3 Currency conversion rates for US$
- Currency conversion rates for US$
- 13.4 Research methodology
- Research methodology
- 13.5 Data procurement
- Information sources
- 13.6 Data validation
- Data validation
- 13.7 Validation techniques employed for market sizing
- Validation techniques employed for market sizing
- 13.8 Data synthesis
- Data synthesis
- 13.9 360 degree market analysis
- 360 degree market analysis
- 13.10 List of abbreviations
- List of abbreviations
