|
|
市場調査レポート
商品コード
1491594
ドローン物流と輸送の世界市場 2024-2028Global drone logistics and transportation market 2024-2028 |
||||||

|
|||||||
カスタマイズ可能
|
|||||||


| ドローン物流と輸送の世界市場 2024-2028 |
|
出版日: 2024年05月21日
発行: TechNavio
ページ情報: 英文 168 Pages
納期: 即納可能
|

全表示
- 概要
- 図表
- 目次
ドローン物流と輸送市場は2023-2028年に290億990万米ドル、予測期間中のCAGRは27.77%で成長すると予測されます。
この調査レポートは、ドローン物流と輸送市場の全体分析、市場規模・予測、動向、成長促進要因、課題、約25のベンダーを網羅したベンダー分析などを掲載しています。
現在の市場シナリオ、最新動向と促進要因、市場環境全体に関する最新分析を提供しています。市場は、ドローンの用途の増加、eコマース企業によるドローンの利用の増加、ドローンによる輸送と物流の効率化のための先端技術の利用が牽引しています。
| 市場範囲 | |
|---|---|
| 基準年 | 2024 |
| 終了年 | 2028 |
| 予測期間 | 2024-2028 |
| 成長モメンタム | 加速 |
| 前年比2024年 | 22.76% |
| CAGR | 27.77% |
| 増分額 | 290億990万米ドル |
本調査では、今後数年間のドローン物流と輸送市場成長を促進する主な理由の1つとして、買収とパートナーシップの増加を挙げています。また、商用ドローンの新たな市場開発と発売、ドローン輸送と物流におけるブロックチェーン技術の利用は、市場の大きな需要につながります。
目次
第1章 エグゼクティブサマリー
- 市場概要
第2章 市場情勢
- 市場エコシステム
- 市場の特徴
- バリューチェーン分析
第3章 市場規模の評価
- 市場の定義
- 市場セグメント分析
- 市場規模 2023
- 市場の見通し 2023-2028
第4章 市場規模実績
- 世界ドローン物流と輸送市場 2018-2022
- ソリューションセグメント分析 2018-2022
- 用途別セグメント分析 2018-2022
- 地域別セグメント分析 2018-2022
- 国別セグメント分析 2018-2022
第5章 ファイブフォース分析
- ファイブフォースの要約
- 買い手の交渉力
- 供給企業の交渉力
- 新規参入業者の脅威
- 代替品の脅威
- 競争の脅威
- 市況
第6章 市場セグメンテーション:ソリューション別
- 市場セグメンテーション
- 比較:ソリューション別
- システム:市場規模と予測 2023-2028
- ソフトウェア:市場規模と予測 2023-2028
- インフラストラクチャー:市場規模と予測 2023-2028
- 市場機会:ソリューション別
第7章 市場セグメンテーション:用途別
- 市場セグメンテーション
- 比較:用途別
- 交通機関:市場規模と予測 2023-2028
- 倉庫保管:市場規模と予測 2023-2028
- 市場機会:用途別
第8章 顧客情勢
- 顧客情勢の概要
第9章 地域別情勢
- 地域別セグメンテーション
- 地域別比較
- 北米:市場規模と予測 2023-2028
- 欧州:市場規模と予測 2023-2028
- アジア太平洋:市場規模と予測 2023-2028
- 南米:市場規模と予測 2023-2028
- 中東・アフリカ:市場規模と予測 2023-2028
- 米国:市場規模と予測 2023-2028
- ドイツ:市場規模と予測 2023-2028
- 中国:市場規模と予測 2023-2028
- 英国:市場規模と予測 2023-2028
- 日本:市場規模と予測 2023-2028
- 市場機会:地域情勢別
第10章 促進要因・課題・機会・抑制要因
- 市場促進要因
- 市場の課題
- 促進要因と課題の影響
- 市場の機会・抑制要因
第11章 競合情勢
- 概要
- 競合情勢
- 混乱の状況
- 業界のリスク
第12章 競合分析
- 企業プロファイル
- 企業の市場ポジショニング
- Alphabet Inc.
- Amazon.com Inc.
- Deutsche Post AG
- Drone Delivery Canada Corp.
- Drone Scan
- Flytrex Inc.
- HARDIS Groupe
- Infinium Robotics
- Matternet
- Skydrop LLC
- United Parcel Service Inc.
- Volocopter GmbH
- Wingcopter GmbH
- WORKHORSE GROUP INC.
- Zipline International Inc.
第13章 付録
Exhibits:
- Exhibits1: Executive Summary - Chart on Market Overview
- Exhibits2: Executive Summary - Data Table on Market Overview
- Exhibits3: Executive Summary - Chart on Global Market Characteristics
- Exhibits4: Executive Summary - Chart on Market By Geographical Landscape
- Exhibits5: Executive Summary - Chart on Market Segmentation by Solution
- Exhibits6: Executive Summary - Chart on Market Segmentation by Application
- Exhibits7: Executive Summary - Chart on Incremental Growth
- Exhibits8: Executive Summary - Data Table on Incremental Growth
- Exhibits9: Executive Summary - Chart on Company Market Positioning
- Exhibits10: Parent Market
- Exhibits11: Data Table on - Parent Market
- Exhibits12: Market characteristics analysis
- Exhibits13: Value Chain Analysis
- Exhibits14: Offerings of companies included in the market definition
- Exhibits15: Market segments
- Exhibits16: Chart on Global - Market size and forecast 2023-2028 ($ million)
- Exhibits17: Data Table on Global - Market size and forecast 2023-2028 ($ million)
- Exhibits18: Chart on Global Market: Year-over-year growth 2023-2028 (%)
- Exhibits19: Data Table on Global Market: Year-over-year growth 2023-2028 (%)
- Exhibits20: Historic Market Size - Data Table on Global Drone Logistics And Transportation Market 2018 - 2022 ($ million)
- Exhibits21: Historic Market Size - Solution Segment 2018 - 2022 ($ million)
- Exhibits22: Historic Market Size - Application Segment 2018 - 2022 ($ million)
- Exhibits23: Historic Market Size - Geography Segment 2018 - 2022 ($ million)
- Exhibits24: Historic Market Size - Country Segment 2018 - 2022 ($ million)
- Exhibits25: Five forces analysis - Comparison between 2023 and 2028
- Exhibits26: Bargaining power of buyers - Impact of key factors 2023 and 2028
- Exhibits27: Bargaining power of suppliers - Impact of key factors in 2023 and 2028
- Exhibits28: Threat of new entrants - Impact of key factors in 2023 and 2028
- Exhibits29: Threat of substitutes - Impact of key factors in 2023 and 2028
- Exhibits30: Threat of rivalry - Impact of key factors in 2023 and 2028
- Exhibits31: Chart on Market condition - Five forces 2023 and 2028
- Exhibits32: Chart on Solution - Market share 2023-2028 (%)
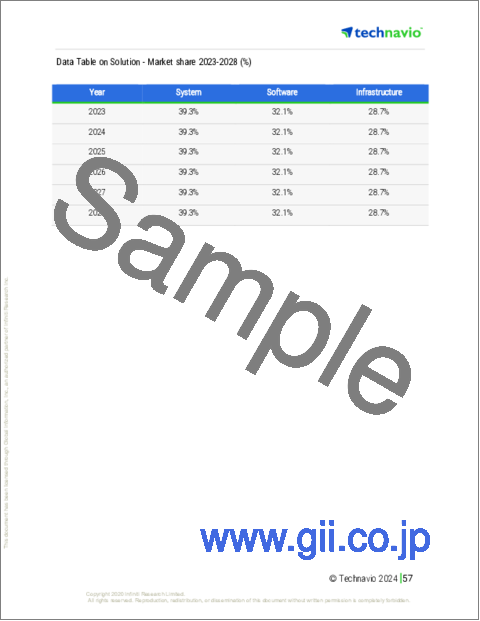
- Exhibits33: Data Table on Solution - Market share 2023-2028 (%)
- Exhibits34: Chart on Comparison by Solution
- Exhibits35: Data Table on Comparison by Solution
- Exhibits36: Chart on System - Market size and forecast 2023-2028 ($ million)
- Exhibits37: Data Table on System - Market size and forecast 2023-2028 ($ million)
- Exhibits38: Chart on System - Year-over-year growth 2023-2028 (%)
- Exhibits39: Data Table on System - Year-over-year growth 2023-2028 (%)
- Exhibits40: Chart on Software - Market size and forecast 2023-2028 ($ million)
- Exhibits41: Data Table on Software - Market size and forecast 2023-2028 ($ million)
- Exhibits42: Chart on Software - Year-over-year growth 2023-2028 (%)
- Exhibits43: Data Table on Software - Year-over-year growth 2023-2028 (%)
- Exhibits44: Chart on Infrastructure - Market size and forecast 2023-2028 ($ million)
- Exhibits45: Data Table on Infrastructure - Market size and forecast 2023-2028 ($ million)
- Exhibits46: Chart on Infrastructure - Year-over-year growth 2023-2028 (%)
- Exhibits47: Data Table on Infrastructure - Year-over-year growth 2023-2028 (%)
- Exhibits48: Market opportunity by Solution ($ million)
- Exhibits49: Data Table on Market opportunity by Solution ($ million)
- Exhibits50: Chart on Application - Market share 2023-2028 (%)
- Exhibits51: Data Table on Application - Market share 2023-2028 (%)
- Exhibits52: Chart on Comparison by Application
- Exhibits53: Data Table on Comparison by Application
- Exhibits54: Chart on Transportation - Market size and forecast 2023-2028 ($ million)
- Exhibits55: Data Table on Transportation - Market size and forecast 2023-2028 ($ million)
- Exhibits56: Chart on Transportation - Year-over-year growth 2023-2028 (%)
- Exhibits57: Data Table on Transportation - Year-over-year growth 2023-2028 (%)
- Exhibits58: Chart on Warehousing - Market size and forecast 2023-2028 ($ million)
- Exhibits59: Data Table on Warehousing - Market size and forecast 2023-2028 ($ million)
- Exhibits60: Chart on Warehousing - Year-over-year growth 2023-2028 (%)
- Exhibits61: Data Table on Warehousing - Year-over-year growth 2023-2028 (%)
- Exhibits62: Market opportunity by Application ($ million)
- Exhibits63: Data Table on Market opportunity by Application ($ million)
- Exhibits64: Analysis of price sensitivity, lifecycle, customer purchase basket, adoption rates, and purchase criteria
- Exhibits65: Chart on Market share By Geographical Landscape 2023-2028 (%)
- Exhibits66: Data Table on Market share By Geographical Landscape 2023-2028 (%)
- Exhibits67: Chart on Geographic comparison
- Exhibits68: Data Table on Geographic comparison
- Exhibits69: Chart on North America - Market size and forecast 2023-2028 ($ million)
- Exhibits70: Data Table on North America - Market size and forecast 2023-2028 ($ million)
- Exhibits71: Chart on North America - Year-over-year growth 2023-2028 (%)
- Exhibits72: Data Table on North America - Year-over-year growth 2023-2028 (%)
- Exhibits73: Chart on Europe - Market size and forecast 2023-2028 ($ million)
- Exhibits74: Data Table on Europe - Market size and forecast 2023-2028 ($ million)
- Exhibits75: Chart on Europe - Year-over-year growth 2023-2028 (%)
- Exhibits76: Data Table on Europe - Year-over-year growth 2023-2028 (%)
- Exhibits77: Chart on APAC - Market size and forecast 2023-2028 ($ million)
- Exhibits78: Data Table on APAC - Market size and forecast 2023-2028 ($ million)
- Exhibits79: Chart on APAC - Year-over-year growth 2023-2028 (%)
- Exhibits80: Data Table on APAC - Year-over-year growth 2023-2028 (%)
- Exhibits81: Chart on South America - Market size and forecast 2023-2028 ($ million)
- Exhibits82: Data Table on South America - Market size and forecast 2023-2028 ($ million)
- Exhibits83: Chart on South America - Year-over-year growth 2023-2028 (%)
- Exhibits84: Data Table on South America - Year-over-year growth 2023-2028 (%)
- Exhibits85: Chart on Middle East and Africa - Market size and forecast 2023-2028 ($ million)
- Exhibits86: Data Table on Middle East and Africa - Market size and forecast 2023-2028 ($ million)
- Exhibits87: Chart on Middle East and Africa - Year-over-year growth 2023-2028 (%)
- Exhibits88: Data Table on Middle East and Africa - Year-over-year growth 2023-2028 (%)
- Exhibits89: Chart on US - Market size and forecast 2023-2028 ($ million)
- Exhibits90: Data Table on US - Market size and forecast 2023-2028 ($ million)
- Exhibits91: Chart on US - Year-over-year growth 2023-2028 (%)
- Exhibits92: Data Table on US - Year-over-year growth 2023-2028 (%)
- Exhibits93: Chart on Germany - Market size and forecast 2023-2028 ($ million)
- Exhibits94: Data Table on Germany - Market size and forecast 2023-2028 ($ million)
- Exhibits95: Chart on Germany - Year-over-year growth 2023-2028 (%)
- Exhibits96: Data Table on Germany - Year-over-year growth 2023-2028 (%)
- Exhibits97: Chart on China - Market size and forecast 2023-2028 ($ million)
- Exhibits98: Data Table on China - Market size and forecast 2023-2028 ($ million)
- Exhibits99: Chart on China - Year-over-year growth 2023-2028 (%)
- Exhibits100: Data Table on China - Year-over-year growth 2023-2028 (%)
- Exhibits101: Chart on UK - Market size and forecast 2023-2028 ($ million)
- Exhibits102: Data Table on UK - Market size and forecast 2023-2028 ($ million)
- Exhibits103: Chart on UK - Year-over-year growth 2023-2028 (%)
- Exhibits104: Data Table on UK - Year-over-year growth 2023-2028 (%)
- Exhibits105: Chart on Japan - Market size and forecast 2023-2028 ($ million)
- Exhibits106: Data Table on Japan - Market size and forecast 2023-2028 ($ million)
- Exhibits107: Chart on Japan - Year-over-year growth 2023-2028 (%)
- Exhibits108: Data Table on Japan - Year-over-year growth 2023-2028 (%)
- Exhibits109: Market opportunity By Geographical Landscape ($ million)
- Exhibits110: Data Tables on Market opportunity By Geographical Landscape ($ million)
- Exhibits111: Impact of drivers and challenges in 2023 and 2028
- Exhibits112: Overview on criticality of inputs and factors of differentiation
- Exhibits113: Overview on factors of disruption
- Exhibits114: Impact of key risks on business
- Exhibits115: Companies covered
- Exhibits116: Matrix on companies position and classification
- Exhibits117: Alphabet Inc. - Overview
- Exhibits118: Alphabet Inc. - Business segments
- Exhibits119: Alphabet Inc. - Key offerings
- Exhibits120: Alphabet Inc. - Segment focus
- Exhibits121: Amazon.com Inc. - Overview
- Exhibits122: Amazon.com Inc. - Business segments
- Exhibits123: Amazon.com Inc. - Key news
- Exhibits124: Amazon.com Inc. - Key offerings
- Exhibits125: Amazon.com Inc. - Segment focus
- Exhibits126: Deutsche Post AG - Overview
- Exhibits127: Deutsche Post AG - Business segments
- Exhibits128: Deutsche Post AG - Key news
- Exhibits129: Deutsche Post AG - Key offerings
- Exhibits130: Deutsche Post AG - Segment focus
- Exhibits131: Drone Delivery Canada Corp. - Overview
- Exhibits132: Drone Delivery Canada Corp. - Product / Service
- Exhibits133: Drone Delivery Canada Corp. - Key offerings
- Exhibits134: Drone Scan - Overview
- Exhibits135: Drone Scan - Product / Service
- Exhibits136: Drone Scan - Key offerings
- Exhibits137: Flytrex Inc. - Overview
- Exhibits138: Flytrex Inc. - Product / Service
- Exhibits139: Flytrex Inc. - Key offerings
- Exhibits140: HARDIS Groupe - Overview
- Exhibits141: HARDIS Groupe - Product / Service
- Exhibits142: HARDIS Groupe - Key offerings
- Exhibits143: Infinium Robotics - Overview
- Exhibits144: Infinium Robotics - Product / Service
- Exhibits145: Infinium Robotics - Key offerings
- Exhibits146: Matternet - Overview
- Exhibits147: Matternet - Product / Service
- Exhibits148: Matternet - Key offerings
- Exhibits149: Skydrop LLC - Overview
- Exhibits150: Skydrop LLC - Product / Service
- Exhibits151: Skydrop LLC - Key offerings
- Exhibits152: United Parcel Service Inc. - Overview
- Exhibits153: United Parcel Service Inc. - Business segments
- Exhibits154: United Parcel Service Inc. - Key news
- Exhibits155: United Parcel Service Inc. - Key offerings
- Exhibits156: United Parcel Service Inc. - Segment focus
- Exhibits157: Volocopter GmbH - Overview
- Exhibits158: Volocopter GmbH - Product / Service
- Exhibits159: Volocopter GmbH - Key offerings
- Exhibits160: Wingcopter GmbH - Overview
- Exhibits161: Wingcopter GmbH - Product / Service
- Exhibits162: Wingcopter GmbH - Key offerings
- Exhibits163: WORKHORSE GROUP INC. - Overview
- Exhibits164: WORKHORSE GROUP INC. - Product / Service
- Exhibits165: WORKHORSE GROUP INC. - Key offerings
- Exhibits166: Zipline International Inc. - Overview
- Exhibits167: Zipline International Inc. - Product / Service
- Exhibits168: Zipline International Inc. - Key offerings
- Exhibits169: Inclusions checklist
- Exhibits170: Exclusions checklist
- Exhibits171: Currency conversion rates for US$
- Exhibits172: Research methodology
- Exhibits173: Information sources
- Exhibits174: Data validation
- Exhibits175: Validation techniques employed for market sizing
- Exhibits176: Data synthesis
- Exhibits177: 360 degree market analysis
- Exhibits178: List of abbreviations
The drone logistics and transportation market is forecasted to grow by USD 29009.9 mn during 2023-2028, accelerating at a CAGR of 27.77% during the forecast period. The report on the drone logistics and transportation market provides a holistic analysis, market size and forecast, trends, growth drivers, and challenges, as well as vendor analysis covering around 25 vendors.
The report offers an up-to-date analysis regarding the current market scenario, the latest trends and drivers, and the overall market environment. The market is driven by rising application of drones, increased use of drones by e-commerce companies, and use of advanced technologies to improve efficiency of drone transportation and logistics.
Technavio's drone logistics and transportation market is segmented as below:
| Market Scope | |
|---|---|
| Base Year | 2024 |
| End Year | 2028 |
| Series Year | 2024-2028 |
| Growth Momentum | Accelerate |
| YOY 2024 | 22.76% |
| CAGR | 27.77% |
| Incremental Value | $29009.9mn |
BySolution
- System
- Software
- Infrastructure
ByApplication
- Transportation
- Warehousing
ByGeography
- North America
- Europe
- APAC
- South America
- Middle East and Africa
This study identifies the growing number of acquisitions and partnerships as one of the prime reasons driving the drone logistics and transportation market growth during the next few years. Also, new developments and launches of commercial drones and use of blockchain technology in drone transportation and logistics will lead to sizable demand in the market.
The report on the drone logistics and transportation market covers the following areas:
- Drone logistics and transportation market sizing
- Drone logistics and transportation market forecast
- Drone logistics and transportation market industry analysis
The robust vendor analysis is designed to help clients improve their market position, and in line with this, this report provides a detailed analysis of several leading drone logistics and transportation market vendors that include Airbus SE, Alphabet Inc., Amazon.com Inc., Avy B.V., Deutsche Post AG, Dronamics, Drone Delivery Canada Corp., Drone Scan, FedEx Corp., Flytrex Inc., HARDIS Groupe, Infinium Robotics, Matternet, Skydrop LLC, SZ DJI Technology Co. Ltd., United Parcel Service Inc., Volocopter GmbH, Wingcopter GmbH, WORKHORSE GROUP INC., and Zipline International Inc.. Also, the drone logistics and transportation market analysis report includes information on upcoming trends and challenges that will influence market growth. This is to help companies strategize and leverage all forthcoming growth opportunities.
The study was conducted using an objective combination of primary and secondary information including inputs from key participants in the industry. The report contains a comprehensive market and vendor landscape in addition to an analysis of the key vendors.
The publisher presents a detailed picture of the market by the way of study, synthesis, and summation of data from multiple sources by an analysis of key parameters such as profit, pricing, competition, and promotions. It presents various market facets by identifying the key industry influencers. The data presented is comprehensive, reliable, and a result of extensive research - both primary and secondary. The market research reports provide a complete competitive landscape and an in-depth vendor selection methodology and analysis using qualitative and quantitative research to forecast the accurate market growth.
Table of Contents
1 Executive Summary
- 1.1 Market overview
- Executive Summary - Chart on Market Overview
- Executive Summary - Data Table on Market Overview
- Executive Summary - Chart on Global Market Characteristics
- Executive Summary - Chart on Market By Geographical Landscape
- Executive Summary - Chart on Market Segmentation by Solution
- Executive Summary - Chart on Market Segmentation by Application
- Executive Summary - Chart on Incremental Growth
- Executive Summary - Data Table on Incremental Growth
- Executive Summary - Chart on Company Market Positioning
2 Market Landscape
- 2.1 Market ecosystem
- Parent Market
- Data Table on - Parent Market
- 2.2 Market characteristics
- Market characteristics analysis
- 2.3 Value chain analysis
- Value Chain Analysis
3 Market Sizing
- 3.1 Market definition
- Offerings of companies included in the market definition
- 3.2 Market segment analysis
- Market segments
- 3.3 Market size 2023
- 3.4 Market outlook: Forecast for 2023-2028
- Chart on Global - Market size and forecast 2023-2028 ($ million)
- Data Table on Global - Market size and forecast 2023-2028 ($ million)
- Chart on Global Market: Year-over-year growth 2023-2028 (%)
- Data Table on Global Market: Year-over-year growth 2023-2028 (%)
4 Historic Market Size
- 4.1 Global Drone Logistics And Transportation Market 2018 - 2022
- Historic Market Size - Data Table on Global Drone Logistics And Transportation Market 2018 - 2022 ($ million)
- 4.2 Solution segment analysis 2018 - 2022
- Historic Market Size - Solution Segment 2018 - 2022 ($ million)
- 4.3 Application segment analysis 2018 - 2022
- Historic Market Size - Application Segment 2018 - 2022 ($ million)
- 4.4 Geography segment analysis 2018 - 2022
- Historic Market Size - Geography Segment 2018 - 2022 ($ million)
- 4.5 Country segment analysis 2018 - 2022
- Historic Market Size - Country Segment 2018 - 2022 ($ million)
5 Five Forces Analysis
- 5.1 Five forces summary
- Five forces analysis - Comparison between 2023 and 2028
- 5.2 Bargaining power of buyers
- Bargaining power of buyers - Impact of key factors 2023 and 2028
- 5.3 Bargaining power of suppliers
- Bargaining power of suppliers - Impact of key factors in 2023 and 2028
- 5.4 Threat of new entrants
- Threat of new entrants - Impact of key factors in 2023 and 2028
- 5.5 Threat of substitutes
- Threat of substitutes - Impact of key factors in 2023 and 2028
- 5.6 Threat of rivalry
- Threat of rivalry - Impact of key factors in 2023 and 2028
- 5.7 Market condition
- Chart on Market condition - Five forces 2023 and 2028
6 Market Segmentation by Solution
- 6.1 Market segments
- Chart on Solution - Market share 2023-2028 (%)
- Data Table on Solution - Market share 2023-2028 (%)
- 6.2 Comparison by Solution
- Chart on Comparison by Solution
- Data Table on Comparison by Solution
- 6.3 System - Market size and forecast 2023-2028
- Chart on System - Market size and forecast 2023-2028 ($ million)
- Data Table on System - Market size and forecast 2023-2028 ($ million)
- Chart on System - Year-over-year growth 2023-2028 (%)
- Data Table on System - Year-over-year growth 2023-2028 (%)
- 6.4 Software - Market size and forecast 2023-2028
- Chart on Software - Market size and forecast 2023-2028 ($ million)
- Data Table on Software - Market size and forecast 2023-2028 ($ million)
- Chart on Software - Year-over-year growth 2023-2028 (%)
- Data Table on Software - Year-over-year growth 2023-2028 (%)
- 6.5 Infrastructure - Market size and forecast 2023-2028
- Chart on Infrastructure - Market size and forecast 2023-2028 ($ million)
- Data Table on Infrastructure - Market size and forecast 2023-2028 ($ million)
- Chart on Infrastructure - Year-over-year growth 2023-2028 (%)
- Data Table on Infrastructure - Year-over-year growth 2023-2028 (%)
- 6.6 Market opportunity by Solution
- Market opportunity by Solution ($ million)
- Data Table on Market opportunity by Solution ($ million)
7 Market Segmentation by Application
- 7.1 Market segments
- Chart on Application - Market share 2023-2028 (%)
- Data Table on Application - Market share 2023-2028 (%)
- 7.2 Comparison by Application
- Chart on Comparison by Application
- Data Table on Comparison by Application
- 7.3 Transportation - Market size and forecast 2023-2028
- Chart on Transportation - Market size and forecast 2023-2028 ($ million)
- Data Table on Transportation - Market size and forecast 2023-2028 ($ million)
- Chart on Transportation - Year-over-year growth 2023-2028 (%)
- Data Table on Transportation - Year-over-year growth 2023-2028 (%)
- 7.4 Warehousing - Market size and forecast 2023-2028
- Chart on Warehousing - Market size and forecast 2023-2028 ($ million)
- Data Table on Warehousing - Market size and forecast 2023-2028 ($ million)
- Chart on Warehousing - Year-over-year growth 2023-2028 (%)
- Data Table on Warehousing - Year-over-year growth 2023-2028 (%)
- 7.5 Market opportunity by Application
- Market opportunity by Application ($ million)
- Data Table on Market opportunity by Application ($ million)
8 Customer Landscape
- 8.1 Customer landscape overview
- Analysis of price sensitivity, lifecycle, customer purchase basket, adoption rates, and purchase criteria
9 Geographic Landscape
- 9.1 Geographic segmentation
- Chart on Market share By Geographical Landscape 2023-2028 (%)
- Data Table on Market share By Geographical Landscape 2023-2028 (%)
- 9.2 Geographic comparison
- Chart on Geographic comparison
- Data Table on Geographic comparison
- 9.3 North America - Market size and forecast 2023-2028
- Chart on North America - Market size and forecast 2023-2028 ($ million)
- Data Table on North America - Market size and forecast 2023-2028 ($ million)
- Chart on North America - Year-over-year growth 2023-2028 (%)
- Data Table on North America - Year-over-year growth 2023-2028 (%)
- 9.4 Europe - Market size and forecast 2023-2028
- Chart on Europe - Market size and forecast 2023-2028 ($ million)
- Data Table on Europe - Market size and forecast 2023-2028 ($ million)
- Chart on Europe - Year-over-year growth 2023-2028 (%)
- Data Table on Europe - Year-over-year growth 2023-2028 (%)
- 9.5 APAC - Market size and forecast 2023-2028
- Chart on APAC - Market size and forecast 2023-2028 ($ million)
- Data Table on APAC - Market size and forecast 2023-2028 ($ million)
- Chart on APAC - Year-over-year growth 2023-2028 (%)
- Data Table on APAC - Year-over-year growth 2023-2028 (%)
- 9.6 South America - Market size and forecast 2023-2028
- Chart on South America - Market size and forecast 2023-2028 ($ million)
- Data Table on South America - Market size and forecast 2023-2028 ($ million)
- Chart on South America - Year-over-year growth 2023-2028 (%)
- Data Table on South America - Year-over-year growth 2023-2028 (%)
- 9.7 Middle East and Africa - Market size and forecast 2023-2028
- Chart on Middle East and Africa - Market size and forecast 2023-2028 ($ million)
- Data Table on Middle East and Africa - Market size and forecast 2023-2028 ($ million)
- Chart on Middle East and Africa - Year-over-year growth 2023-2028 (%)
- Data Table on Middle East and Africa - Year-over-year growth 2023-2028 (%)
- 9.8 US - Market size and forecast 2023-2028
- Chart on US - Market size and forecast 2023-2028 ($ million)
- Data Table on US - Market size and forecast 2023-2028 ($ million)
- Chart on US - Year-over-year growth 2023-2028 (%)
- Data Table on US - Year-over-year growth 2023-2028 (%)
- 9.9 Germany - Market size and forecast 2023-2028
- Chart on Germany - Market size and forecast 2023-2028 ($ million)
- Data Table on Germany - Market size and forecast 2023-2028 ($ million)
- Chart on Germany - Year-over-year growth 2023-2028 (%)
- Data Table on Germany - Year-over-year growth 2023-2028 (%)
- 9.10 China - Market size and forecast 2023-2028
- Chart on China - Market size and forecast 2023-2028 ($ million)
- Data Table on China - Market size and forecast 2023-2028 ($ million)
- Chart on China - Year-over-year growth 2023-2028 (%)
- Data Table on China - Year-over-year growth 2023-2028 (%)
- 9.11 UK - Market size and forecast 2023-2028
- Chart on UK - Market size and forecast 2023-2028 ($ million)
- Data Table on UK - Market size and forecast 2023-2028 ($ million)
- Chart on UK - Year-over-year growth 2023-2028 (%)
- Data Table on UK - Year-over-year growth 2023-2028 (%)
- 9.12 Japan - Market size and forecast 2023-2028
- Chart on Japan - Market size and forecast 2023-2028 ($ million)
- Data Table on Japan - Market size and forecast 2023-2028 ($ million)
- Chart on Japan - Year-over-year growth 2023-2028 (%)
- Data Table on Japan - Year-over-year growth 2023-2028 (%)
- 9.13 Market opportunity By Geographical Landscape
- Market opportunity By Geographical Landscape ($ million)
- Data Tables on Market opportunity By Geographical Landscape ($ million)
10 Drivers, Challenges, and Opportunity/Restraints
- 10.1 Market drivers
- 10.2 Market challenges
- 10.3 Impact of drivers and challenges
- Impact of drivers and challenges in 2023 and 2028
- 10.4 Market opportunities/restraints
11 Competitive Landscape
- 11.1 Overview
- 11.2 Competitive Landscape
- Overview on criticality of inputs and factors of differentiation
- 11.3 Landscape disruption
- Overview on factors of disruption
- 11.4 Industry risks
- Impact of key risks on business
12 Competitive Analysis
- 12.1 Companies profiled
- Companies covered
- 12.2 Market positioning of companies
- Matrix on companies position and classification
- 12.3 Alphabet Inc.
- Alphabet Inc. - Overview
- Alphabet Inc. - Business segments
- Alphabet Inc. - Key offerings
- Alphabet Inc. - Segment focus
- 12.4 Amazon.com Inc.
- Amazon.com Inc. - Overview
- Amazon.com Inc. - Business segments
- Amazon.com Inc. - Key news
- Amazon.com Inc. - Key offerings
- Amazon.com Inc. - Segment focus
- 12.5 Deutsche Post AG
- Deutsche Post AG - Overview
- Deutsche Post AG - Business segments
- Deutsche Post AG - Key news
- Deutsche Post AG - Key offerings
- Deutsche Post AG - Segment focus
- 12.6 Drone Delivery Canada Corp.
- Drone Delivery Canada Corp. - Overview
- Drone Delivery Canada Corp. - Product / Service
- Drone Delivery Canada Corp. - Key offerings
- 12.7 Drone Scan
- Drone Scan - Overview
- Drone Scan - Product / Service
- Drone Scan - Key offerings
- 12.8 Flytrex Inc.
- Flytrex Inc. - Overview
- Flytrex Inc. - Product / Service
- Flytrex Inc. - Key offerings
- 12.9 HARDIS Groupe
- HARDIS Groupe - Overview
- HARDIS Groupe - Product / Service
- HARDIS Groupe - Key offerings
- 12.10 Infinium Robotics
- Infinium Robotics - Overview
- Infinium Robotics - Product / Service
- Infinium Robotics - Key offerings
- 12.11 Matternet
- Matternet - Overview
- Matternet - Product / Service
- Matternet - Key offerings
- 12.12 Skydrop LLC
- Skydrop LLC - Overview
- Skydrop LLC - Product / Service
- Skydrop LLC - Key offerings
- 12.13 United Parcel Service Inc.
- United Parcel Service Inc. - Overview
- United Parcel Service Inc. - Business segments
- United Parcel Service Inc. - Key news
- United Parcel Service Inc. - Key offerings
- United Parcel Service Inc. - Segment focus
- 12.14 Volocopter GmbH
- Volocopter GmbH - Overview
- Volocopter GmbH - Product / Service
- Volocopter GmbH - Key offerings
- 12.15 Wingcopter GmbH
- Wingcopter GmbH - Overview
- Wingcopter GmbH - Product / Service
- Wingcopter GmbH - Key offerings
- 12.16 WORKHORSE GROUP INC.
- WORKHORSE GROUP INC. - Overview
- WORKHORSE GROUP INC. - Product / Service
- WORKHORSE GROUP INC. - Key offerings
- 12.17 Zipline International Inc.
- Zipline International Inc. - Overview
- Zipline International Inc. - Product / Service
- Zipline International Inc. - Key offerings
13 Appendix
- 13.1 Scope of the report
- 13.2 Inclusions and exclusions checklist
- Inclusions checklist
- Exclusions checklist
- 13.3 Currency conversion rates for US$
- Currency conversion rates for US$
- 13.4 Research methodology
- Research methodology
- 13.5 Data procurement
- Information sources
- 13.6 Data validation
- Data validation
- 13.7 Validation techniques employed for market sizing
- Validation techniques employed for market sizing
- 13.8 Data synthesis
- Data synthesis
- 13.9 360 degree market analysis
- 360 degree market analysis
- 13.10 List of abbreviations
- List of abbreviations
