|
|
市場調査レポート
商品コード
1657133
暗号通貨マイニングハードウェアの世界市場 2025~2029年Global Cryptocurrency Mining Hardware Market 2025-2029 |
||||||

|
|||||||
カスタマイズ可能
|
|||||||


| 暗号通貨マイニングハードウェアの世界市場 2025~2029年 |
|
出版日: 2025年02月12日
発行: TechNavio
ページ情報: 英文 214 Pages
納期: 即納可能
|

全表示
- 概要
- 目次
暗号通貨マイニングハードウェア市場は2024~2029年に197億6,990万米ドル、予測期間中のCAGRは14.2%で成長すると予測されます。
当レポートでは、暗号通貨マイニングハードウェア市場の全体的な分析、市場規模・予測、動向、成長促進要因、課題、約25のベンダーを網羅したベンダー分析などを掲載しています。
現在の市場シナリオ、最新動向と促進要因、市場環境全体に関する最新分析を提供しています。暗号通貨マイニングベンチャーの収益性、暗号通貨専用ハードウェアの需要拡大、マイニングプールの人気上昇などが市場を牽引しています。
| 市場範囲 | |
|---|---|
| 基準年 | 2025年 |
| 終了年 | 2029年 |
| 予測期間 | 2025~2029年 |
| 成長モメンタム | 加速 |
| 前年比[2025年] | 12.2% |
| CAGR | 14.2% |
| 増分額 | 197億6,990万米ドル |
本調査は、産業の主要参加者からのインプットを含め、一次情報と二次情報を客観的に組み合わせて実施しました。レポートには、主要企業の分析に加え、包括的な市場規模データ、地域分析によるセグメント、ベンダー情勢が含まれています。レポートには過去データと予測データがあります。
本調査では、小売業者による暗号通貨の受け入れが、今後数年間の暗号通貨マイニングハードウェア市場の成長を促進する主要な理由の1つであると指摘しています。また、大手半導体企業によるマイニングに特化したハードウェアへの投資や、デジタル通貨への大衆的な傾倒は、市場の大きな需要につながると考えられます。
目次
第1章 エグゼクティブサマリー
- 市場概要
第2章 Technavio分析
- 価格・ライフサイクル・顧客購入バスケット・採用率・購入基準の分析
- インプットの重要性と差別化の要因
- 混乱の要因
- 促進要因と課題の影響
第3章 市場情勢
- 市場エコシステム
- 市場の特徴
- バリューチェーン分析
第4章 市場規模
- 市場の定義
- 市場セグメント分析
- 市場規模 2024年
- 市場の展望 2024~2029年
第5章 市場規模実績
- 暗号通貨マイニングハードウェアの世界市場 2019~2023年
- 製品別セグメント分析 2019~2023年
- 用途別セグメント分析 2019~2023年
- エンドユーザー別セグメント分析 2019~2023年
- 地域別セグメント分析 2019~2023年
- 国別セグメント分析 2019~2023年
第6章 定性分析
- AIの影響-暗号通貨マイニングハードウェアの世界市場
第7章 ファイブフォース分析
- ファイブフォースの要約
- 買い手の交渉力
- 供給企業の交渉力
- 新規参入業者の脅威
- 代替品の脅威
- 競争の脅威
- 市況
第8章 市場セグメンテーション:製品別
- 市場セグメント
- 比較:製品別
- ASIC:市場規模と予測 2024~2029年
- GPU:市場規模と予測 2024~2029年
- その他:市場規模と予測 2024~2029年
- 市場機会:製品別
第9章 市場セグメンテーション:用途別
- 市場セグメント
- 比較:用途別
- ビットコインマイニング:市場規模と予測 2024~2029年
- イーサリアムマイニング:市場規模と予測 2024~2029年
- その他:市場規模と予測 2024~2029年
- 市場機会:用途別
第10章 市場セグメンテーション:エンドユーザー別
- 市場セグメント
- 比較:エンドユーザー別
- 個人:市場規模と予測 2024~2029年
- 企業:市場規模と予測 2024~2029年
- 市場機会:エンドユーザー別
第11章 顧客情勢
- 顧客情勢概要
第12章 地域別情勢
- 地域別セグメンテーション
- 比較:地域別
- 北米:市場規模と予測 2024~2029年
- 欧州:市場規模と予測 2024~2029年
- アジア太平洋:市場規模と予測 2024~2029年
- 南米:市場規模と予測 2024~2029年
- 中東・アフリカ:市場規模と予測 2024~2029年
- 米国:市場規模と予測 2024~2029年
- 中国:市場規模と予測 2024~2029年
- ドイツ:市場規模と予測 2024~2029年
- 英国:市場規模と予測 2024~2029年
- カナダ:市場規模と予測 2024~2029年
- 日本:市場規模と予測 2024~2029年
- ブラジル:市場規模と予測 2024~2029年
- インド:市場規模と予測 2024~2029年
- フランス:市場規模と予測 2024~2029年
- オランダ:市場規模と予測 2024~2029年
- 地域情勢による市場機会
第13章 促進要因・課題・機会・抑制要因
- 市場促進要因
- 市場課題
- 促進要因と課題の影響
- 市場機会・抑制要因
第14章 競合情勢
- 概要
- 競合情勢
- 混乱の状況
- 産業のリスク
第15章 競合分析
- 企業プロファイル
- 企業ランキング指数
- 企業の市場ポジショニング
- BIT Digital Inc.
- BitMain Group
- Canaan Inc.
- Ebang International Holdings Inc.
- Elite Mining Inc.
- ePIC Blockchain Technologies Inc.
- Helium Systems Inc.
- HIVE Blockchain Technologies Ltd.
- Hut 8 Corp.
- INNOSILICON Technology Ltd.
- Intelion Mine LLC
- Marathon Digital Holdings Inc.
- RIoT Blockchain Inc.
- Shenzhen Jingang Zhuoyue Co. Ltd
- Spacemesh
第16章 付録
The cryptocurrency mining hardware market is forecasted to grow by USD 19769.9 million during 2024-2029, accelerating at a CAGR of 14.2% during the forecast period. The report on the cryptocurrency mining hardware market provides a holistic analysis, market size and forecast, trends, growth drivers, and challenges, as well as vendor analysis covering around 25 vendors.
The report offers an up-to-date analysis regarding the current market scenario, the latest trends and drivers, and the overall market environment. The market is driven by profitability of cryptocurrency mining ventures, growing demand for cryptocurrency-specific hardware, and rising popularity of mining pools.
| Market Scope | |
|---|---|
| Base Year | 2025 |
| End Year | 2029 |
| Series Year | 2025-2029 |
| Growth Momentum | Accelerate |
| YOY 2025 | 12.2% |
| CAGR | 14.2% |
| Incremental Value | $19769.9 mn |
The study was conducted using an objective combination of primary and secondary information including inputs from key participants in the industry. The report contains a comprehensive market size data, segment with regional analysis and vendor landscape in addition to an analysis of the key companies. Reports have historic and forecast data.
Technavio's cryptocurrency mining hardware market is segmented as below:
By Product
- ASIC
- GPU
- Others
By Application
- Bitcoin mining
- Ethereum mining
- Others
By End-user
- Personal
- Enterprise
By Geographical Landscape
- North America
- Europe
- APAC
- South America
- Middle East and Africa
This study identifies the acceptance of cryptocurrency by retailers as one of the prime reasons driving the cryptocurrency mining hardware market growth during the next few years. Also, investments by large semiconductor companies in mining-specific hardware and popular inclination toward digital currency will lead to sizable demand in the market.
The report on the cryptocurrency mining hardware market covers the following areas:
- Cryptocurrency Mining Hardware Market sizing
- Cryptocurrency Mining Hardware Market forecast
- Cryptocurrency Mining Hardware Market industry analysis
The robust vendor analysis is designed to help clients improve their market position, and in line with this, this report provides a detailed analysis of several leading cryptocurrency mining hardware market vendors that include Argo Blockchain PLC, BIT Digital Inc., Bitfarms Ltd., BitMain Group, Canaan Inc., Ebang International Holdings Inc., Elite Mining Inc., ePIC Blockchain Technologies Inc., Genesis Mining Ltd., GMO Internet Group Inc, Helium Systems Inc., HIVE Blockchain Technologies Ltd., Hut 8 Corp., INNOSILICON Technology Ltd., Intelion Mine LLC, Marathon Digital Holdings Inc., NiceHash Ltd., Riot Blockchain Inc., Shenzhen Jingang Zhuoyue Co. Ltd, Shenzhen MicroBT Electronics Technology Co. Ltd, and Spacemesh. Also, the cryptocurrency mining hardware market analysis report includes information on upcoming trends and challenges that will influence market growth. This is to help companies strategize and leverage all forthcoming growth opportunities.
The publisher presents a detailed picture of the market by the way of study, synthesis, and summation of data from multiple sources by an analysis of key parameters such as profit, pricing, competition, and promotions. It presents various market facets by identifying the key industry influencers. The data presented is comprehensive, reliable, and a result of extensive primary and secondary research. The market research reports provide a complete competitive landscape and an in-depth vendor selection methodology and analysis using qualitative and quantitative research to forecast accurate market growth.
Table of Contents
1 Executive Summary
- 1.1 Market overview
- Executive Summary - Chart on Market Overview
- Executive Summary - Data Table on Market Overview
- Executive Summary - Chart on Global Market Characteristics
- Executive Summary - Chart on Market By Geographical Landscape
- Executive Summary - Chart on Market Segmentation by Product
- Executive Summary - Chart on Market Segmentation by Application
- Executive Summary - Chart on Market Segmentation by End-user
- Executive Summary - Chart on Incremental Growth
- Executive Summary - Data Table on Incremental Growth
- Executive Summary - Chart on Company Market Positioning
2 Technavio Analysis
- 2.1 Analysis of price sensitivity, lifecycle, customer purchase basket, adoption rates, and purchase criteria
- Analysis of price sensitivity, lifecycle, customer purchase basket, adoption rates, and purchase criteria
- 2.2 Criticality of inputs and Factors of differentiation
- Overview on criticality of inputs and factors of differentiation
- 2.3 Factors of disruption
- Overview on factors of disruption
- 2.4 Impact of drivers and challenges
- Impact of drivers and challenges in 2024 and 2029
3 Market Landscape
- 3.1 Market ecosystem
- Parent Market
- Data Table on - Parent Market
- 3.2 Market characteristics
- Market characteristics analysis
- 3.3 Value chain analysis
- Value chain analysis
4 Market Sizing
- 4.1 Market definition
- Offerings of companies included in the market definition
- 4.2 Market segment analysis
- Market segments
- 4.3 Market size 2024
- 4.4 Market outlook: Forecast for 2024-2029
- Chart on Global - Market size and forecast 2024-2029 ($ million)
- Data Table on Global - Market size and forecast 2024-2029 ($ million)
- Chart on Global Market: Year-over-year growth 2024-2029 (%)
- Data Table on Global Market: Year-over-year growth 2024-2029 (%)
5 Historic Market Size
- 5.1 Global Cryptocurrency Mining Hardware Market 2019 - 2023
- Historic Market Size - Data Table on Global Cryptocurrency Mining Hardware Market 2019 - 2023 ($ million)
- 5.2 Product segment analysis 2019 - 2023
- Historic Market Size - Product Segment 2019 - 2023 ($ million)
- 5.3 Application segment analysis 2019 - 2023
- Historic Market Size - Application Segment 2019 - 2023 ($ million)
- 5.4 End-user segment analysis 2019 - 2023
- Historic Market Size - End-user Segment 2019 - 2023 ($ million)
- 5.5 Geography segment analysis 2019 - 2023
- Historic Market Size - Geography Segment 2019 - 2023 ($ million)
- 5.6 Country segment analysis 2019 - 2023
- Historic Market Size - Country Segment 2019 - 2023 ($ million)
6 Qualitative Analysis
- 6.1 Impact of AI on global cryptocurrency mining hardware market
7 Five Forces Analysis
- 7.1 Five forces summary
- Five forces analysis - Comparison between 2024 and 2029
- 7.2 Bargaining power of buyers
- Bargaining power of buyers - Impact of key factors 2024 and 2029
- 7.3 Bargaining power of suppliers
- Bargaining power of suppliers - Impact of key factors in 2024 and 2029
- 7.4 Threat of new entrants
- Threat of new entrants - Impact of key factors in 2024 and 2029
- 7.5 Threat of substitutes
- Threat of substitutes - Impact of key factors in 2024 and 2029
- 7.6 Threat of rivalry
- Threat of rivalry - Impact of key factors in 2024 and 2029
- 7.7 Market condition
- Chart on Market condition - Five forces 2024 and 2029
8 Market Segmentation by Product
- 8.1 Market segments
- Chart on Product - Market share 2024-2029 (%)
- Data Table on Product - Market share 2024-2029 (%)
- 8.2 Comparison by Product
- Chart on Comparison by Product
- Data Table on Comparison by Product
- 8.3 ASIC - Market size and forecast 2024-2029
- Chart on ASIC - Market size and forecast 2024-2029 ($ million)
- Data Table on ASIC - Market size and forecast 2024-2029 ($ million)
- Chart on ASIC - Year-over-year growth 2024-2029 (%)
- Data Table on ASIC - Year-over-year growth 2024-2029 (%)
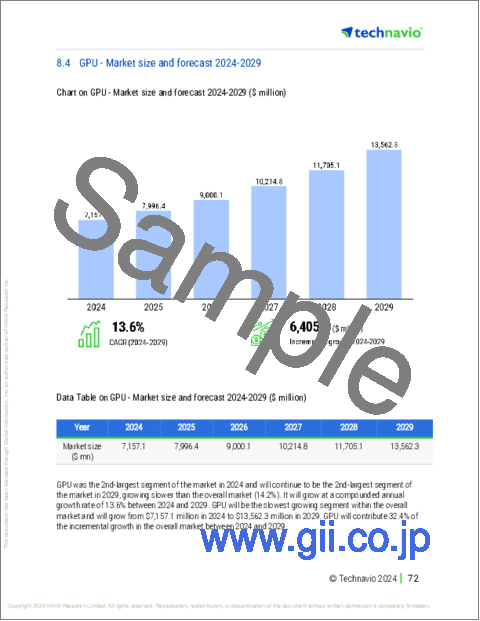
- 8.4 GPU - Market size and forecast 2024-2029
- Chart on GPU - Market size and forecast 2024-2029 ($ million)
- Data Table on GPU - Market size and forecast 2024-2029 ($ million)
- Chart on GPU - Year-over-year growth 2024-2029 (%)
- Data Table on GPU - Year-over-year growth 2024-2029 (%)
- 8.5 Others - Market size and forecast 2024-2029
- Chart on Others - Market size and forecast 2024-2029 ($ million)
- Data Table on Others - Market size and forecast 2024-2029 ($ million)
- Chart on Others - Year-over-year growth 2024-2029 (%)
- Data Table on Others - Year-over-year growth 2024-2029 (%)
- 8.6 Market opportunity by Product
- Market opportunity by Product ($ million)
- Data Table on Market opportunity by Product ($ million)
9 Market Segmentation by Application
- 9.1 Market segments
- Chart on Application - Market share 2024-2029 (%)
- Data Table on Application - Market share 2024-2029 (%)
- 9.2 Comparison by Application
- Chart on Comparison by Application
- Data Table on Comparison by Application
- 9.3 Bitcoin mining - Market size and forecast 2024-2029
- Chart on Bitcoin mining - Market size and forecast 2024-2029 ($ million)
- Data Table on Bitcoin mining - Market size and forecast 2024-2029 ($ million)
- Chart on Bitcoin mining - Year-over-year growth 2024-2029 (%)
- Data Table on Bitcoin mining - Year-over-year growth 2024-2029 (%)
- 9.4 Ethereum mining - Market size and forecast 2024-2029
- Chart on Ethereum mining - Market size and forecast 2024-2029 ($ million)
- Data Table on Ethereum mining - Market size and forecast 2024-2029 ($ million)
- Chart on Ethereum mining - Year-over-year growth 2024-2029 (%)
- Data Table on Ethereum mining - Year-over-year growth 2024-2029 (%)
- 9.5 Others - Market size and forecast 2024-2029
- Chart on Others - Market size and forecast 2024-2029 ($ million)
- Data Table on Others - Market size and forecast 2024-2029 ($ million)
- Chart on Others - Year-over-year growth 2024-2029 (%)
- Data Table on Others - Year-over-year growth 2024-2029 (%)
- 9.6 Market opportunity by Application
- Market opportunity by Application ($ million)
- Data Table on Market opportunity by Application ($ million)
10 Market Segmentation by End-user
- 10.1 Market segments
- Chart on End-user - Market share 2024-2029 (%)
- Data Table on End-user - Market share 2024-2029 (%)
- 10.2 Comparison by End-user
- Chart on Comparison by End-user
- Data Table on Comparison by End-user
- 10.3 Personal - Market size and forecast 2024-2029
- Chart on Personal - Market size and forecast 2024-2029 ($ million)
- Data Table on Personal - Market size and forecast 2024-2029 ($ million)
- Chart on Personal - Year-over-year growth 2024-2029 (%)
- Data Table on Personal - Year-over-year growth 2024-2029 (%)
- 10.4 Enterprise - Market size and forecast 2024-2029
- Chart on Enterprise - Market size and forecast 2024-2029 ($ million)
- Data Table on Enterprise - Market size and forecast 2024-2029 ($ million)
- Chart on Enterprise - Year-over-year growth 2024-2029 (%)
- Data Table on Enterprise - Year-over-year growth 2024-2029 (%)
- 10.5 Market opportunity by End-user
- Market opportunity by End-user ($ million)
- Data Table on Market opportunity by End-user ($ million)
11 Customer Landscape
- 11.1 Customer landscape overview
- Analysis of price sensitivity, lifecycle, customer purchase basket, adoption rates, and purchase criteria
12 Geographic Landscape
- 12.1 Geographic segmentation
- Chart on Market share By Geographical Landscape 2024-2029 (%)
- Data Table on Market share By Geographical Landscape 2024-2029 (%)
- 12.2 Geographic comparison
- Chart on Geographic comparison
- Data Table on Geographic comparison
- 12.3 North America - Market size and forecast 2024-2029
- Chart on North America - Market size and forecast 2024-2029 ($ million)
- Data Table on North America - Market size and forecast 2024-2029 ($ million)
- Chart on North America - Year-over-year growth 2024-2029 (%)
- Data Table on North America - Year-over-year growth 2024-2029 (%)
- 12.4 Europe - Market size and forecast 2024-2029
- Chart on Europe - Market size and forecast 2024-2029 ($ million)
- Data Table on Europe - Market size and forecast 2024-2029 ($ million)
- Chart on Europe - Year-over-year growth 2024-2029 (%)
- Data Table on Europe - Year-over-year growth 2024-2029 (%)
- 12.5 APAC - Market size and forecast 2024-2029
- Chart on APAC - Market size and forecast 2024-2029 ($ million)
- Data Table on APAC - Market size and forecast 2024-2029 ($ million)
- Chart on APAC - Year-over-year growth 2024-2029 (%)
- Data Table on APAC - Year-over-year growth 2024-2029 (%)
- 12.6 South America - Market size and forecast 2024-2029
- Chart on South America - Market size and forecast 2024-2029 ($ million)
- Data Table on South America - Market size and forecast 2024-2029 ($ million)
- Chart on South America - Year-over-year growth 2024-2029 (%)
- Data Table on South America - Year-over-year growth 2024-2029 (%)
- 12.7 Middle East and Africa - Market size and forecast 2024-2029
- Chart on Middle East and Africa - Market size and forecast 2024-2029 ($ million)
- Data Table on Middle East and Africa - Market size and forecast 2024-2029 ($ million)
- Chart on Middle East and Africa - Year-over-year growth 2024-2029 (%)
- Data Table on Middle East and Africa - Year-over-year growth 2024-2029 (%)
- 12.8 US - Market size and forecast 2024-2029
- Chart on US - Market size and forecast 2024-2029 ($ million)
- Data Table on US - Market size and forecast 2024-2029 ($ million)
- Chart on US - Year-over-year growth 2024-2029 (%)
- Data Table on US - Year-over-year growth 2024-2029 (%)
- 12.9 China - Market size and forecast 2024-2029
- Chart on China - Market size and forecast 2024-2029 ($ million)
- Data Table on China - Market size and forecast 2024-2029 ($ million)
- Chart on China - Year-over-year growth 2024-2029 (%)
- Data Table on China - Year-over-year growth 2024-2029 (%)
- 12.10 Germany - Market size and forecast 2024-2029
- Chart on Germany - Market size and forecast 2024-2029 ($ million)
- Data Table on Germany - Market size and forecast 2024-2029 ($ million)
- Chart on Germany - Year-over-year growth 2024-2029 (%)
- Data Table on Germany - Year-over-year growth 2024-2029 (%)
- 12.11 UK - Market size and forecast 2024-2029
- Chart on UK - Market size and forecast 2024-2029 ($ million)
- Data Table on UK - Market size and forecast 2024-2029 ($ million)
- Chart on UK - Year-over-year growth 2024-2029 (%)
- Data Table on UK - Year-over-year growth 2024-2029 (%)
- 12.12 Canada - Market size and forecast 2024-2029
- Chart on Canada - Market size and forecast 2024-2029 ($ million)
- Data Table on Canada - Market size and forecast 2024-2029 ($ million)
- Chart on Canada - Year-over-year growth 2024-2029 (%)
- Data Table on Canada - Year-over-year growth 2024-2029 (%)
- 12.13 Japan - Market size and forecast 2024-2029
- Chart on Japan - Market size and forecast 2024-2029 ($ million)
- Data Table on Japan - Market size and forecast 2024-2029 ($ million)
- Chart on Japan - Year-over-year growth 2024-2029 (%)
- Data Table on Japan - Year-over-year growth 2024-2029 (%)
- 12.14 Brazil - Market size and forecast 2024-2029
- Chart on Brazil - Market size and forecast 2024-2029 ($ million)
- Data Table on Brazil - Market size and forecast 2024-2029 ($ million)
- Chart on Brazil - Year-over-year growth 2024-2029 (%)
- Data Table on Brazil - Year-over-year growth 2024-2029 (%)
- 12.15 India - Market size and forecast 2024-2029
- Chart on India - Market size and forecast 2024-2029 ($ million)
- Data Table on India - Market size and forecast 2024-2029 ($ million)
- Chart on India - Year-over-year growth 2024-2029 (%)
- Data Table on India - Year-over-year growth 2024-2029 (%)
- 12.16 France - Market size and forecast 2024-2029
- Chart on France - Market size and forecast 2024-2029 ($ million)
- Data Table on France - Market size and forecast 2024-2029 ($ million)
- Chart on France - Year-over-year growth 2024-2029 (%)
- Data Table on France - Year-over-year growth 2024-2029 (%)
- 12.17 The Netherlands - Market size and forecast 2024-2029
- Chart on The Netherlands - Market size and forecast 2024-2029 ($ million)
- Data Table on The Netherlands - Market size and forecast 2024-2029 ($ million)
- Chart on The Netherlands - Year-over-year growth 2024-2029 (%)
- Data Table on The Netherlands - Year-over-year growth 2024-2029 (%)
- 12.18 Market opportunity By Geographical Landscape
- Market opportunity By Geographical Landscape ($ million)
- Data Tables on Market opportunity By Geographical Landscape ($ million)
13 Drivers, Challenges, and Opportunity/Restraints
- 13.1 Market drivers
- 13.2 Market challenges
- 13.3 Impact of drivers and challenges
- Impact of drivers and challenges in 2024 and 2029
- 13.4 Market opportunities/restraints
14 Competitive Landscape
- 14.1 Overview
- 14.2 Competitive Landscape
- Overview on criticality of inputs and factors of differentiation
- 14.3 Landscape disruption
- Overview on factors of disruption
- 14.4 Industry risks
- Impact of key risks on business
15 Competitive Analysis
- 15.1 Companies profiled
- Companies covered
- 15.2 Company ranking index
- Company ranking index
- 15.3 Market positioning of companies
- Matrix on companies position and classification
- 15.4 BIT Digital Inc.
- BIT Digital Inc. - Overview
- BIT Digital Inc. - Product / Service
- BIT Digital Inc. - Key news
- BIT Digital Inc. - Key offerings
- SWOT
- 15.5 BitMain Group
- BitMain Group - Overview
- BitMain Group - Product / Service
- BitMain Group - Key news
- BitMain Group - Key offerings
- SWOT
- 15.6 Canaan Inc.
- Canaan Inc. - Overview
- Canaan Inc. - Product / Service
- Canaan Inc. - Key offerings
- SWOT
- 15.7 Ebang International Holdings Inc.
- Ebang International Holdings Inc. - Overview
- Ebang International Holdings Inc. - Product / Service
- Ebang International Holdings Inc. - Key offerings
- SWOT
- 15.8 Elite Mining Inc.
- Elite Mining Inc. - Overview
- Elite Mining Inc. - Product / Service
- Elite Mining Inc. - Key offerings
- SWOT
- 15.9 ePIC Blockchain Technologies Inc.
- ePIC Blockchain Technologies Inc. - Overview
- ePIC Blockchain Technologies Inc. - Product / Service
- ePIC Blockchain Technologies Inc. - Key news
- ePIC Blockchain Technologies Inc. - Key offerings
- SWOT
- 15.10 Helium Systems Inc.
- Helium Systems Inc. - Overview
- Helium Systems Inc. - Product / Service
- Helium Systems Inc. - Key offerings
- SWOT
- 15.11 HIVE Blockchain Technologies Ltd.
- HIVE Blockchain Technologies Ltd. - Overview
- HIVE Blockchain Technologies Ltd. - Product / Service
- HIVE Blockchain Technologies Ltd. - Key news
- HIVE Blockchain Technologies Ltd. - Key offerings
- SWOT
- 15.12 Hut 8 Corp.
- Hut 8 Corp. - Overview
- Hut 8 Corp. - Product / Service
- Hut 8 Corp. - Key news
- Hut 8 Corp. - Key offerings
- SWOT
- 15.13 INNOSILICON Technology Ltd.
- INNOSILICON Technology Ltd. - Overview
- INNOSILICON Technology Ltd. - Product / Service
- INNOSILICON Technology Ltd. - Key offerings
- SWOT
- 15.14 Intelion Mine LLC
- Intelion Mine LLC - Overview
- Intelion Mine LLC - Product / Service
- Intelion Mine LLC - Key offerings
- SWOT
- 15.15 Marathon Digital Holdings Inc.
- Marathon Digital Holdings Inc. - Overview
- Marathon Digital Holdings Inc. - Product / Service
- Marathon Digital Holdings Inc. - Key news
- Marathon Digital Holdings Inc. - Key offerings
- SWOT
- 15.16 Riot Blockchain Inc.
- Riot Blockchain Inc. - Overview
- Riot Blockchain Inc. - Business segments
- Riot Blockchain Inc. - Key news
- Riot Blockchain Inc. - Key offerings
- Riot Blockchain Inc. - Segment focus
- SWOT
- 15.17 Shenzhen Jingang Zhuoyue Co. Ltd
- Shenzhen Jingang Zhuoyue Co. Ltd - Overview
- Shenzhen Jingang Zhuoyue Co. Ltd - Product / Service
- Shenzhen Jingang Zhuoyue Co. Ltd - Key offerings
- SWOT
- 15.18 Spacemesh
- Spacemesh - Overview
- Spacemesh - Product / Service
- Spacemesh - Key offerings
- SWOT
16 Appendix
- 16.1 Scope of the report
- 16.2 Inclusions and exclusions checklist
- Inclusions checklist
- Exclusions checklist
- 16.3 Currency conversion rates for US$
- Currency conversion rates for US$
- 16.4 Research methodology
- Research methodology
- 16.5 Data procurement
- Information sources
- 16.6 Data validation
- Data validation
- 16.7 Validation techniques employed for market sizing
- Validation techniques employed for market sizing
- 16.8 Data synthesis
- Data synthesis
- 16.9 360 degree market analysis
- 360 degree market analysis
- 16.10 List of abbreviations
- List of abbreviations

