|
|
市場調査レポート
商品コード
1915276
POS端末の世界市場、2026年~2030年Global Pos Terminals Market 2026-2030 |
||||||
|
|||||||
カスタマイズ可能
|
|||||||

| POS端末の世界市場、2026年~2030年 |
|
出版日: 2026年01月19日
発行: TechNavio
ページ情報: 英文 301 Pages
納期: 即納可能
|

概要
世界のPOS端末市場は、2025年から2030年にかけて647億840万米ドルの成長が見込まれており、予測期間中のCAGRは9.1%と予測されています。
本レポートでは、世界のPOS端末市場に関する包括的な分析、市場規模と予測、動向、成長要因、課題に加え、約25社のベンダー分析を提供しております。
本レポートは、現在の市場状況、最新の動向と促進要因、市場環境全般に関する最新の分析を提供します。市場は、キャッシュレス決済とデジタル取引の急速な普及、組織化された小売業の拡大とサービス業の成長、技術進歩、付加価値機能の統合によって牽引されています。
本調査は、業界の主要関係者からの情報を含む、一次情報と二次情報の客観的な組み合わせを用いて実施されました。本レポートには、主要企業の分析に加え、包括的な市場規模データ、地域別分析を伴うセグメント、ベンダー情勢が含まれています。レポートには過去データと予測データが掲載されています。
| 市場範囲 | |
|---|---|
| 基準年 | 2026年 |
| 終了年 | 2030年 |
| 予測期間 | 2026年~2030年 |
| 成長モメンタム | 加速 |
| 前年比2026年 | 8.4% |
| CAGR | 9.1% |
| 増分額 | 647億840万米ドル |
本調査では、今後数年間における世界のPOS端末市場成長を牽引する主要な要因の一つとして、モバイルおよびクラウドベースのPOSソリューションの採用拡大が挙げられます。また、POSシステムとビジネスアナリティクスやCRMツールとの統合が進み、非接触決済やオムニチャネル決済機能の拡充が進むことで、市場において相当な需要が見込まれます。
目次
第1章 エグゼクティブサマリー
第2章 Technavio分析
- 価格・ライフサイクル・顧客購入バスケット・採用率・購入基準の分析
- インプットの重要性と差別化の要因
- 混乱の要因
- 促進要因と課題の影響
第3章 市場情勢
- 市場エコシステム
- 市場の特徴
- バリューチェーン分析
第4章 市場規模
- 市場の定義
- 市場セグメント分析
- 市場規模、2025年
- 市場の見通し、2025年~2030年
第5章 市場規模実績
- 世界のPOS端末市場、2020年~2024年
- エンドユーザーセグメント分析、2020年~2024年
- 部品セグメント分析、2020年~2024年
- 製品セグメント分析、2020年~2024年
- 地域別セグメント分析、2020年~2024年
- 国別セグメント分析、2020年~2024年
第6章 定性分析
- AIの影響:世界のPOS端末市場
第7章 ファイブフォース分析
- ファイブフォースの要約
- 買い手の交渉力
- 供給企業の交渉力
- 新規参入業者の脅威
- 代替品の脅威
- 競争の脅威
- 市況
第8章 市場セグメンテーション:エンドユーザー別
- 比較:エンドユーザー別
- 小売
- ホスピタリティ
- ヘルスケア
- エンターテインメント
- その他
- 市場機会:エンドユーザー別
第9章 市場セグメンテーション:コンポーネント別
- 比較:コンポーネント別
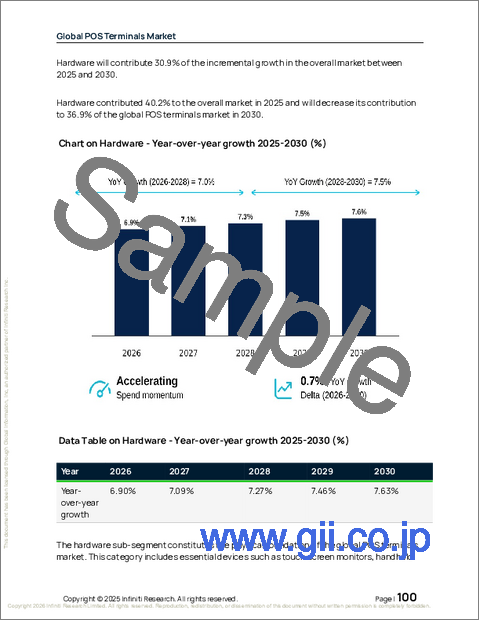
- ハードウェア
- ソフトウェア
- サービス
- 市場機会:コンポーネント別
第10章 市場セグメンテーション:製品別
- 比較:製品別
- 固定
- モバイル
- 市場機会:製品別
第11章 顧客情勢
第12章 地域別情勢
- 地域別セグメンテーション
- 地域別比較
- 北米
- 米国
- カナダ
- メキシコ
- アジア太平洋
- 中国
- 日本
- インド
- 韓国
- オーストラリア
- インドネシア
- 欧州
- 英国
- ドイツ
- フランス
- イタリア
- スペイン
- オランダ
- 中東・アフリカ
- アラブ首長国連邦
- サウジアラビア
- 南アフリカ
- イスラエル
- トルコ
- 南米
- ブラジル
- アルゼンチン
- チリ
- 市場機会:地域別
第13章 促進要因・課題・機会
- 市場促進要因
- 市場の課題
- 促進要因と課題の影響
- 市場機会
第14章 競合情勢
- 概要
- 競合情勢
- 混乱の状況
- 業界のリスク
第15章 競合分析
- 企業プロファイル
- 企業ランキング指標
- 企業の市場ポジショニング
- Block Inc.
- CASIO Computer Co. Ltd.
- Cegid Group
- Fiserv Inc.
- Ingenico Group SA
- Lightspeed Commerce Inc.
- NCR Payment Solutions LLC
- Oracle Corp.
- Panasonic Holdings Corp.
- PAX Global Technology Ltd.
- SumUp Inc.
- Toast Inc.
- Toshiba Corp.
- TouchBistro Inc.
- VeriFone Inc.
