|
|
市場調査レポート
商品コード
1684910
パスタの世界市場、2025-2029年Global Pasta Market 2025-2029 |
||||||

|
|||||||
カスタマイズ可能
|
|||||||


| パスタの世界市場、2025-2029年 |
|
出版日: 2025年03月12日
発行: TechNavio
ページ情報: 英文 250 Pages
納期: 即納可能
|

全表示
- 概要
- 図表
- 目次
パスタ市場は2024-2029年に82億3,590万米ドル、予測期間中のCAGRは3.7%で成長すると予測されています。
当レポートでは、パスタ市場の全体的な分析、市場規模・予測、動向、成長促進要因、課題、約25のベンダーを網羅したベンダー分析などを掲載しています。
現在の市場シナリオ、最新動向と促進要因、市場環境全体に関する最新分析を提供しています。市場を牽引しているのは、インスタント食品に対する需要の増加、小売の拡大、各国料理に対する需要の高まりなどです。
| 市場範囲 | |
|---|---|
| 基準年 | 2025 |
| 終了年 | 2029 |
| 予測期間 | 2025-2029 |
| 成長モメンタム | 加速 |
| 前年比2025年 | 3.5% |
| CAGR | 3.7% |
| 増分額 | 82億3,590万米ドル |
本調査は、業界の主要参加者からのインプットを含め、一次情報と二次情報を客観的に組み合わせて実施しました。レポートには、主要企業の分析に加え、包括的な市場規模データ、地域分析によるセグメント、ベンダー情勢が含まれています。レポートには過去データと予測データがあります。
本調査では、今後数年間におけるパスタ市場の成長を促進する主な理由の一つとして、地元産のフレーバーや多様性に対する需要の増加を挙げています。また、健康・ウェルネスパスタの注目度が高まり、プライベートブランドがますます注目を集めるようになり、市場で大きな需要が生まれるでしょう。
目次
第1章 エグゼクティブサマリー
- 市場概要
第2章 Technavio分析
- 価格・ライフサイクル・顧客購入バスケット・採用率・購入基準の分析
- インプットの重要性と差別化の要因
- 混乱の要因
- 促進要因と課題の影響
第3章 市場情勢
- 市場エコシステム
- 市場の特徴
- バリューチェーン分析
第4章 市場規模
- 市場の定義
- 市場セグメント分析
- 市場規模 2024
- 市場の見通し 2024-2029
第5章 市場規模実績
- パスタの世界市場 2019-2023
- 製品セグメント分析 2019-2023
- 流通チャネルセグメント分析 2019-2023
- 原材料セグメント分析 2019-2023
- タイプセグメント分析 2019-2023
- 地域別セグメント分析 2019-2023
- 国別セグメント分析 2019-2023
第6章 定性分析
- AIの影響:パスタの世界市場
第7章 ファイブフォース分析
- ファイブフォースの要約
- 買い手の交渉力
- 供給企業の交渉力
- 新規参入業者の脅威
- 代替品の脅威
- 競争の脅威
- 市況
第8章 市場セグメンテーション:製品別
- 市場セグメント
- 比較:製品別
- 乾燥パスタ:市場規模と予測 2024-2029
- 冷蔵パスタ:市場規模と予測 2024-2029
- 缶・保存パスタ:市場規模と予測 2024-2029
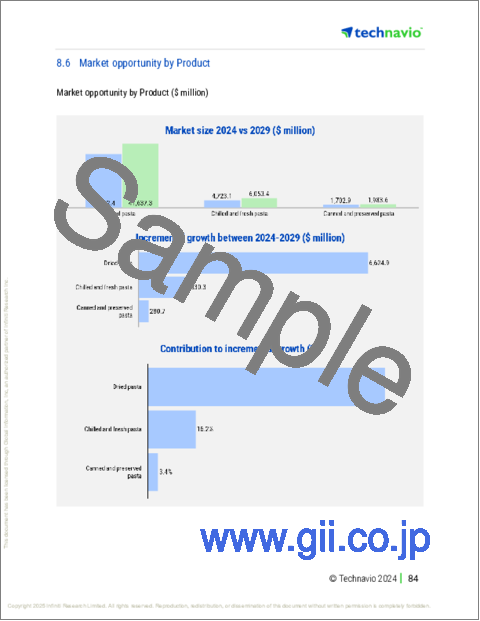
- 市場機会:製品別
第9章 市場セグメンテーション:流通チャネル別
- 市場セグメント
- 比較:流通チャネル別
- オフライン:市場規模と予測 2024-2029
- オンライン:市場規模と予測 2024-2029
- 市場機会:流通チャネル別
第10章 市場セグメンテーション:原材料別
- 市場セグメント
- 比較:原材料別
- 粗挽き粉:市場規模と予測 2024-2029
- 精製小麦粉:市場規模と予測 2024-2029
- デュラム小麦:市場規模と予測 2024-2029
- ひよこ豆:市場規模と予測 2024-2029
- その他:市場規模と予測 2024-2029
- 市場機会:原材料別
第11章 市場セグメンテーション:タイプ別
- 市場セグメント
- 比較:タイプ別
- スパゲッティ:市場規模と予測 2024-2029
- ペンネ:市場規模と予測 2024-2029
- エルボー・マカロニ:市場規模と予測 2024-2029
- フェットチーネとリングイネ:市場規模と予測 2024-2029
- その他:市場規模と予測 2024-2029
- 市場機会:タイプ別
第12章 顧客情勢
- 顧客情勢の概要
第13章 地域別情勢
- 地域別セグメンテーション
- 地域別比較
- 欧州:市場規模と予測 2024-2029
- 北米:市場規模と予測 2024-2029
- アジア太平洋:市場規模と予測 2024-2029
- 南米:市場規模と予測 2024-2029
- 中東・アフリカ:市場規模と予測 2024-2029
- 米国:市場規模と予測 2024-2029
- イタリア:市場規模と予測 2024-2029
- ドイツ:市場規模と予測 2024-2029
- フランス:市場規模と予測 2024-2029
- 英国:市場規模と予測 2024-2029
- 中国:市場規模と予測 2024-2029
- カナダ:市場規模と予測 2024-2029
- ブラジル:市場規模と予測 2024-2029
- 日本:市場規模と予測 2024-2029
- インド:市場規模と予測 2024-2029
- 市場機会:地域情勢別
第14章 促進要因・課題・機会・抑制要因
- 市場促進要因
- 市場の課題
- 促進要因と課題の影響
- 市場の機会・抑制要因
第15章 競合情勢
- 概要
- 競合情勢
- 混乱の状況
- 業界のリスク
第16章 競合分析
- 企業プロファイル
- 企業ランキング指数
- 企業の市場ポジショニング
- Archer Daniels Midland Co.
- Barilla G. e R. Fratelli Spa
- Catelli Foods Corp
- Ebro foods SA
- F. Divella Spa
- F.lli De Cecco di Filippo SpA
- ITC Ltd.
- JSC MAKFA
- Nestle SA
- Newlat Food SpA
- Prairie Harvest Canada Ltd.
- Rana USA Inc.
- Slendier
- The Kraft Heinz Co.
第17章 付録
Exhibits:
- Exhibits1: Executive Summary - Chart on Market Overview
- Exhibits2: Executive Summary - Data Table on Market Overview
- Exhibits3: Executive Summary - Chart on Global Market Characteristics
- Exhibits4: Executive Summary - Chart on Market By Geographical Landscape
- Exhibits5: Executive Summary - Chart on Market Segmentation by Product
- Exhibits6: Executive Summary - Chart on Market Segmentation by Distribution Channel
- Exhibits7: Executive Summary - Chart on Market Segmentation by Raw Material
- Exhibits8: Executive Summary - Chart on Market Segmentation by Type
- Exhibits9: Executive Summary - Chart on Incremental Growth
- Exhibits10: Executive Summary - Data Table on Incremental Growth
- Exhibits11: Executive Summary - Chart on Company Market Positioning
- Exhibits12: Analysis of price sensitivity, lifecycle, customer purchase basket, adoption rates, and purchase criteria
- Exhibits13: Overview on criticality of inputs and factors of differentiation
- Exhibits14: Overview on factors of disruption
- Exhibits15: Impact of drivers and challenges in 2024 and 2029
- Exhibits16: Parent Market
- Exhibits17: Data Table on - Parent Market
- Exhibits18: Market characteristics analysis
- Exhibits19: Value chain analysis
- Exhibits20: Offerings of companies included in the market definition
- Exhibits21: Market segments
- Exhibits22: Chart on Global - Market size and forecast 2024-2029 ($ million)
- Exhibits23: Data Table on Global - Market size and forecast 2024-2029 ($ million)
- Exhibits24: Chart on Global Market: Year-over-year growth 2024-2029 (%)
- Exhibits25: Data Table on Global Market: Year-over-year growth 2024-2029 (%)
- Exhibits26: Historic Market Size - Data Table on Global Pasta Market 2019 - 2023 ($ million)
- Exhibits27: Historic Market Size - Product Segment 2019 - 2023 ($ million)
- Exhibits28: Historic Market Size - Distribution Channel Segment 2019 - 2023 ($ million)
- Exhibits29: Historic Market Size - Raw Material Segment 2019 - 2023 ($ million)
- Exhibits30: Historic Market Size - Type Segment 2019 - 2023 ($ million)
- Exhibits31: Historic Market Size - Geography Segment 2019 - 2023 ($ million)
- Exhibits32: Historic Market Size - Country Segment 2019 - 2023 ($ million)
- Exhibits33: Five forces analysis - Comparison between 2024 and 2029
- Exhibits34: Bargaining power of buyers - Impact of key factors 2024 and 2029
- Exhibits35: Bargaining power of suppliers - Impact of key factors in 2024 and 2029
- Exhibits36: Threat of new entrants - Impact of key factors in 2024 and 2029
- Exhibits37: Threat of substitutes - Impact of key factors in 2024 and 2029
- Exhibits38: Threat of rivalry - Impact of key factors in 2024 and 2029
- Exhibits39: Chart on Market condition - Five forces 2024 and 2029
- Exhibits40: Chart on Product - Market share 2024-2029 (%)
- Exhibits41: Data Table on Product - Market share 2024-2029 (%)
- Exhibits42: Chart on Comparison by Product
- Exhibits43: Data Table on Comparison by Product
- Exhibits44: Chart on Dried pasta - Market size and forecast 2024-2029 ($ million)
- Exhibits45: Data Table on Dried pasta - Market size and forecast 2024-2029 ($ million)
- Exhibits46: Chart on Dried pasta - Year-over-year growth 2024-2029 (%)
- Exhibits47: Data Table on Dried pasta - Year-over-year growth 2024-2029 (%)
- Exhibits48: Chart on Chilled and fresh pasta - Market size and forecast 2024-2029 ($ million)
- Exhibits49: Data Table on Chilled and fresh pasta - Market size and forecast 2024-2029 ($ million)
- Exhibits50: Chart on Chilled and fresh pasta - Year-over-year growth 2024-2029 (%)
- Exhibits51: Data Table on Chilled and fresh pasta - Year-over-year growth 2024-2029 (%)
- Exhibits52: Chart on Canned and preserved pasta - Market size and forecast 2024-2029 ($ million)
- Exhibits53: Data Table on Canned and preserved pasta - Market size and forecast 2024-2029 ($ million)
- Exhibits54: Chart on Canned and preserved pasta - Year-over-year growth 2024-2029 (%)
- Exhibits55: Data Table on Canned and preserved pasta - Year-over-year growth 2024-2029 (%)
- Exhibits56: Market opportunity by Product ($ million)
- Exhibits57: Data Table on Market opportunity by Product ($ million)
- Exhibits58: Chart on Distribution Channel - Market share 2024-2029 (%)
- Exhibits59: Data Table on Distribution Channel - Market share 2024-2029 (%)
- Exhibits60: Chart on Comparison by Distribution Channel
- Exhibits61: Data Table on Comparison by Distribution Channel
- Exhibits62: Chart on Offline - Market size and forecast 2024-2029 ($ million)
- Exhibits63: Data Table on Offline - Market size and forecast 2024-2029 ($ million)
- Exhibits64: Chart on Offline - Year-over-year growth 2024-2029 (%)
- Exhibits65: Data Table on Offline - Year-over-year growth 2024-2029 (%)
- Exhibits66: Chart on Online - Market size and forecast 2024-2029 ($ million)
- Exhibits67: Data Table on Online - Market size and forecast 2024-2029 ($ million)
- Exhibits68: Chart on Online - Year-over-year growth 2024-2029 (%)
- Exhibits69: Data Table on Online - Year-over-year growth 2024-2029 (%)
- Exhibits70: Market opportunity by Distribution Channel ($ million)
- Exhibits71: Data Table on Market opportunity by Distribution Channel ($ million)
- Exhibits72: Chart on Raw Material - Market share 2024-2029 (%)
- Exhibits73: Data Table on Raw Material - Market share 2024-2029 (%)
- Exhibits74: Chart on Comparison by Raw Material
- Exhibits75: Data Table on Comparison by Raw Material
- Exhibits76: Chart on Semolina - Market size and forecast 2024-2029 ($ million)
- Exhibits77: Data Table on Semolina - Market size and forecast 2024-2029 ($ million)
- Exhibits78: Chart on Semolina - Year-over-year growth 2024-2029 (%)
- Exhibits79: Data Table on Semolina - Year-over-year growth 2024-2029 (%)
- Exhibits80: Chart on Refined flour - Market size and forecast 2024-2029 ($ million)
- Exhibits81: Data Table on Refined flour - Market size and forecast 2024-2029 ($ million)
- Exhibits82: Chart on Refined flour - Year-over-year growth 2024-2029 (%)
- Exhibits83: Data Table on Refined flour - Year-over-year growth 2024-2029 (%)
- Exhibits84: Chart on Durum wheat - Market size and forecast 2024-2029 ($ million)
- Exhibits85: Data Table on Durum wheat - Market size and forecast 2024-2029 ($ million)
- Exhibits86: Chart on Durum wheat - Year-over-year growth 2024-2029 (%)
- Exhibits87: Data Table on Durum wheat - Year-over-year growth 2024-2029 (%)
- Exhibits88: Chart on Chickpea - Market size and forecast 2024-2029 ($ million)
- Exhibits89: Data Table on Chickpea - Market size and forecast 2024-2029 ($ million)
- Exhibits90: Chart on Chickpea - Year-over-year growth 2024-2029 (%)
- Exhibits91: Data Table on Chickpea - Year-over-year growth 2024-2029 (%)
- Exhibits92: Chart on Others - Market size and forecast 2024-2029 ($ million)
- Exhibits93: Data Table on Others - Market size and forecast 2024-2029 ($ million)
- Exhibits94: Chart on Others - Year-over-year growth 2024-2029 (%)
- Exhibits95: Data Table on Others - Year-over-year growth 2024-2029 (%)
- Exhibits96: Market opportunity by Raw Material ($ million)
- Exhibits97: Data Table on Market opportunity by Raw Material ($ million)
- Exhibits98: Chart on Type - Market share 2024-2029 (%)
- Exhibits99: Data Table on Type - Market share 2024-2029 (%)
- Exhibits100: Chart on Comparison by Type
- Exhibits101: Data Table on Comparison by Type
- Exhibits102: Chart on Spaghetti - Market size and forecast 2024-2029 ($ million)
- Exhibits103: Data Table on Spaghetti - Market size and forecast 2024-2029 ($ million)
- Exhibits104: Chart on Spaghetti - Year-over-year growth 2024-2029 (%)
- Exhibits105: Data Table on Spaghetti - Year-over-year growth 2024-2029 (%)
- Exhibits106: Chart on Penne - Market size and forecast 2024-2029 ($ million)
- Exhibits107: Data Table on Penne - Market size and forecast 2024-2029 ($ million)
- Exhibits108: Chart on Penne - Year-over-year growth 2024-2029 (%)
- Exhibits109: Data Table on Penne - Year-over-year growth 2024-2029 (%)
- Exhibits110: Chart on Elbows - Market size and forecast 2024-2029 ($ million)
- Exhibits111: Data Table on Elbows - Market size and forecast 2024-2029 ($ million)
- Exhibits112: Chart on Elbows - Year-over-year growth 2024-2029 (%)
- Exhibits113: Data Table on Elbows - Year-over-year growth 2024-2029 (%)
- Exhibits114: Chart on Fettuccine and linguine - Market size and forecast 2024-2029 ($ million)
- Exhibits115: Data Table on Fettuccine and linguine - Market size and forecast 2024-2029 ($ million)
- Exhibits116: Chart on Fettuccine and linguine - Year-over-year growth 2024-2029 (%)
- Exhibits117: Data Table on Fettuccine and linguine - Year-over-year growth 2024-2029 (%)
- Exhibits118: Chart on Others - Market size and forecast 2024-2029 ($ million)
- Exhibits119: Data Table on Others - Market size and forecast 2024-2029 ($ million)
- Exhibits120: Chart on Others - Year-over-year growth 2024-2029 (%)
- Exhibits121: Data Table on Others - Year-over-year growth 2024-2029 (%)
- Exhibits122: Market opportunity by Type ($ million)
- Exhibits123: Data Table on Market opportunity by Type ($ million)
- Exhibits124: Analysis of price sensitivity, lifecycle, customer purchase basket, adoption rates, and purchase criteria
- Exhibits125: Chart on Market share By Geographical Landscape 2024-2029 (%)
- Exhibits126: Data Table on Market share By Geographical Landscape 2024-2029 (%)
- Exhibits127: Chart on Geographic comparison
- Exhibits128: Data Table on Geographic comparison
- Exhibits129: Chart on Europe - Market size and forecast 2024-2029 ($ million)
- Exhibits130: Data Table on Europe - Market size and forecast 2024-2029 ($ million)
- Exhibits131: Chart on Europe - Year-over-year growth 2024-2029 (%)
- Exhibits132: Data Table on Europe - Year-over-year growth 2024-2029 (%)
- Exhibits133: Chart on North America - Market size and forecast 2024-2029 ($ million)
- Exhibits134: Data Table on North America - Market size and forecast 2024-2029 ($ million)
- Exhibits135: Chart on North America - Year-over-year growth 2024-2029 (%)
- Exhibits136: Data Table on North America - Year-over-year growth 2024-2029 (%)
- Exhibits137: Chart on APAC - Market size and forecast 2024-2029 ($ million)
- Exhibits138: Data Table on APAC - Market size and forecast 2024-2029 ($ million)
- Exhibits139: Chart on APAC - Year-over-year growth 2024-2029 (%)
- Exhibits140: Data Table on APAC - Year-over-year growth 2024-2029 (%)
- Exhibits141: Chart on South America - Market size and forecast 2024-2029 ($ million)
- Exhibits142: Data Table on South America - Market size and forecast 2024-2029 ($ million)
- Exhibits143: Chart on South America - Year-over-year growth 2024-2029 (%)
- Exhibits144: Data Table on South America - Year-over-year growth 2024-2029 (%)
- Exhibits145: Chart on Middle East and Africa - Market size and forecast 2024-2029 ($ million)
- Exhibits146: Data Table on Middle East and Africa - Market size and forecast 2024-2029 ($ million)
- Exhibits147: Chart on Middle East and Africa - Year-over-year growth 2024-2029 (%)
- Exhibits148: Data Table on Middle East and Africa - Year-over-year growth 2024-2029 (%)
- Exhibits149: Chart on US - Market size and forecast 2024-2029 ($ million)
- Exhibits150: Data Table on US - Market size and forecast 2024-2029 ($ million)
- Exhibits151: Chart on US - Year-over-year growth 2024-2029 (%)
- Exhibits152: Data Table on US - Year-over-year growth 2024-2029 (%)
- Exhibits153: Chart on Italy - Market size and forecast 2024-2029 ($ million)
- Exhibits154: Data Table on Italy - Market size and forecast 2024-2029 ($ million)
- Exhibits155: Chart on Italy - Year-over-year growth 2024-2029 (%)
- Exhibits156: Data Table on Italy - Year-over-year growth 2024-2029 (%)
- Exhibits157: Chart on Germany - Market size and forecast 2024-2029 ($ million)
- Exhibits158: Data Table on Germany - Market size and forecast 2024-2029 ($ million)
- Exhibits159: Chart on Germany - Year-over-year growth 2024-2029 (%)
- Exhibits160: Data Table on Germany - Year-over-year growth 2024-2029 (%)
- Exhibits161: Chart on France - Market size and forecast 2024-2029 ($ million)
- Exhibits162: Data Table on France - Market size and forecast 2024-2029 ($ million)
- Exhibits163: Chart on France - Year-over-year growth 2024-2029 (%)
- Exhibits164: Data Table on France - Year-over-year growth 2024-2029 (%)
- Exhibits165: Chart on UK - Market size and forecast 2024-2029 ($ million)
- Exhibits166: Data Table on UK - Market size and forecast 2024-2029 ($ million)
- Exhibits167: Chart on UK - Year-over-year growth 2024-2029 (%)
- Exhibits168: Data Table on UK - Year-over-year growth 2024-2029 (%)
- Exhibits169: Chart on China - Market size and forecast 2024-2029 ($ million)
- Exhibits170: Data Table on China - Market size and forecast 2024-2029 ($ million)
- Exhibits171: Chart on China - Year-over-year growth 2024-2029 (%)
- Exhibits172: Data Table on China - Year-over-year growth 2024-2029 (%)
- Exhibits173: Chart on Canada - Market size and forecast 2024-2029 ($ million)
- Exhibits174: Data Table on Canada - Market size and forecast 2024-2029 ($ million)
- Exhibits175: Chart on Canada - Year-over-year growth 2024-2029 (%)
- Exhibits176: Data Table on Canada - Year-over-year growth 2024-2029 (%)
- Exhibits177: Chart on Brazil - Market size and forecast 2024-2029 ($ million)
- Exhibits178: Data Table on Brazil - Market size and forecast 2024-2029 ($ million)
- Exhibits179: Chart on Brazil - Year-over-year growth 2024-2029 (%)
- Exhibits180: Data Table on Brazil - Year-over-year growth 2024-2029 (%)
- Exhibits181: Chart on Japan - Market size and forecast 2024-2029 ($ million)
- Exhibits182: Data Table on Japan - Market size and forecast 2024-2029 ($ million)
- Exhibits183: Chart on Japan - Year-over-year growth 2024-2029 (%)
- Exhibits184: Data Table on Japan - Year-over-year growth 2024-2029 (%)
- Exhibits185: Chart on India - Market size and forecast 2024-2029 ($ million)
- Exhibits186: Data Table on India - Market size and forecast 2024-2029 ($ million)
- Exhibits187: Chart on India - Year-over-year growth 2024-2029 (%)
- Exhibits188: Data Table on India - Year-over-year growth 2024-2029 (%)
- Exhibits189: Market opportunity By Geographical Landscape ($ million)
- Exhibits190: Data Tables on Market opportunity By Geographical Landscape ($ million)
- Exhibits191: Impact of drivers and challenges in 2024 and 2029
- Exhibits192: Overview on criticality of inputs and factors of differentiation
- Exhibits193: Overview on factors of disruption
- Exhibits194: Impact of key risks on business
- Exhibits195: Companies covered
- Exhibits196: Company ranking index
- Exhibits197: Matrix on companies position and classification
- Exhibits198: 8th Avenue Food and Provisions - Overview
- Exhibits199: 8th Avenue Food and Provisions - Product / Service
- Exhibits200: 8th Avenue Food and Provisions - Key offerings
- Exhibits201: SWOT
- Exhibits202: Archer Daniels Midland Co. - Overview
- Exhibits203: Archer Daniels Midland Co. - Business segments
- Exhibits204: Archer Daniels Midland Co. - Key news
- Exhibits205: Archer Daniels Midland Co. - Key offerings
- Exhibits206: Archer Daniels Midland Co. - Segment focus
- Exhibits207: SWOT
- Exhibits208: Barilla G. e R. Fratelli Spa - Overview
- Exhibits209: Barilla G. e R. Fratelli Spa - Product / Service
- Exhibits210: Barilla G. e R. Fratelli Spa - Key offerings
- Exhibits211: SWOT
- Exhibits212: Catelli Foods Corp - Overview
- Exhibits213: Catelli Foods Corp - Product / Service
- Exhibits214: Catelli Foods Corp - Key offerings
- Exhibits215: SWOT
- Exhibits216: Ebro foods SA - Overview
- Exhibits217: Ebro foods SA - Product / Service
- Exhibits218: Ebro foods SA - Key offerings
- Exhibits219: SWOT
- Exhibits220: F. Divella Spa - Overview
- Exhibits221: F. Divella Spa - Product / Service
- Exhibits222: F. Divella Spa - Key offerings
- Exhibits223: SWOT
- Exhibits224: F.lli De Cecco di Filippo SpA - Overview
- Exhibits225: F.lli De Cecco di Filippo SpA - Product / Service
- Exhibits226: F.lli De Cecco di Filippo SpA - Key offerings
- Exhibits227: SWOT
- Exhibits228: ITC Ltd. - Overview
- Exhibits229: ITC Ltd. - Business segments
- Exhibits230: ITC Ltd. - Key news
- Exhibits231: ITC Ltd. - Key offerings
- Exhibits232: ITC Ltd. - Segment focus
- Exhibits233: SWOT
- Exhibits234: JSC MAKFA - Overview
- Exhibits235: JSC MAKFA - Product / Service
- Exhibits236: JSC MAKFA - Key offerings
- Exhibits237: SWOT
- Exhibits238: Nestle SA - Overview
- Exhibits239: Nestle SA - Business segments
- Exhibits240: Nestle SA - Key news
- Exhibits241: Nestle SA - Key offerings
- Exhibits242: Nestle SA - Segment focus
- Exhibits243: SWOT
- Exhibits244: Newlat Food SpA - Overview
- Exhibits245: Newlat Food SpA - Product / Service
- Exhibits246: Newlat Food SpA - Key offerings
- Exhibits247: SWOT
- Exhibits248: Prairie Harvest Canada Ltd. - Overview
- Exhibits249: Prairie Harvest Canada Ltd. - Product / Service
- Exhibits250: Prairie Harvest Canada Ltd. - Key offerings
- Exhibits251: SWOT
- Exhibits252: Rana USA Inc. - Overview
- Exhibits253: Rana USA Inc. - Product / Service
- Exhibits254: Rana USA Inc. - Key offerings
- Exhibits255: SWOT
- Exhibits256: Slendier - Overview
- Exhibits257: Slendier - Product / Service
- Exhibits258: Slendier - Key offerings
- Exhibits259: SWOT
- Exhibits260: The Kraft Heinz Co. - Overview
- Exhibits261: The Kraft Heinz Co. - Business segments
- Exhibits262: The Kraft Heinz Co. - Key news
- Exhibits263: The Kraft Heinz Co. - Key offerings
- Exhibits264: The Kraft Heinz Co. - Segment focus
- Exhibits265: SWOT
- Exhibits266: Inclusions checklist
- Exhibits267: Exclusions checklist
- Exhibits268: Currency conversion rates for US$
- Exhibits269: Research methodology
- Exhibits270: Information sources
- Exhibits271: Data validation
- Exhibits272: Validation techniques employed for market sizing
- Exhibits273: Data synthesis
- Exhibits274: 360 degree market analysis
- Exhibits275: List of abbreviations
The pasta market is forecasted to grow by USD 8235.9 million during 2024-2029, accelerating at a CAGR of 3.7% during the forecast period. The report on the pasta market provides a holistic analysis, market size and forecast, trends, growth drivers, and challenges, as well as vendor analysis covering around 25 vendors.
The report offers an up-to-date analysis regarding the current market scenario, the latest trends and drivers, and the overall market environment. The market is driven by increased demand for instant pasta, expansion of retail landscape, and growing demand for international cuisine.
| Market Scope | |
|---|---|
| Base Year | 2025 |
| End Year | 2029 |
| Series Year | 2025-2029 |
| Growth Momentum | Accelerate |
| YOY 2025 | 3.5% |
| CAGR | 3.7% |
| Incremental Value | $8235.9 mn |
The study was conducted using an objective combination of primary and secondary information including inputs from key participants in the industry. The report contains a comprehensive market size data, segment with regional analysis and vendor landscape in addition to an analysis of the key companies. Reports have historic and forecast data.
Technavio's pasta market is segmented as below:
By Product
- Dried pasta
- Chilled and fresh pasta
- Canned and preserved pasta
By Distribution Channel
- Offline
- Online
By Raw Material
- Semolina
- Refined flour
- Durum wheat
- Chickpea
- Others
By Type
- Spaghetti
- Penne
- Elbows
- Fettuccine and linguine
- Others
By Geographical Landscape
- Europe
- North America
- APAC
- South America
- Middle East and Africa
This study identifies the increasing demand for local flavors and varieties as one of the prime reasons driving the pasta market growth during the next few years. Also, prominence of health and wellness pasta and growing prominence of private labels will lead to sizable demand in the market.
The report on the pasta market covers the following areas:
- Pasta Market sizing
- Pasta Market forecast
- Pasta Market industry analysis
The robust vendor analysis is designed to help clients improve their market position, and in line with this, this report provides a detailed analysis of several leading pasta market vendors that include 8th Avenue Food and Provisions, Archer Daniels Midland Co., Barilla G. e R. Fratelli Spa, Catelli Foods Corp, Ebro foods SA, F. Divella Spa, F.lli De Cecco di Filippo SpA, ITC Ltd., JSC MAKFA, Nestle SA, Newlat Food SpA, Prairie Harvest Canada Ltd., Rana USA Inc., Slendier, The Kraft Heinz Co., TreeHouse Foods Inc., Ugo Foods Group Ltd., and Unilever PLC. Also, the pasta market analysis report includes information on upcoming trends and challenges that will influence market growth. This is to help companies strategize and leverage all forthcoming growth opportunities.
The publisher presents a detailed picture of the market by the way of study, synthesis, and summation of data from multiple sources by an analysis of key parameters such as profit, pricing, competition, and promotions. It presents various market facets by identifying the key industry influencers. The data presented is comprehensive, reliable, and a result of extensive primary and secondary research. The market research reports provide a complete competitive landscape and an in-depth vendor selection methodology and analysis using qualitative and quantitative research to forecast accurate market growth.
Table of Contents
1 Executive Summary
- 1.1 Market overview
- Executive Summary - Chart on Market Overview
- Executive Summary - Data Table on Market Overview
- Executive Summary - Chart on Global Market Characteristics
- Executive Summary - Chart on Market By Geographical Landscape
- Executive Summary - Chart on Market Segmentation by Product
- Executive Summary - Chart on Market Segmentation by Distribution Channel
- Executive Summary - Chart on Market Segmentation by Raw Material
- Executive Summary - Chart on Market Segmentation by Type
- Executive Summary - Chart on Incremental Growth
- Executive Summary - Data Table on Incremental Growth
- Executive Summary - Chart on Company Market Positioning
2 Technavio Analysis
- 2.1 Analysis of price sensitivity, lifecycle, customer purchase basket, adoption rates, and purchase criteria
- Analysis of price sensitivity, lifecycle, customer purchase basket, adoption rates, and purchase criteria
- 2.2 Criticality of inputs and Factors of differentiation
- Overview on criticality of inputs and factors of differentiation
- 2.3 Factors of disruption
- Overview on factors of disruption
- 2.4 Impact of drivers and challenges
- Impact of drivers and challenges in 2024 and 2029
3 Market Landscape
- 3.1 Market ecosystem
- Parent Market
- Data Table on - Parent Market
- 3.2 Market characteristics
- Market characteristics analysis
- 3.3 Value chain analysis
- Value chain analysis
4 Market Sizing
- 4.1 Market definition
- Offerings of companies included in the market definition
- 4.2 Market segment analysis
- Market segments
- 4.3 Market size 2024
- 4.4 Market outlook: Forecast for 2024-2029
- Chart on Global - Market size and forecast 2024-2029 ($ million)
- Data Table on Global - Market size and forecast 2024-2029 ($ million)
- Chart on Global Market: Year-over-year growth 2024-2029 (%)
- Data Table on Global Market: Year-over-year growth 2024-2029 (%)
5 Historic Market Size
- 5.1 Global Pasta Market 2019 - 2023
- Historic Market Size - Data Table on Global Pasta Market 2019 - 2023 ($ million)
- 5.2 Product segment analysis 2019 - 2023
- Historic Market Size - Product Segment 2019 - 2023 ($ million)
- 5.3 Distribution Channel segment analysis 2019 - 2023
- Historic Market Size - Distribution Channel Segment 2019 - 2023 ($ million)
- 5.4 Raw Material segment analysis 2019 - 2023
- Historic Market Size - Raw Material Segment 2019 - 2023 ($ million)
- 5.5 Type segment analysis 2019 - 2023
- Historic Market Size - Type Segment 2019 - 2023 ($ million)
- 5.6 Geography segment analysis 2019 - 2023
- Historic Market Size - Geography Segment 2019 - 2023 ($ million)
- 5.7 Country segment analysis 2019 - 2023
- Historic Market Size - Country Segment 2019 - 2023 ($ million)
6 Qualitative Analysis
- 6.1 The AI impact on Global Pasta Market
7 Five Forces Analysis
- 7.1 Five forces summary
- Five forces analysis - Comparison between 2024 and 2029
- 7.2 Bargaining power of buyers
- Bargaining power of buyers - Impact of key factors 2024 and 2029
- 7.3 Bargaining power of suppliers
- Bargaining power of suppliers - Impact of key factors in 2024 and 2029
- 7.4 Threat of new entrants
- Threat of new entrants - Impact of key factors in 2024 and 2029
- 7.5 Threat of substitutes
- Threat of substitutes - Impact of key factors in 2024 and 2029
- 7.6 Threat of rivalry
- Threat of rivalry - Impact of key factors in 2024 and 2029
- 7.7 Market condition
- Chart on Market condition - Five forces 2024 and 2029
8 Market Segmentation by Product
- 8.1 Market segments
- Chart on Product - Market share 2024-2029 (%)
- Data Table on Product - Market share 2024-2029 (%)
- 8.2 Comparison by Product
- Chart on Comparison by Product
- Data Table on Comparison by Product
- 8.3 Dried pasta - Market size and forecast 2024-2029
- Chart on Dried pasta - Market size and forecast 2024-2029 ($ million)
- Data Table on Dried pasta - Market size and forecast 2024-2029 ($ million)
- Chart on Dried pasta - Year-over-year growth 2024-2029 (%)
- Data Table on Dried pasta - Year-over-year growth 2024-2029 (%)
- 8.4 Chilled and fresh pasta - Market size and forecast 2024-2029
- Chart on Chilled and fresh pasta - Market size and forecast 2024-2029 ($ million)
- Data Table on Chilled and fresh pasta - Market size and forecast 2024-2029 ($ million)
- Chart on Chilled and fresh pasta - Year-over-year growth 2024-2029 (%)
- Data Table on Chilled and fresh pasta - Year-over-year growth 2024-2029 (%)
- 8.5 Canned and preserved pasta - Market size and forecast 2024-2029
- Chart on Canned and preserved pasta - Market size and forecast 2024-2029 ($ million)
- Data Table on Canned and preserved pasta - Market size and forecast 2024-2029 ($ million)
- Chart on Canned and preserved pasta - Year-over-year growth 2024-2029 (%)
- Data Table on Canned and preserved pasta - Year-over-year growth 2024-2029 (%)
- 8.6 Market opportunity by Product
- Market opportunity by Product ($ million)
- Data Table on Market opportunity by Product ($ million)
9 Market Segmentation by Distribution Channel
- 9.1 Market segments
- Chart on Distribution Channel - Market share 2024-2029 (%)
- Data Table on Distribution Channel - Market share 2024-2029 (%)
- 9.2 Comparison by Distribution Channel
- Chart on Comparison by Distribution Channel
- Data Table on Comparison by Distribution Channel
- 9.3 Offline - Market size and forecast 2024-2029
- Chart on Offline - Market size and forecast 2024-2029 ($ million)
- Data Table on Offline - Market size and forecast 2024-2029 ($ million)
- Chart on Offline - Year-over-year growth 2024-2029 (%)
- Data Table on Offline - Year-over-year growth 2024-2029 (%)
- 9.4 Online - Market size and forecast 2024-2029
- Chart on Online - Market size and forecast 2024-2029 ($ million)
- Data Table on Online - Market size and forecast 2024-2029 ($ million)
- Chart on Online - Year-over-year growth 2024-2029 (%)
- Data Table on Online - Year-over-year growth 2024-2029 (%)
- 9.5 Market opportunity by Distribution Channel
- Market opportunity by Distribution Channel ($ million)
- Data Table on Market opportunity by Distribution Channel ($ million)
10 Market Segmentation by Raw Material
- 10.1 Market segments
- Chart on Raw Material - Market share 2024-2029 (%)
- Data Table on Raw Material - Market share 2024-2029 (%)
- 10.2 Comparison by Raw Material
- Chart on Comparison by Raw Material
- Data Table on Comparison by Raw Material
- 10.3 Semolina - Market size and forecast 2024-2029
- Chart on Semolina - Market size and forecast 2024-2029 ($ million)
- Data Table on Semolina - Market size and forecast 2024-2029 ($ million)
- Chart on Semolina - Year-over-year growth 2024-2029 (%)
- Data Table on Semolina - Year-over-year growth 2024-2029 (%)
- 10.4 Refined flour - Market size and forecast 2024-2029
- Chart on Refined flour - Market size and forecast 2024-2029 ($ million)
- Data Table on Refined flour - Market size and forecast 2024-2029 ($ million)
- Chart on Refined flour - Year-over-year growth 2024-2029 (%)
- Data Table on Refined flour - Year-over-year growth 2024-2029 (%)
- 10.5 Durum wheat - Market size and forecast 2024-2029
- Chart on Durum wheat - Market size and forecast 2024-2029 ($ million)
- Data Table on Durum wheat - Market size and forecast 2024-2029 ($ million)
- Chart on Durum wheat - Year-over-year growth 2024-2029 (%)
- Data Table on Durum wheat - Year-over-year growth 2024-2029 (%)
- 10.6 Chickpea - Market size and forecast 2024-2029
- Chart on Chickpea - Market size and forecast 2024-2029 ($ million)
- Data Table on Chickpea - Market size and forecast 2024-2029 ($ million)
- Chart on Chickpea - Year-over-year growth 2024-2029 (%)
- Data Table on Chickpea - Year-over-year growth 2024-2029 (%)
- 10.7 Others - Market size and forecast 2024-2029
- Chart on Others - Market size and forecast 2024-2029 ($ million)
- Data Table on Others - Market size and forecast 2024-2029 ($ million)
- Chart on Others - Year-over-year growth 2024-2029 (%)
- Data Table on Others - Year-over-year growth 2024-2029 (%)
- 10.8 Market opportunity by Raw Material
- Market opportunity by Raw Material ($ million)
- Data Table on Market opportunity by Raw Material ($ million)
11 Market Segmentation by Type
- 11.1 Market segments
- Chart on Type - Market share 2024-2029 (%)
- Data Table on Type - Market share 2024-2029 (%)
- 11.2 Comparison by Type
- Chart on Comparison by Type
- Data Table on Comparison by Type
- 11.3 Spaghetti - Market size and forecast 2024-2029
- Chart on Spaghetti - Market size and forecast 2024-2029 ($ million)
- Data Table on Spaghetti - Market size and forecast 2024-2029 ($ million)
- Chart on Spaghetti - Year-over-year growth 2024-2029 (%)
- Data Table on Spaghetti - Year-over-year growth 2024-2029 (%)
- 11.4 Penne - Market size and forecast 2024-2029
- Chart on Penne - Market size and forecast 2024-2029 ($ million)
- Data Table on Penne - Market size and forecast 2024-2029 ($ million)
- Chart on Penne - Year-over-year growth 2024-2029 (%)
- Data Table on Penne - Year-over-year growth 2024-2029 (%)
- 11.5 Elbows - Market size and forecast 2024-2029
- Chart on Elbows - Market size and forecast 2024-2029 ($ million)
- Data Table on Elbows - Market size and forecast 2024-2029 ($ million)
- Chart on Elbows - Year-over-year growth 2024-2029 (%)
- Data Table on Elbows - Year-over-year growth 2024-2029 (%)
- 11.6 Fettuccine and linguine - Market size and forecast 2024-2029
- Chart on Fettuccine and linguine - Market size and forecast 2024-2029 ($ million)
- Data Table on Fettuccine and linguine - Market size and forecast 2024-2029 ($ million)
- Chart on Fettuccine and linguine - Year-over-year growth 2024-2029 (%)
- Data Table on Fettuccine and linguine - Year-over-year growth 2024-2029 (%)
- 11.7 Others - Market size and forecast 2024-2029
- Chart on Others - Market size and forecast 2024-2029 ($ million)
- Data Table on Others - Market size and forecast 2024-2029 ($ million)
- Chart on Others - Year-over-year growth 2024-2029 (%)
- Data Table on Others - Year-over-year growth 2024-2029 (%)
- 11.8 Market opportunity by Type
- Market opportunity by Type ($ million)
- Data Table on Market opportunity by Type ($ million)
12 Customer Landscape
- 12.1 Customer landscape overview
- Analysis of price sensitivity, lifecycle, customer purchase basket, adoption rates, and purchase criteria
13 Geographic Landscape
- 13.1 Geographic segmentation
- Chart on Market share By Geographical Landscape 2024-2029 (%)
- Data Table on Market share By Geographical Landscape 2024-2029 (%)
- 13.2 Geographic comparison
- Chart on Geographic comparison
- Data Table on Geographic comparison
- 13.3 Europe - Market size and forecast 2024-2029
- Chart on Europe - Market size and forecast 2024-2029 ($ million)
- Data Table on Europe - Market size and forecast 2024-2029 ($ million)
- Chart on Europe - Year-over-year growth 2024-2029 (%)
- Data Table on Europe - Year-over-year growth 2024-2029 (%)
- 13.4 North America - Market size and forecast 2024-2029
- Chart on North America - Market size and forecast 2024-2029 ($ million)
- Data Table on North America - Market size and forecast 2024-2029 ($ million)
- Chart on North America - Year-over-year growth 2024-2029 (%)
- Data Table on North America - Year-over-year growth 2024-2029 (%)
- 13.5 APAC - Market size and forecast 2024-2029
- Chart on APAC - Market size and forecast 2024-2029 ($ million)
- Data Table on APAC - Market size and forecast 2024-2029 ($ million)
- Chart on APAC - Year-over-year growth 2024-2029 (%)
- Data Table on APAC - Year-over-year growth 2024-2029 (%)
- 13.6 South America - Market size and forecast 2024-2029
- Chart on South America - Market size and forecast 2024-2029 ($ million)
- Data Table on South America - Market size and forecast 2024-2029 ($ million)
- Chart on South America - Year-over-year growth 2024-2029 (%)
- Data Table on South America - Year-over-year growth 2024-2029 (%)
- 13.7 Middle East and Africa - Market size and forecast 2024-2029
- Chart on Middle East and Africa - Market size and forecast 2024-2029 ($ million)
- Data Table on Middle East and Africa - Market size and forecast 2024-2029 ($ million)
- Chart on Middle East and Africa - Year-over-year growth 2024-2029 (%)
- Data Table on Middle East and Africa - Year-over-year growth 2024-2029 (%)
- 13.8 US - Market size and forecast 2024-2029
- Chart on US - Market size and forecast 2024-2029 ($ million)
- Data Table on US - Market size and forecast 2024-2029 ($ million)
- Chart on US - Year-over-year growth 2024-2029 (%)
- Data Table on US - Year-over-year growth 2024-2029 (%)
- 13.9 Italy - Market size and forecast 2024-2029
- Chart on Italy - Market size and forecast 2024-2029 ($ million)
- Data Table on Italy - Market size and forecast 2024-2029 ($ million)
- Chart on Italy - Year-over-year growth 2024-2029 (%)
- Data Table on Italy - Year-over-year growth 2024-2029 (%)
- 13.10 Germany - Market size and forecast 2024-2029
- Chart on Germany - Market size and forecast 2024-2029 ($ million)
- Data Table on Germany - Market size and forecast 2024-2029 ($ million)
- Chart on Germany - Year-over-year growth 2024-2029 (%)
- Data Table on Germany - Year-over-year growth 2024-2029 (%)
- 13.11 France - Market size and forecast 2024-2029
- Chart on France - Market size and forecast 2024-2029 ($ million)
- Data Table on France - Market size and forecast 2024-2029 ($ million)
- Chart on France - Year-over-year growth 2024-2029 (%)
- Data Table on France - Year-over-year growth 2024-2029 (%)
- 13.12 UK - Market size and forecast 2024-2029
- Chart on UK - Market size and forecast 2024-2029 ($ million)
- Data Table on UK - Market size and forecast 2024-2029 ($ million)
- Chart on UK - Year-over-year growth 2024-2029 (%)
- Data Table on UK - Year-over-year growth 2024-2029 (%)
- 13.13 China - Market size and forecast 2024-2029
- Chart on China - Market size and forecast 2024-2029 ($ million)
- Data Table on China - Market size and forecast 2024-2029 ($ million)
- Chart on China - Year-over-year growth 2024-2029 (%)
- Data Table on China - Year-over-year growth 2024-2029 (%)
- 13.14 Canada - Market size and forecast 2024-2029
- Chart on Canada - Market size and forecast 2024-2029 ($ million)
- Data Table on Canada - Market size and forecast 2024-2029 ($ million)
- Chart on Canada - Year-over-year growth 2024-2029 (%)
- Data Table on Canada - Year-over-year growth 2024-2029 (%)
- 13.15 Brazil - Market size and forecast 2024-2029
- Chart on Brazil - Market size and forecast 2024-2029 ($ million)
- Data Table on Brazil - Market size and forecast 2024-2029 ($ million)
- Chart on Brazil - Year-over-year growth 2024-2029 (%)
- Data Table on Brazil - Year-over-year growth 2024-2029 (%)
- 13.16 Japan - Market size and forecast 2024-2029
- Chart on Japan - Market size and forecast 2024-2029 ($ million)
- Data Table on Japan - Market size and forecast 2024-2029 ($ million)
- Chart on Japan - Year-over-year growth 2024-2029 (%)
- Data Table on Japan - Year-over-year growth 2024-2029 (%)
- 13.17 India - Market size and forecast 2024-2029
- Chart on India - Market size and forecast 2024-2029 ($ million)
- Data Table on India - Market size and forecast 2024-2029 ($ million)
- Chart on India - Year-over-year growth 2024-2029 (%)
- Data Table on India - Year-over-year growth 2024-2029 (%)
- 13.18 Market opportunity By Geographical Landscape
- Market opportunity By Geographical Landscape ($ million)
- Data Tables on Market opportunity By Geographical Landscape ($ million)
14 Drivers, Challenges, and Opportunity/Restraints
- 14.1 Market drivers
- 14.2 Market challenges
- 14.3 Impact of drivers and challenges
- Impact of drivers and challenges in 2024 and 2029
- 14.4 Market opportunities/restraints
15 Competitive Landscape
- 15.1 Overview
- 15.2 Competitive Landscape
- Overview on criticality of inputs and factors of differentiation
- 15.3 Landscape disruption
- Overview on factors of disruption
- 15.4 Industry risks
- Impact of key risks on business
16 Competitive Analysis
- 16.1 Companies profiled
- Companies covered
- 16.2 Company ranking index
- Company ranking index
- 16.3 Market positioning of companies
- Matrix on companies position and classification
- 8th Avenue Food and Provisions
- 8th Avenue Food and Provisions - Overview
- 8th Avenue Food and Provisions - Product / Service
- 8th Avenue Food and Provisions - Key offerings
- SWOT
- 16.5 Archer Daniels Midland Co.
- Archer Daniels Midland Co. - Overview
- Archer Daniels Midland Co. - Business segments
- Archer Daniels Midland Co. - Key news
- Archer Daniels Midland Co. - Key offerings
- Archer Daniels Midland Co. - Segment focus
- SWOT
- 16.6 Barilla G. e R. Fratelli Spa
- Barilla G. e R. Fratelli Spa - Overview
- Barilla G. e R. Fratelli Spa - Product / Service
- Barilla G. e R. Fratelli Spa - Key offerings
- SWOT
- 16.7 Catelli Foods Corp
- Catelli Foods Corp - Overview
- Catelli Foods Corp - Product / Service
- Catelli Foods Corp - Key offerings
- SWOT
- 16.8 Ebro foods SA
- Ebro foods SA - Overview
- Ebro foods SA - Product / Service
- Ebro foods SA - Key offerings
- SWOT
- 16.9 F. Divella Spa
- F. Divella Spa - Overview
- F. Divella Spa - Product / Service
- F. Divella Spa - Key offerings
- SWOT
- 16.10 F.lli De Cecco di Filippo SpA
- F.lli De Cecco di Filippo SpA - Overview
- F.lli De Cecco di Filippo SpA - Product / Service
- F.lli De Cecco di Filippo SpA - Key offerings
- SWOT
- 16.11 ITC Ltd.
- ITC Ltd. - Overview
- ITC Ltd. - Business segments
- ITC Ltd. - Key news
- ITC Ltd. - Key offerings
- ITC Ltd. - Segment focus
- SWOT
- 16.12 JSC MAKFA
- JSC MAKFA - Overview
- JSC MAKFA - Product / Service
- JSC MAKFA - Key offerings
- SWOT
- 16.13 Nestle SA
- Nestle SA - Overview
- Nestle SA - Business segments
- Nestle SA - Key news
- Nestle SA - Key offerings
- Nestle SA - Segment focus
- SWOT
- 16.14 Newlat Food SpA
- Newlat Food SpA - Overview
- Newlat Food SpA - Product / Service
- Newlat Food SpA - Key offerings
- SWOT
- 16.15 Prairie Harvest Canada Ltd.
- Prairie Harvest Canada Ltd. - Overview
- Prairie Harvest Canada Ltd. - Product / Service
- Prairie Harvest Canada Ltd. - Key offerings
- SWOT
- 16.16 Rana USA Inc.
- Rana USA Inc. - Overview
- Rana USA Inc. - Product / Service
- Rana USA Inc. - Key offerings
- SWOT
- 16.17 Slendier
- Slendier - Overview
- Slendier - Product / Service
- Slendier - Key offerings
- SWOT
- 16.18 The Kraft Heinz Co.
- The Kraft Heinz Co. - Overview
- The Kraft Heinz Co. - Business segments
- The Kraft Heinz Co. - Key news
- The Kraft Heinz Co. - Key offerings
- The Kraft Heinz Co. - Segment focus
- SWOT
17 Appendix
- 17.1 Scope of the report
- 17.2 Inclusions and exclusions checklist
- Inclusions checklist
- Exclusions checklist
- 17.3 Currency conversion rates for US$
- Currency conversion rates for US$
- 17.4 Research methodology
- Research methodology
- 17.5 Data procurement
- Information sources
- 17.6 Data validation
- Data validation
- 17.7 Validation techniques employed for market sizing
- Validation techniques employed for market sizing
- 17.8 Data synthesis
- Data synthesis
- 17.9 360 degree market analysis
- 360 degree market analysis
- 17.10 List of abbreviations
- List of abbreviations
