|
|
市場調査レポート
商品コード
1490727
遺伝子パネルの世界市場(2024年~2028年)Global gene panel market 2024-2028 |
||||||
|
|||||||
カスタマイズ可能
|
|||||||


| 遺伝子パネルの世界市場(2024年~2028年) |
|
出版日: 2024年05月20日
発行: TechNavio
ページ情報: 英文 170 Pages
納期: 即納可能
|

全表示
- 概要
- 図表
- 目次
世界の遺伝子パネルの市場規模は、2023年~2028年に54億390万米ドル、予測期間中のCAGRは23.44%で成長すると予測されます。 当レポートでは、遺伝子パネル市場の全体的な分析、市場規模・予測、動向、成長促進要因、課題、約25のベンダーを網羅したベンダー分析などを掲載しています。
現在の市場シナリオ、最新動向と促進要因、市場環境全体に関する最新分析を提供しています。市場を牽引しているのは、がん標的治療における遺伝子パネルの利用拡大、遺伝性疾患患者の増加、次世代シーケンサー(NGS)検査のコスト低下です。
| 市場範囲 | |
|---|---|
| 基準年 | 2024年 |
| 終了年 | 2028年 |
| 予測期間 | 2024年~2028年 |
| 成長推進力 | 加速 |
| 前年比2024年 | 18.67% |
| CAGR | 23.44% |
| 増分額 | 54億390万米ドル |
本調査では、研究効率を最大化するための共同研究が、今後数年間の遺伝子パネル市場成長を促進する主な理由の1つであるとしています。また、市販の検査薬が利用可能であることや、患者の潜在的な副作用を特定するための遺伝子パネルの利用が増加していることも、市場の大きな需要につながると思われます。
目次
第1章 エグゼクティブサマリー
- 市場概要
第2章 市場情勢
- 市場エコシステム
- 市場の特徴
- バリューチェーン分析
第3章 市場規模の評価
- 市場の定義
- 市場セグメント分析
- 市場規模(2023年)
- 市場の見通し(2023年~2028年)
第4章 市場規模実績
- 世界の遺伝子パネル市場(2018年~2022年)
- 製品セグメント分析(2018年~2022年)
- 技術セグメント分析(2018年~2022年)
- 地域セグメント分析(2018年~2022年)
- 国セグメント分析(2018年~2022年)
第5章 ファイブフォース分析
- ファイブフォースの要約
- 買い手の交渉力
- 供給企業の交渉力
- 新規参入業者の脅威
- 代替品の脅威
- 競争の脅威
- 市況
第6章 市場セグメンテーション:製品別
- 市場セグメンテーション
- 比較:製品別
- 小型パネルテスト:市場規模と予測(2023年~2028年)
- 大型パネルテスト:市場規模と予測(2023年~2028年)
- 市場機会:製品別
第7章 市場セグメンテーション:技術別
- 市場セグメンテーション
- 比較:技術別
- アンプリコン:市場規模と予測(2023年~2028年)
- ハイブリッド:市場規模と予測(2023年~2028年)
- 市場機会:技術別
第8章 顧客情勢
- 顧客情勢の概要
第9章 地域情勢
- 地域セグメンテーション
- 地域別比較
- 北米:市場規模と予測(2023年~2028年)
- 欧州:市場規模と予測(2023年~2028年)
- アジア:市場規模と予測(2023年~2028年)
- 世界のその他の地域:市場規模と予測(2023年~2028年)
- 米国:市場規模と予測(2023年~2028年)
- ドイツ:市場規模と予測(2023年~2028年)
- 英国:市場規模と予測(2023年~2028年)
- 中国:市場規模と予測(2023年~2028年)
- フランス:市場規模と予測(2023年~2028年)
- 市場機会:地域情勢別
第10章 促進要因・課題・機会・抑制要因
- 市場促進要因
- 市場の課題
- 促進要因と課題の影響
- 市場の機会・抑制要因
第11章 競合情勢
- 概要
- 競合情勢
- 混乱の状況
- 業界のリスク
第12章 競合分析
- 企業プロファイル
- 企業の市場ポジショニング
- Agilent Technologies Inc.
- Azenta Inc.
- BGI Genomics Co. Ltd.
- CENTOGENE NV
- Color Health Inc.
- Danaher Corp.
- Eurofins Scientific SE
- F. Hoffmann La Roche Ltd.
- Illumina Inc.
- Invitae Corp.
- Novogene Co. Ltd.
- OPKO Health Inc.
- QIAGEN NV
- Quest Diagnostics Inc.
- Thermo Fisher Scientific Inc.
第13章 付録
Exhibits:
- Exhibits1: Executive Summary - Chart on Market Overview
- Exhibits2: Executive Summary - Data Table on Market Overview
- Exhibits3: Executive Summary - Chart on Global Market Characteristics
- Exhibits4: Executive Summary - Chart on Market By Geographical Landscape
- Exhibits5: Executive Summary - Chart on Market Segmentation by Product
- Exhibits6: Executive Summary - Chart on Market Segmentation by Technique
- Exhibits7: Executive Summary - Chart on Incremental Growth
- Exhibits8: Executive Summary - Data Table on Incremental Growth
- Exhibits9: Executive Summary - Chart on Company Market Positioning
- Exhibits10: Parent Market
- Exhibits11: Data Table on - Parent Market
- Exhibits12: Market characteristics analysis
- Exhibits13: Value Chain Analysis
- Exhibits14: Offerings of companies included in the market definition
- Exhibits15: Market segments
- Exhibits16: Chart on Global - Market size and forecast 2023-2028 ($ million)
- Exhibits17: Data Table on Global - Market size and forecast 2023-2028 ($ million)
- Exhibits18: Chart on Global Market: Year-over-year growth 2023-2028 (%)
- Exhibits19: Data Table on Global Market: Year-over-year growth 2023-2028 (%)
- Exhibits20: Historic Market Size - Data Table on Global Gene Panel Market 2018 - 2022 ($ million)
- Exhibits21: Historic Market Size - Product Segment 2018 - 2022 ($ million)
- Exhibits22: Historic Market Size - Technique Segment 2018 - 2022 ($ million)
- Exhibits23: Historic Market Size - Geography Segment 2018 - 2022 ($ million)
- Exhibits24: Historic Market Size - Country Segment 2018 - 2022 ($ million)
- Exhibits25: Five forces analysis - Comparison between 2023 and 2028
- Exhibits26: Bargaining power of buyers - Impact of key factors 2023 and 2028
- Exhibits27: Bargaining power of suppliers - Impact of key factors in 2023 and 2028
- Exhibits28: Threat of new entrants - Impact of key factors in 2023 and 2028
- Exhibits29: Threat of substitutes - Impact of key factors in 2023 and 2028
- Exhibits30: Threat of rivalry - Impact of key factors in 2023 and 2028
- Exhibits31: Chart on Market condition - Five forces 2023 and 2028
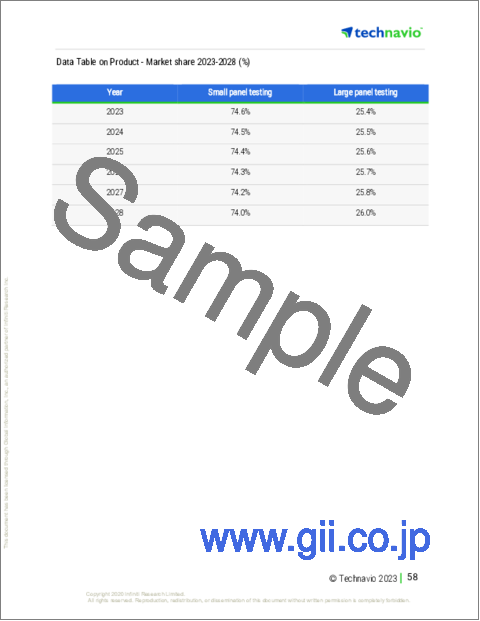
- Exhibits32: Chart on Product - Market share 2023-2028 (%)
- Exhibits33: Data Table on Product - Market share 2023-2028 (%)
- Exhibits34: Chart on Comparison by Product
- Exhibits35: Data Table on Comparison by Product
- Exhibits36: Chart on Small panel testing - Market size and forecast 2023-2028 ($ million)
- Exhibits37: Data Table on Small panel testing - Market size and forecast 2023-2028 ($ million)
- Exhibits38: Chart on Small panel testing - Year-over-year growth 2023-2028 (%)
- Exhibits39: Data Table on Small panel testing - Year-over-year growth 2023-2028 (%)
- Exhibits40: Chart on Large panel testing - Market size and forecast 2023-2028 ($ million)
- Exhibits41: Data Table on Large panel testing - Market size and forecast 2023-2028 ($ million)
- Exhibits42: Chart on Large panel testing - Year-over-year growth 2023-2028 (%)
- Exhibits43: Data Table on Large panel testing - Year-over-year growth 2023-2028 (%)
- Exhibits44: Market opportunity by Product ($ million)
- Exhibits45: Data Table on Market opportunity by Product ($ million)
- Exhibits46: Chart on Technique - Market share 2023-2028 (%)
- Exhibits47: Data Table on Technique - Market share 2023-2028 (%)
- Exhibits48: Chart on Comparison by Technique
- Exhibits49: Data Table on Comparison by Technique
- Exhibits50: Chart on Amplicon - Market size and forecast 2023-2028 ($ million)
- Exhibits51: Data Table on Amplicon - Market size and forecast 2023-2028 ($ million)
- Exhibits52: Chart on Amplicon - Year-over-year growth 2023-2028 (%)
- Exhibits53: Data Table on Amplicon - Year-over-year growth 2023-2028 (%)
- Exhibits54: Chart on Hybridization - Market size and forecast 2023-2028 ($ million)
- Exhibits55: Data Table on Hybridization - Market size and forecast 2023-2028 ($ million)
- Exhibits56: Chart on Hybridization - Year-over-year growth 2023-2028 (%)
- Exhibits57: Data Table on Hybridization - Year-over-year growth 2023-2028 (%)
- Exhibits58: Market opportunity by Technique ($ million)
- Exhibits59: Data Table on Market opportunity by Technique ($ million)
- Exhibits60: Analysis of price sensitivity, lifecycle, customer purchase basket, adoption rates, and purchase criteria
- Exhibits61: Chart on Market share By Geographical Landscape 2023-2028 (%)
- Exhibits62: Data Table on Market share By Geographical Landscape 2023-2028 (%)
- Exhibits63: Chart on Geographic comparison
- Exhibits64: Data Table on Geographic comparison
- Exhibits65: Chart on North America - Market size and forecast 2023-2028 ($ million)
- Exhibits66: Data Table on North America - Market size and forecast 2023-2028 ($ million)
- Exhibits67: Chart on North America - Year-over-year growth 2023-2028 (%)
- Exhibits68: Data Table on North America - Year-over-year growth 2023-2028 (%)
- Exhibits69: Chart on Europe - Market size and forecast 2023-2028 ($ million)
- Exhibits70: Data Table on Europe - Market size and forecast 2023-2028 ($ million)
- Exhibits71: Chart on Europe - Year-over-year growth 2023-2028 (%)
- Exhibits72: Data Table on Europe - Year-over-year growth 2023-2028 (%)
- Exhibits73: Chart on Asia - Market size and forecast 2023-2028 ($ million)
- Exhibits74: Data Table on Asia - Market size and forecast 2023-2028 ($ million)
- Exhibits75: Chart on Asia - Year-over-year growth 2023-2028 (%)
- Exhibits76: Data Table on Asia - Year-over-year growth 2023-2028 (%)
- Exhibits77: Chart on Rest of World (ROW) - Market size and forecast 2023-2028 ($ million)
- Exhibits78: Data Table on Rest of World (ROW) - Market size and forecast 2023-2028 ($ million)
- Exhibits79: Chart on Rest of World (ROW) - Year-over-year growth 2023-2028 (%)
- Exhibits80: Data Table on Rest of World (ROW) - Year-over-year growth 2023-2028 (%)
- Exhibits81: Chart on US - Market size and forecast 2023-2028 ($ million)
- Exhibits82: Data Table on US - Market size and forecast 2023-2028 ($ million)
- Exhibits83: Chart on US - Year-over-year growth 2023-2028 (%)
- Exhibits84: Data Table on US - Year-over-year growth 2023-2028 (%)
- Exhibits85: Chart on Germany - Market size and forecast 2023-2028 ($ million)
- Exhibits86: Data Table on Germany - Market size and forecast 2023-2028 ($ million)
- Exhibits87: Chart on Germany - Year-over-year growth 2023-2028 (%)
- Exhibits88: Data Table on Germany - Year-over-year growth 2023-2028 (%)
- Exhibits89: Chart on UK - Market size and forecast 2023-2028 ($ million)
- Exhibits90: Data Table on UK - Market size and forecast 2023-2028 ($ million)
- Exhibits91: Chart on UK - Year-over-year growth 2023-2028 (%)
- Exhibits92: Data Table on UK - Year-over-year growth 2023-2028 (%)
- Exhibits93: Chart on China - Market size and forecast 2023-2028 ($ million)
- Exhibits94: Data Table on China - Market size and forecast 2023-2028 ($ million)
- Exhibits95: Chart on China - Year-over-year growth 2023-2028 (%)
- Exhibits96: Data Table on China - Year-over-year growth 2023-2028 (%)
- Exhibits97: Chart on France - Market size and forecast 2023-2028 ($ million)
- Exhibits98: Data Table on France - Market size and forecast 2023-2028 ($ million)
- Exhibits99: Chart on France - Year-over-year growth 2023-2028 (%)
- Exhibits100: Data Table on France - Year-over-year growth 2023-2028 (%)
- Exhibits101: Market opportunity By Geographical Landscape ($ million)
- Exhibits102: Data Tables on Market opportunity By Geographical Landscape ($ million)
- Exhibits103: Impact of drivers and challenges in 2023 and 2028
- Exhibits104: Overview on criticality of inputs and factors of differentiation
- Exhibits105: Overview on factors of disruption
- Exhibits106: Impact of key risks on business
- Exhibits107: Companies covered
- Exhibits108: Matrix on companies position and classification
- Exhibits109: Agilent Technologies Inc. - Overview
- Exhibits110: Agilent Technologies Inc. - Business segments
- Exhibits111: Agilent Technologies Inc. - Key news
- Exhibits112: Agilent Technologies Inc. - Key offerings
- Exhibits113: Agilent Technologies Inc. - Segment focus
- Exhibits114: Azenta Inc. - Overview
- Exhibits115: Azenta Inc. - Business segments
- Exhibits116: Azenta Inc. - Key offerings
- Exhibits117: Azenta Inc. - Segment focus
- Exhibits118: BGI Genomics Co. Ltd. - Overview
- Exhibits119: BGI Genomics Co. Ltd. - Product / Service
- Exhibits120: BGI Genomics Co. Ltd. - Key offerings
- Exhibits121: CENTOGENE NV - Overview
- Exhibits122: CENTOGENE NV - Product / Service
- Exhibits123: CENTOGENE NV - Key offerings
- Exhibits124: Color Health Inc. - Overview
- Exhibits125: Color Health Inc. - Product / Service
- Exhibits126: Color Health Inc. - Key offerings
- Exhibits127: Danaher Corp. - Overview
- Exhibits128: Danaher Corp. - Business segments
- Exhibits129: Danaher Corp. - Key news
- Exhibits130: Danaher Corp. - Key offerings
- Exhibits131: Danaher Corp. - Segment focus
- Exhibits132: Eurofins Scientific SE - Overview
- Exhibits133: Eurofins Scientific SE - Business segments
- Exhibits134: Eurofins Scientific SE - Key offerings
- Exhibits135: Eurofins Scientific SE - Segment focus
- Exhibits136: F. Hoffmann La Roche Ltd. - Overview
- Exhibits137: F. Hoffmann La Roche Ltd. - Business segments
- Exhibits138: F. Hoffmann La Roche Ltd. - Key news
- Exhibits139: F. Hoffmann La Roche Ltd. - Key offerings
- Exhibits140: F. Hoffmann La Roche Ltd. - Segment focus
- Exhibits141: Illumina Inc. - Overview
- Exhibits142: Illumina Inc. - Business segments
- Exhibits143: Illumina Inc. - Key news
- Exhibits144: Illumina Inc. - Key offerings
- Exhibits145: Illumina Inc. - Segment focus
- Exhibits146: Invitae Corp. - Overview
- Exhibits147: Invitae Corp. - Product / Service
- Exhibits148: Invitae Corp. - Key offerings
- Exhibits149: Novogene Co. Ltd. - Overview
- Exhibits150: Novogene Co. Ltd. - Product / Service
- Exhibits151: Novogene Co. Ltd. - Key offerings
- Exhibits152: OPKO Health Inc. - Overview
- Exhibits153: OPKO Health Inc. - Business segments
- Exhibits154: OPKO Health Inc. - Key offerings
- Exhibits155: OPKO Health Inc. - Segment focus
- Exhibits156: QIAGEN NV - Overview
- Exhibits157: QIAGEN NV - Product / Service
- Exhibits158: QIAGEN NV - Key offerings
- Exhibits159: Quest Diagnostics Inc. - Overview
- Exhibits160: Quest Diagnostics Inc. - Business segments
- Exhibits161: Quest Diagnostics Inc. - Key offerings
- Exhibits162: Quest Diagnostics Inc. - Segment focus
- Exhibits163: Thermo Fisher Scientific Inc. - Overview
- Exhibits164: Thermo Fisher Scientific Inc. - Business segments
- Exhibits165: Thermo Fisher Scientific Inc. - Key news
- Exhibits166: Thermo Fisher Scientific Inc. - Key offerings
- Exhibits167: Thermo Fisher Scientific Inc. - Segment focus
- Exhibits168: Inclusions checklist
- Exhibits169: Exclusions checklist
- Exhibits170: Currency conversion rates for US$
- Exhibits171: Research methodology
- Exhibits172: Information sources
- Exhibits173: Data validation
- Exhibits174: Validation techniques employed for market sizing
- Exhibits175: Data synthesis
- Exhibits176: 360 degree market analysis
- Exhibits177: List of abbreviations
The gene panel market is forecasted to grow by USD 5403.9 mn during 2023-2028, accelerating at a CAGR of 23.44% during the forecast period. The report on the gene panel market provides a holistic analysis, market size and forecast, trends, growth drivers, and challenges, as well as vendor analysis covering around 25 vendors.
The report offers an up-to-date analysis regarding the current market scenario, the latest trends and drivers, and the overall market environment. The market is driven by growing use of gene panels in cancer-targeted therapies, increasing number of people with genetic disorders, and decreasing cost of next generation sequencing (NGS) gene panel tests.
Technavio's gene panel market is segmented as below:
| Market Scope | |
|---|---|
| Base Year | 2024 |
| End Year | 2028 |
| Series Year | 2024-2028 |
| Growth Momentum | Accelerate |
| YOY 2024 | 18.67% |
| CAGR | 23.44% |
| Incremental Value | $5403.9mn |
By Product
- Small panel testing
- Large panel testing
By Technique
- Amplicon
- Hybridization
By Geographical Landscape
- North America
- Europe
- Asia
- Rest of World (ROW)
This study identifies the collaboration to maximize research efficiency as one of the prime reasons driving the gene panel market growth during the next few years. Also, availability of over the counter test and increasing use of gene panels to identify potential side effects in patients will lead to sizable demand in the market.
The report on the gene panel market covers the following areas:
- Gene panel market sizing
- Gene panel market forecast
- Gene panel market industry analysis
The robust vendor analysis is designed to help clients improve their market position, and in line with this, this report provides a detailed analysis of several leading gene panel market vendors that include Agilent Technologies Inc., Azenta Inc., BGI Genomics Co. Ltd., CENTOGENE NV, Color Health Inc., Danaher Corp., Eurofins Scientific SE, F. Hoffmann La Roche Ltd., Fagron NV, GenXPro GmbH, Illumina Inc., Invitae Corp., MedGenome Labs Ltd., MGZ Medizinisch Genetisches Zentrum, Novogene Co. Ltd., OPKO Health Inc., Oxford Nanopore Technologies plc, QIAGEN NV, Quest Diagnostics Inc., and Thermo Fisher Scientific Inc.. Also, the gene panel market analysis report includes information on upcoming trends and challenges that will influence market growth. This is to help companies strategize and leverage all forthcoming growth opportunities.
The study was conducted using an objective combination of primary and secondary information including inputs from key participants in the industry. The report contains a comprehensive market and vendor landscape in addition to an analysis of the key vendors.
The publisher presents a detailed picture of the market by the way of study, synthesis, and summation of data from multiple sources by an analysis of key parameters such as profit, pricing, competition, and promotions. It presents various market facets by identifying the key industry influencers. The data presented is comprehensive, reliable, and a result of extensive research - both primary and secondary. The market research reports provide a complete competitive landscape and an in-depth vendor selection methodology and analysis using qualitative and quantitative research to forecast the accurate market growth.
Table of Contents
1 Executive Summary
- 1.1 Market overview
- Executive Summary - Chart on Market Overview
- Executive Summary - Data Table on Market Overview
- Executive Summary - Chart on Global Market Characteristics
- Executive Summary - Chart on Market By Geographical Landscape
- Executive Summary - Chart on Market Segmentation by Product
- Executive Summary - Chart on Market Segmentation by Technique
- Executive Summary - Chart on Incremental Growth
- Executive Summary - Data Table on Incremental Growth
- Executive Summary - Chart on Company Market Positioning
2 Market Landscape
- 2.1 Market ecosystem
- Parent Market
- Data Table on - Parent Market
- 2.2 Market characteristics
- Market characteristics analysis
- 2.3 Value chain analysis
- Value Chain Analysis
3 Market Sizing
- 3.1 Market definition
- Offerings of companies included in the market definition
- 3.2 Market segment analysis
- Market segments
- 3.3 Market size 2023
- 3.4 Market outlook: Forecast for 2023-2028
- Chart on Global - Market size and forecast 2023-2028 ($ million)
- Data Table on Global - Market size and forecast 2023-2028 ($ million)
- Chart on Global Market: Year-over-year growth 2023-2028 (%)
- Data Table on Global Market: Year-over-year growth 2023-2028 (%)
4 Historic Market Size
- 4.1 Global Gene Panel Market 2018 - 2022
- Historic Market Size - Data Table on Global Gene Panel Market 2018 - 2022 ($ million)
- 4.2 Product segment analysis 2018 - 2022
- Historic Market Size - Product Segment 2018 - 2022 ($ million)
- 4.3 Technique segment analysis 2018 - 2022
- Historic Market Size - Technique Segment 2018 - 2022 ($ million)
- 4.4 Geography segment analysis 2018 - 2022
- Historic Market Size - Geography Segment 2018 - 2022 ($ million)
- 4.5 Country segment analysis 2018 - 2022
- Historic Market Size - Country Segment 2018 - 2022 ($ million)
5 Five Forces Analysis
- 5.1 Five forces summary
- Five forces analysis - Comparison between 2023 and 2028
- 5.2 Bargaining power of buyers
- Bargaining power of buyers - Impact of key factors 2023 and 2028
- 5.3 Bargaining power of suppliers
- Bargaining power of suppliers - Impact of key factors in 2023 and 2028
- 5.4 Threat of new entrants
- Threat of new entrants - Impact of key factors in 2023 and 2028
- 5.5 Threat of substitutes
- Threat of substitutes - Impact of key factors in 2023 and 2028
- 5.6 Threat of rivalry
- Threat of rivalry - Impact of key factors in 2023 and 2028
- 5.7 Market condition
- Chart on Market condition - Five forces 2023 and 2028
6 Market Segmentation by Product
- 6.1 Market segments
- Chart on Product - Market share 2023-2028 (%)
- Data Table on Product - Market share 2023-2028 (%)
- 6.2 Comparison by Product
- Chart on Comparison by Product
- Data Table on Comparison by Product
- 6.3 Small panel testing - Market size and forecast 2023-2028
- Chart on Small panel testing - Market size and forecast 2023-2028 ($ million)
- Data Table on Small panel testing - Market size and forecast 2023-2028 ($ million)
- Chart on Small panel testing - Year-over-year growth 2023-2028 (%)
- Data Table on Small panel testing - Year-over-year growth 2023-2028 (%)
- 6.4 Large panel testing - Market size and forecast 2023-2028
- Chart on Large panel testing - Market size and forecast 2023-2028 ($ million)
- Data Table on Large panel testing - Market size and forecast 2023-2028 ($ million)
- Chart on Large panel testing - Year-over-year growth 2023-2028 (%)
- Data Table on Large panel testing - Year-over-year growth 2023-2028 (%)
- 6.5 Market opportunity by Product
- Market opportunity by Product ($ million)
- Data Table on Market opportunity by Product ($ million)
7 Market Segmentation by Technique
- 7.1 Market segments
- Chart on Technique - Market share 2023-2028 (%)
- Data Table on Technique - Market share 2023-2028 (%)
- 7.2 Comparison by Technique
- Chart on Comparison by Technique
- Data Table on Comparison by Technique
- 7.3 Amplicon - Market size and forecast 2023-2028
- Chart on Amplicon - Market size and forecast 2023-2028 ($ million)
- Data Table on Amplicon - Market size and forecast 2023-2028 ($ million)
- Chart on Amplicon - Year-over-year growth 2023-2028 (%)
- Data Table on Amplicon - Year-over-year growth 2023-2028 (%)
- 7.4 Hybridization - Market size and forecast 2023-2028
- Chart on Hybridization - Market size and forecast 2023-2028 ($ million)
- Data Table on Hybridization - Market size and forecast 2023-2028 ($ million)
- Chart on Hybridization - Year-over-year growth 2023-2028 (%)
- Data Table on Hybridization - Year-over-year growth 2023-2028 (%)
- 7.5 Market opportunity by Technique
- Market opportunity by Technique ($ million)
- Data Table on Market opportunity by Technique ($ million)
8 Customer Landscape
- 8.1 Customer landscape overview
- Analysis of price sensitivity, lifecycle, customer purchase basket, adoption rates, and purchase criteria
9 Geographic Landscape
- 9.1 Geographic segmentation
- Chart on Market share By Geographical Landscape 2023-2028 (%)
- Data Table on Market share By Geographical Landscape 2023-2028 (%)
- 9.2 Geographic comparison
- Chart on Geographic comparison
- Data Table on Geographic comparison
- 9.3 North America - Market size and forecast 2023-2028
- Chart on North America - Market size and forecast 2023-2028 ($ million)
- Data Table on North America - Market size and forecast 2023-2028 ($ million)
- Chart on North America - Year-over-year growth 2023-2028 (%)
- Data Table on North America - Year-over-year growth 2023-2028 (%)
- 9.4 Europe - Market size and forecast 2023-2028
- Chart on Europe - Market size and forecast 2023-2028 ($ million)
- Data Table on Europe - Market size and forecast 2023-2028 ($ million)
- Chart on Europe - Year-over-year growth 2023-2028 (%)
- Data Table on Europe - Year-over-year growth 2023-2028 (%)
- 9.5 Asia - Market size and forecast 2023-2028
- Chart on Asia - Market size and forecast 2023-2028 ($ million)
- Data Table on Asia - Market size and forecast 2023-2028 ($ million)
- Chart on Asia - Year-over-year growth 2023-2028 (%)
- Data Table on Asia - Year-over-year growth 2023-2028 (%)
- 9.6 Rest of World (ROW) - Market size and forecast 2023-2028
- Chart on Rest of World (ROW) - Market size and forecast 2023-2028 ($ million)
- Data Table on Rest of World (ROW) - Market size and forecast 2023-2028 ($ million)
- Chart on Rest of World (ROW) - Year-over-year growth 2023-2028 (%)
- Data Table on Rest of World (ROW) - Year-over-year growth 2023-2028 (%)
- 9.7 US - Market size and forecast 2023-2028
- Chart on US - Market size and forecast 2023-2028 ($ million)
- Data Table on US - Market size and forecast 2023-2028 ($ million)
- Chart on US - Year-over-year growth 2023-2028 (%)
- Data Table on US - Year-over-year growth 2023-2028 (%)
- 9.8 Germany - Market size and forecast 2023-2028
- Chart on Germany - Market size and forecast 2023-2028 ($ million)
- Data Table on Germany - Market size and forecast 2023-2028 ($ million)
- Chart on Germany - Year-over-year growth 2023-2028 (%)
- Data Table on Germany - Year-over-year growth 2023-2028 (%)
- 9.9 UK - Market size and forecast 2023-2028
- Chart on UK - Market size and forecast 2023-2028 ($ million)
- Data Table on UK - Market size and forecast 2023-2028 ($ million)
- Chart on UK - Year-over-year growth 2023-2028 (%)
- Data Table on UK - Year-over-year growth 2023-2028 (%)
- 9.10 China - Market size and forecast 2023-2028
- Chart on China - Market size and forecast 2023-2028 ($ million)
- Data Table on China - Market size and forecast 2023-2028 ($ million)
- Chart on China - Year-over-year growth 2023-2028 (%)
- Data Table on China - Year-over-year growth 2023-2028 (%)
- 9.11 France - Market size and forecast 2023-2028
- Chart on France - Market size and forecast 2023-2028 ($ million)
- Data Table on France - Market size and forecast 2023-2028 ($ million)
- Chart on France - Year-over-year growth 2023-2028 (%)
- Data Table on France - Year-over-year growth 2023-2028 (%)
- 9.12 Market opportunity By Geographical Landscape
- Market opportunity By Geographical Landscape ($ million)
- Data Tables on Market opportunity By Geographical Landscape ($ million)
10 Drivers, Challenges, and Opportunity/Restraints
- 10.1 Market drivers
- 10.2 Market challenges
- 10.3 Impact of drivers and challenges
- Impact of drivers and challenges in 2023 and 2028
- 10.4 Market opportunities/restraints
11 Competitive Landscape
- 11.1 Overview
- 11.2 Competitive Landscape
- Overview on criticality of inputs and factors of differentiation
- 11.3 Landscape disruption
- Overview on factors of disruption
- 11.4 Industry risks
- Impact of key risks on business
12 Competitive Analysis
- 12.1 Companies profiled
- Companies covered
- 12.2 Market positioning of companies
- Matrix on companies position and classification
- 12.3 Agilent Technologies Inc.
- Agilent Technologies Inc. - Overview
- Agilent Technologies Inc. - Business segments
- Agilent Technologies Inc. - Key news
- Agilent Technologies Inc. - Key offerings
- Agilent Technologies Inc. - Segment focus
- 12.4 Azenta Inc.
- Azenta Inc. - Overview
- Azenta Inc. - Business segments
- Azenta Inc. - Key offerings
- Azenta Inc. - Segment focus
- 12.5 BGI Genomics Co. Ltd.
- BGI Genomics Co. Ltd. - Overview
- BGI Genomics Co. Ltd. - Product / Service
- BGI Genomics Co. Ltd. - Key offerings
- 12.6 CENTOGENE NV
- CENTOGENE NV - Overview
- CENTOGENE NV - Product / Service
- CENTOGENE NV - Key offerings
- 12.7 Color Health Inc.
- Color Health Inc. - Overview
- Color Health Inc. - Product / Service
- Color Health Inc. - Key offerings
- 12.8 Danaher Corp.
- Danaher Corp. - Overview
- Danaher Corp. - Business segments
- Danaher Corp. - Key news
- Danaher Corp. - Key offerings
- Danaher Corp. - Segment focus
- 12.9 Eurofins Scientific SE
- Eurofins Scientific SE - Overview
- Eurofins Scientific SE - Business segments
- Eurofins Scientific SE - Key offerings
- Eurofins Scientific SE - Segment focus
- 12.10 F. Hoffmann La Roche Ltd.
- F. Hoffmann La Roche Ltd. - Overview
- F. Hoffmann La Roche Ltd. - Business segments
- F. Hoffmann La Roche Ltd. - Key news
- F. Hoffmann La Roche Ltd. - Key offerings
- F. Hoffmann La Roche Ltd. - Segment focus
- 12.11 Illumina Inc.
- Illumina Inc. - Overview
- Illumina Inc. - Business segments
- Illumina Inc. - Key news
- Illumina Inc. - Key offerings
- Illumina Inc. - Segment focus
- 12.12 Invitae Corp.
- Invitae Corp. - Overview
- Invitae Corp. - Product / Service
- Invitae Corp. - Key offerings
- 12.13 Novogene Co. Ltd.
- Novogene Co. Ltd. - Overview
- Novogene Co. Ltd. - Product / Service
- Novogene Co. Ltd. - Key offerings
- 12.14 OPKO Health Inc.
- OPKO Health Inc. - Overview
- OPKO Health Inc. - Business segments
- OPKO Health Inc. - Key offerings
- OPKO Health Inc. - Segment focus
- 12.15 QIAGEN NV
- QIAGEN NV - Overview
- QIAGEN NV - Product / Service
- QIAGEN NV - Key offerings
- 12.16 Quest Diagnostics Inc.
- Quest Diagnostics Inc. - Overview
- Quest Diagnostics Inc. - Business segments
- Quest Diagnostics Inc. - Key offerings
- Quest Diagnostics Inc. - Segment focus
- 12.17 Thermo Fisher Scientific Inc.
- Thermo Fisher Scientific Inc. - Overview
- Thermo Fisher Scientific Inc. - Business segments
- Thermo Fisher Scientific Inc. - Key news
- Thermo Fisher Scientific Inc. - Key offerings
- Thermo Fisher Scientific Inc. - Segment focus
13 Appendix
- 13.1 Scope of the report
- 13.2 Inclusions and exclusions checklist
- Inclusions checklist
- Exclusions checklist
- 13.3 Currency conversion rates for US$
- Currency conversion rates for US$
- 13.4 Research methodology
- Research methodology
- 13.5 Data procurement
- Information sources
- 13.6 Data validation
- Data validation
- 13.7 Validation techniques employed for market sizing
- Validation techniques employed for market sizing
- 13.8 Data synthesis
- Data synthesis
- 360 degree market analysis
- 360 degree market analysis
- 13.10 List of abbreviations
- List of abbreviations

