|
|
市場調査レポート
商品コード
1915294
世界の海事情報市場2026-2030年Global Maritime Information Market 2026-2030 |
||||||
|
|||||||
カスタマイズ可能
|
|||||||

| 世界の海事情報市場2026-2030年 |
|
出版日: 2026年01月19日
発行: TechNavio
ページ情報: 英文 301 Pages
納期: 即納可能
|

概要
世界の海事情報市場は、2025年から2030年にかけて13億5,050万米ドルの成長が見込まれ、予測期間中のCAGRは10.3%と予測されています。
本報告書では、世界の海事情報市場に関する包括的な分析、市場規模と予測、動向、成長要因、課題に加え、約25社のベンダー分析を提供しております。
本レポートは、現在の市場状況、最新の動向と促進要因、市場環境全般に関する最新の分析を提供します。市場の成長は、デジタルトランスフォーメーションの加速と先進技術の統合、電子商取引の急成長と消費者の期待の変化、自律航行船舶の台頭とスマート港湾イニシアチブによって牽引されています。
本調査は、業界の主要関係者からの情報を含む、一次情報と二次情報の客観的な組み合わせを用いて実施されました。本レポートには、主要企業の分析に加え、包括的な市場規模データ、地域別分析を伴うセグメント、ベンダー情勢が含まれています。レポートには過去データと予測データが掲載されています。
| 市場範囲 | |
|---|---|
| 基準年 | 2026年 |
| 終了年 | 2030年 |
| 予測期間 | 2026-2030 |
| 成長モメンタム | 加速 |
| 前年比2026年 | 9.5% |
| CAGR | 10.3% |
| 増分額 | 13億5,050万米ドル |
本調査では、今後数年間における世界の海事情報市場の成長を牽引する主要な要因の一つとして、人工知能および自律システムの導入加速を挙げております。また、先進的な衛星通信における海事接続性の革新、気候変動への適応、高度な気象分析が、市場において相当な需要を生み出すものと見込まれます。
目次
第1章 エグゼクティブサマリー
第2章 Technavio分析
- 価格・ライフサイクル・顧客購入バスケット・採用率・購入基準の分析
- インプットの重要性と差別化の要因
- 混乱の要因
- 促進要因と課題の影響
第3章 市場情勢
- 市場エコシステム
- 市場の特徴
- バリューチェーン分析
第4章 市場規模
- 市場の定義
- 市場セグメント分析
- 市場規模 2025
- 市場の見通し 2025-2030
第5章 市場規模実績
- 世界の海事情報市場 2020-2024
- エンドユーザーセグメント分析 2020-2024
- 用途別セグメント分析 2020-2024
- 展開セグメント分析 2020-2024
- 地域別セグメント分析 2020-2024
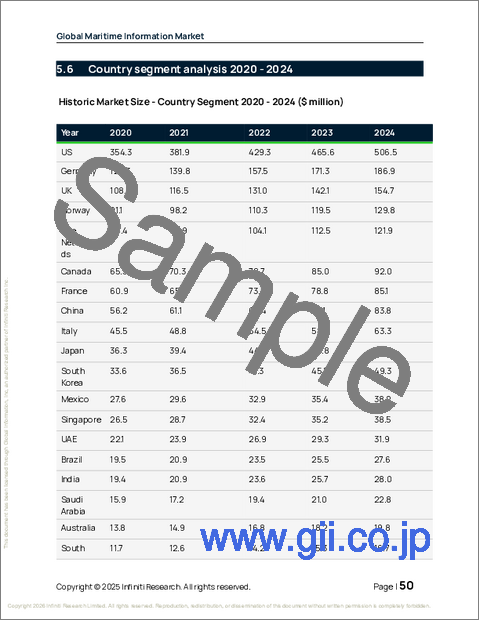
- 国別セグメント分析 2020-2024
第6章 定性分析
- AIの影響:世界の海事情報市場
第7章 ファイブフォース分析
- ファイブフォースの要約
- 買い手の交渉力
- 供給企業の交渉力
- 新規参入業者の脅威
- 代替品の脅威
- 競争の脅威
- 市況
第8章 市場セグメンテーション:エンドユーザー別
- 比較:エンドユーザー別
- 商業用
- 政府
- 市場機会:エンドユーザー別
第9章 市場セグメンテーション:用途別
- 比較:用途別
- MIA
- MIP
- VT
- AIS
- 市場機会:用途別
第10章 市場セグメンテーション:展開別
- 比較:展開別
- クラウド
- オンプレミス
- 市場機会:展開別
第11章 顧客情勢
第12章 地域別情勢
- 地域別セグメンテーション
- 地域別比較
- 欧州
- ドイツ
- 英国
- ノルウェー
- オランダ
- フランス
- イタリア
- 北米
- 米国
- カナダ
- メキシコ
- アジア太平洋
- 中国
- 日本
- 韓国
- シンガポール
- インド
- オーストラリア
- 中東・アフリカ
- アラブ首長国連邦
- サウジアラビア
- 南アフリカ
- エジプト
- カタール
- 南米
- ブラジル
- チリ
- アルゼンチン
- 市場機会:地域別
第13章 促進要因・課題・機会
- 市場促進要因
- 市場の課題
- 促進要因と課題の影響
- 市場機会
第14章 競合情勢
- 概要
- 競合情勢
- 混乱の状況
- 業界のリスク
第15章 競合分析
- 企業プロファイル
- 企業ランキング指標
- 企業の市場ポジショニング
- BAE Systems Plc
- Elbit Systems Ltd.
- Garmin Ltd.
- Inmarsat Global Ltd.
- Intelsat US LLC
- Kongsberg Gruppen ASA
- L3Harris Technologies Inc.
- Lockheed Martin Corp.
- Northrop Grumman Corp.
- ORBCOMM Inc.
- RTX Corp.
- Saab AB
- Singapore Telecom Ltd.
- Spire Global Inc.
- Thales Group

