|
|
市場調査レポート
商品コード
1479779
人工多能性幹細胞(iPS細胞)生産の世界市場2024-2028Global Induced Pluripotent Stem Cells Production Market 2024-2028 |
||||||

|
|||||||
カスタマイズ可能
|
|||||||

| 人工多能性幹細胞(iPS細胞)生産の世界市場2024-2028 |
|
出版日: 2024年05月02日
発行: TechNavio
ページ情報: 英文 169 Pages
納期: 即納可能
|

全表示
- 概要
- 図表
- 目次
人工多能性幹細胞生産市場は2023-2028年に18億4,179万米ドル、予測期間中のCAGRは11.66%で成長すると予測されます。
この調査レポートは、人工多能性幹細胞生産市場の全体的な分析、市場規模・予測、動向、成長促進要因・促進要因、課題、約25のベンダーを網羅したベンダー分析などを掲載しています。
現在の市場シナリオ、最新動向と促進要因、市場環境全体に関する最新分析を提供しています。市場は、いくつかの慢性疾患の有病率の上昇、創薬および毒性スクリーニング用途におけるiPS細胞の採用の増加、個別化医薬品のためのiPS細胞の需要の高まりによって牽引されています。
| 市場範囲 | |
|---|---|
| 基準年 | 2024 |
| 終了年 | 2028 |
| 予測期間 | 2024-2028 |
| 成長モメンタム | 加速 |
| 前年比2024年 | 10.09% |
| CAGR | 11.66% |
| 増分額 | 18億4,179万米ドル |
本調査では、今後数年間の人工多能性幹細胞生産市場の成長を牽引する主な要因の一つとして、細胞初期化技術の進歩を挙げています。また、人工多能性幹細胞バンクや貯蔵の出現、再生医療における人工多能性幹細胞の応用拡大も、市場の大きな需要につながると思われます。
目次
第1章 エグゼクティブサマリー
- 市場概要
第2章 市場情勢
- 市場エコシステム
第3章 市場規模の評価
- 市場の定義
- 市場セグメント分析
- 市場規模 2023
- 市場の見通し 2023-2028
第4章 市場規模実績
- 人工多能性幹細胞の世界生産市場 2018-2022
- エンドユーザーセグメント分析 2018-2022
- 製品セグメント分析 2018-2022
- 地域別セグメント分析 2018-2022
- 国別セグメント分析 2018-2022
第5章 ファイブフォース分析
- ファイブフォースの要約
- 買い手の交渉力
- 供給企業の交渉力
- 新規参入業者の脅威
- 代替品の脅威
- 競争の脅威
- 市況
第6章 エンドユーザー別市場セグメンテーション
- 市場セグメント
- 比較:エンドユーザー別
- 病院:市場規模と予測 2023-2028
- 調査機関:市場規模と予測 2023-2028
- バイオテクノロジー企業:市場規模と予測 2023-2028
- その他:市場規模と予測 2023-2028
- 市場機会:エンドユーザー別
第7章 製品別の市場セグメンテーション
- 市場セグメント
- 比較:製品別
- 消耗品とキット:市場規模と予測 2023-2028
- 器具:市場規模と予測 2023-2028
- サービス等:市場規模と予測 2023-2028
- 市場機会:製品別
第8章 顧客情勢
- 顧客情勢の概要
第9章 地域別情勢
- 地域別セグメンテーション
- 地域別比較
- 北米:市場規模と予測 2023-2028
- 欧州:市場規模と予測 2023-2028
- アジア:市場規模と予測 2023-2028
- 世界のその他の地域:市場規模と予測 2023-2028
- 米国:市場規模と予測 2023-2028
- 中国:市場規模と予測 2023-2028
- 英国:市場規模と予測 2023-2028
- ドイツ:市場規模と予測 2023-2028
- カナダ:市場規模と予測 2023-2028
- 市場機会:地域情勢別
第10章 促進要因、課題、および動向
- 市場促進要因
- 市場の課題
- 促進要因と課題の影響
- 市場動向
第11章 ベンダー情勢
- 概要
- ベンダー情勢
- 混乱の状況
- 業界のリスク
第12章 ベンダー分析
- 対象ベンダー
- ベンダーの市場ポジショニング
- Allele Biotechnology and Pharmaceuticals Inc.
- Applied Biological Materials Inc.
- Applied StemCell
- ATCC
- Axol Biosciences Ltd.
- Cynata Therapeutics Ltd.
- Evotec SE
- Fate Therapeutics Inc.
- FUJIFILM Corp.
- Hitachi Ltd.
- LIFE and BRAIN GmbH
- Lonza Group Ltd.
- Ncardia Services B.V.
- REPROCELL Inc.
- Takara Bio Inc.
第13章 付録
Exhibits:
- Exhibits1: Executive Summary - Chart on Market Overview
- Exhibits2: Executive Summary - Data Table on Market Overview
- Exhibits3: Executive Summary - Chart on Global Market Characteristics
- Exhibits4: Executive Summary - Chart on Market By Geographical Landscape
- Exhibits5: Executive Summary - Chart on Market Segmentation by End-user
- Exhibits6: Executive Summary - Chart on Market Segmentation by Product
- Exhibits7: Executive Summary - Chart on Incremental Growth
- Exhibits8: Executive Summary - Data Table on Incremental Growth
- Exhibits9: Executive Summary - Chart on Vendor Market Positioning
- Exhibits10: Parent market
- Exhibits11: Market Characteristics
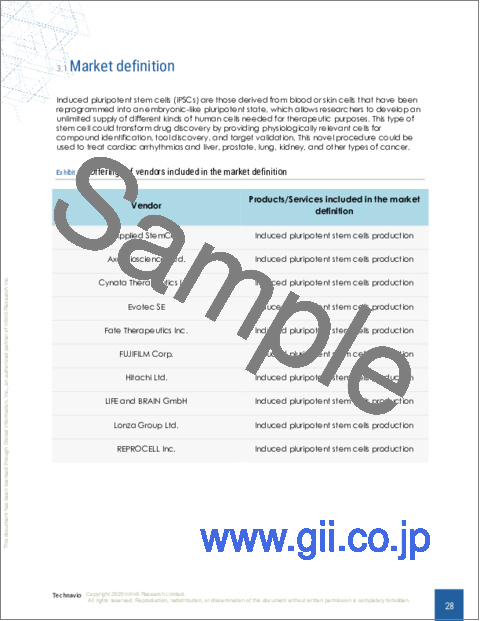
- Exhibits12: Offerings of vendors included in the market definition
- Exhibits13: Market segments
- Exhibits14: Chart on Global - Market size and forecast 2023-2028 ($ million)
- Exhibits15: Data Table on Global - Market size and forecast 2023-2028 ($ million)
- Exhibits16: Chart on Global Market: Year-over-year growth 2023-2028 (%)
- Exhibits17: Data Table on Global Market: Year-over-year growth 2023-2028 (%)
- Exhibits18: Historic Market Size - Data Table on global induced pluripotent stem cells production market 2018 - 2022 ($ million)
- Exhibits19: Historic Market Size - End-user Segment 2018 - 2022 ($ million)
- Exhibits20: Historic Market Size - Product Segment 2018 - 2022 ($ million)
- Exhibits21: Historic Market Size - Geography Segment 2018 - 2022 ($ million)
- Exhibits22: Historic Market Size - Country Segment 2018 - 2022 ($ million)
- Exhibits23: Five forces analysis - Comparison between 2023 and 2028
- Exhibits24: Chart on Bargaining power of buyers - Impact of key factors 2023 and 2028
- Exhibits25: Bargaining power of suppliers - Impact of key factors in 2023 and 2028
- Exhibits26: Threat of new entrants - Impact of key factors in 2023 and 2028
- Exhibits27: Threat of substitutes - Impact of key factors in 2023 and 2028
- Exhibits28: Threat of rivalry - Impact of key factors in 2023 and 2028
- Exhibits29: Chart on Market condition - Five forces 2023 and 2028
- Exhibits30: Chart on End-user - Market share 2023-2028 (%)
- Exhibits31: Data Table on End-user - Market share 2023-2028 (%)
- Exhibits32: Chart on Comparison by End-user
- Exhibits33: Data Table on Comparison by End-user
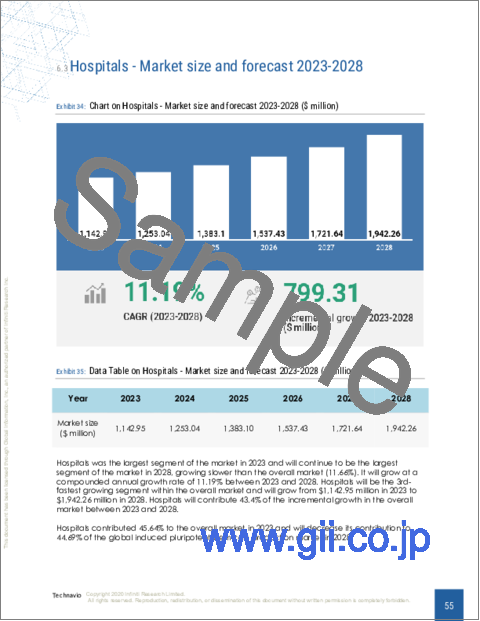
- Exhibits34: Chart on Hospitals - Market size and forecast 2023-2028 ($ million)
- Exhibits35: Data Table on Hospitals - Market size and forecast 2023-2028 ($ million)
- Exhibits36: Chart on Hospitals - Year-over-year growth 2023-2028 (%)
- Exhibits37: Data Table on Hospitals - Year-over-year growth 2023-2028 (%)
- Exhibits38: Chart on Research institutes - Market size and forecast 2023-2028 ($ million)
- Exhibits39: Data Table on Research institutes - Market size and forecast 2023-2028 ($ million)
- Exhibits40: Chart on Research institutes - Year-over-year growth 2023-2028 (%)
- Exhibits41: Data Table on Research institutes - Year-over-year growth 2023-2028 (%)
- Exhibits42: Chart on Biotechnology companies - Market size and forecast 2023-2028 ($ million)
- Exhibits43: Data Table on Biotechnology companies - Market size and forecast 2023-2028 ($ million)
- Exhibits44: Chart on Biotechnology companies - Year-over-year growth 2023-2028 (%)
- Exhibits45: Data Table on Biotechnology companies - Year-over-year growth 2023-2028 (%)
- Exhibits46: Chart on Others - Market size and forecast 2023-2028 ($ million)
- Exhibits47: Data Table on Others - Market size and forecast 2023-2028 ($ million)
- Exhibits48: Chart on Others - Year-over-year growth 2023-2028 (%)
- Exhibits49: Data Table on Others - Year-over-year growth 2023-2028 (%)
- Exhibits50: Market opportunity by End-user ($ million)
- Exhibits51: Data Table on Market opportunity by End-user ($ million)
- Exhibits52: Chart on Product - Market share 2023-2028 (%)
- Exhibits53: Data Table on Product - Market share 2023-2028 (%)
- Exhibits54: Chart on Comparison by Product
- Exhibits55: Data Table on Comparison by Product
- Exhibits56: Chart on Consumable and kits - Market size and forecast 2023-2028 ($ million)
- Exhibits57: Data Table on Consumable and kits - Market size and forecast 2023-2028 ($ million)
- Exhibits58: Chart on Consumable and kits - Year-over-year growth 2023-2028 (%)
- Exhibits59: Data Table on Consumable and kits - Year-over-year growth 2023-2028 (%)
- Exhibits60: Chart on Instrument - Market size and forecast 2023-2028 ($ million)
- Exhibits61: Data Table on Instrument - Market size and forecast 2023-2028 ($ million)
- Exhibits62: Chart on Instrument - Year-over-year growth 2023-2028 (%)
- Exhibits63: Data Table on Instrument - Year-over-year growth 2023-2028 (%)
- Exhibits64: Chart on Services and others - Market size and forecast 2023-2028 ($ million)
- Exhibits65: Data Table on Services and others - Market size and forecast 2023-2028 ($ million)
- Exhibits66: Chart on Services and others - Year-over-year growth 2023-2028 (%)
- Exhibits67: Data Table on Services and others - Year-over-year growth 2023-2028 (%)
- Exhibits68: Market opportunity by Product ($ million)
- Exhibits69: Data Table on Market opportunity by Product ($ million)
- Exhibits70: Analysis of price sensitivity, lifecycle, customer purchase basket, adoption rates, and purchase criteria
- Exhibits71: Chart on Market share By Geographical Landscape 2023-2028 (%)
- Exhibits72: Data Table on Market share By Geographical Landscape 2023-2028 (%)
- Exhibits73: Chart on Geographic comparison
- Exhibits74: Data Table on Geographic comparison
- Exhibits75: Chart on North America - Market size and forecast 2023-2028 ($ million)
- Exhibits76: Data Table on North America - Market size and forecast 2023-2028 ($ million)
- Exhibits77: Chart on North America - Year-over-year growth 2023-2028 (%)
- Exhibits78: Data Table on North America - Year-over-year growth 2023-2028 (%)
- Exhibits79: Chart on Europe - Market size and forecast 2023-2028 ($ million)
- Exhibits80: Data Table on Europe - Market size and forecast 2023-2028 ($ million)
- Exhibits81: Chart on Europe - Year-over-year growth 2023-2028 (%)
- Exhibits82: Data Table on Europe - Year-over-year growth 2023-2028 (%)
- Exhibits83: Chart on Asia - Market size and forecast 2023-2028 ($ million)
- Exhibits84: Data Table on Asia - Market size and forecast 2023-2028 ($ million)
- Exhibits85: Chart on Asia - Year-over-year growth 2023-2028 (%)
- Exhibits86: Data Table on Asia - Year-over-year growth 2023-2028 (%)
- Exhibits87: Chart on Rest of World (ROW) - Market size and forecast 2023-2028 ($ million)
- Exhibits88: Data Table on Rest of World (ROW) - Market size and forecast 2023-2028 ($ million)
- Exhibits89: Chart on Rest of World (ROW) - Year-over-year growth 2023-2028 (%)
- Exhibits90: Data Table on Rest of World (ROW) - Year-over-year growth 2023-2028 (%)
- Exhibits91: Chart on US - Market size and forecast 2023-2028 ($ million)
- Exhibits92: Data Table on US - Market size and forecast 2023-2028 ($ million)
- Exhibits93: Chart on US - Year-over-year growth 2023-2028 (%)
- Exhibits94: Data Table on US - Year-over-year growth 2023-2028 (%)
- Exhibits95: Chart on China - Market size and forecast 2023-2028 ($ million)
- Exhibits96: Data Table on China - Market size and forecast 2023-2028 ($ million)
- Exhibits97: Chart on China - Year-over-year growth 2023-2028 (%)
- Exhibits98: Data Table on China - Year-over-year growth 2023-2028 (%)
- Exhibits99: Chart on UK - Market size and forecast 2023-2028 ($ million)
- Exhibits100: Data Table on UK - Market size and forecast 2023-2028 ($ million)
- Exhibits101: Chart on UK - Year-over-year growth 2023-2028 (%)
- Exhibits102: Data Table on UK - Year-over-year growth 2023-2028 (%)
- Exhibits103: Chart on Germany - Market size and forecast 2023-2028 ($ million)
- Exhibits104: Data Table on Germany - Market size and forecast 2023-2028 ($ million)
- Exhibits105: Chart on Germany - Year-over-year growth 2023-2028 (%)
- Exhibits106: Data Table on Germany - Year-over-year growth 2023-2028 (%)
- Exhibits107: Chart on Canada - Market size and forecast 2023-2028 ($ million)
- Exhibits108: Data Table on Canada - Market size and forecast 2023-2028 ($ million)
- Exhibits109: Chart on Canada - Year-over-year growth 2023-2028 (%)
- Exhibits110: Data Table on Canada - Year-over-year growth 2023-2028 (%)
- Exhibits111: Market opportunity By Geographical Landscape ($ million)
- Exhibits112: Data Tables on Market opportunity By Geographical Landscape ($ million)
- Exhibits113: Impact of drivers and challenges in 2023 and 2028
- Exhibits114: Overview on Criticality of inputs and Factors of differentiation
- Exhibits115: Overview on factors of disruption
- Exhibits116: Impact of key risks on business
- Exhibits117: Vendors covered
- Exhibits118: Matrix on vendor position and classification
- Exhibits119: Allele Biotechnology and Pharmaceuticals Inc. - Overview
- Exhibits120: Allele Biotechnology and Pharmaceuticals Inc. - Product / Service
- Exhibits121: Allele Biotechnology and Pharmaceuticals Inc. - Key offerings
- Exhibits122: Applied Biological Materials Inc. - Overview
- Exhibits123: Applied Biological Materials Inc. - Product / Service
- Exhibits124: Applied Biological Materials Inc. - Key offerings
- Exhibits125: Applied StemCell - Overview
- Exhibits126: Applied StemCell - Product / Service
- Exhibits127: Applied StemCell - Key offerings
- Exhibits128: ATCC - Overview
- Exhibits129: ATCC - Product / Service
- Exhibits130: ATCC - Key offerings
- Exhibits131: Axol Biosciences Ltd. - Overview
- Exhibits132: Axol Biosciences Ltd. - Product / Service
- Exhibits133: Axol Biosciences Ltd. - Key offerings
- Exhibits134: Cynata Therapeutics Ltd. - Overview
- Exhibits135: Cynata Therapeutics Ltd. - Product / Service
- Exhibits136: Cynata Therapeutics Ltd. - Key offerings
- Exhibits137: Evotec SE - Overview
- Exhibits138: Evotec SE - Business segments
- Exhibits139: Evotec SE - Key offerings
- Exhibits140: Evotec SE - Segment focus
- Exhibits141: Fate Therapeutics Inc. - Overview
- Exhibits142: Fate Therapeutics Inc. - Product / Service
- Exhibits143: Fate Therapeutics Inc. - Key offerings
- Exhibits144: FUJIFILM Corp. - Overview
- Exhibits145: FUJIFILM Corp. - Business segments
- Exhibits146: FUJIFILM Corp. - Key news
- Exhibits147: FUJIFILM Corp. - Key offerings
- Exhibits148: FUJIFILM Corp. - Segment focus
- Exhibits149: Hitachi Ltd. - Overview
- Exhibits150: Hitachi Ltd. - Business segments
- Exhibits151: Hitachi Ltd. - Key news
- Exhibits152: Hitachi Ltd. - Key offerings
- Exhibits153: Hitachi Ltd. - Segment focus
- Exhibits154: LIFE and BRAIN GmbH - Overview
- Exhibits155: LIFE and BRAIN GmbH - Product / Service
- Exhibits156: LIFE and BRAIN GmbH - Key offerings
- Exhibits157: Lonza Group Ltd. - Overview
- Exhibits158: Lonza Group Ltd. - Business segments
- Exhibits159: Lonza Group Ltd. - Key news
- Exhibits160: Lonza Group Ltd. - Key offerings
- Exhibits161: Lonza Group Ltd. - Segment focus
- Exhibits162: Ncardia Services B.V. - Overview
- Exhibits163: Ncardia Services B.V. - Product / Service
- Exhibits164: Ncardia Services B.V. - Key offerings
- Exhibits165: REPROCELL Inc. - Overview
- Exhibits166: REPROCELL Inc. - Product / Service
- Exhibits167: REPROCELL Inc. - Key offerings
- Exhibits168: Takara Bio Inc. - Overview
- Exhibits169: Takara Bio Inc. - Product / Service
- Exhibits170: Takara Bio Inc. - Key offerings
- Exhibits171: Inclusions checklist
- Exhibits172: Exclusions checklist
- Exhibits173: Currency conversion rates for US$
- Exhibits174: Research methodology
- Exhibits175: Validation techniques employed for market sizing
- Exhibits176: Information sources
- Exhibits177: List of abbreviations
The induced pluripotent stem cells production market is forecasted to grow by USD 1841.79 mn during 2023-2028, accelerating at a CAGR of 11.66% during the forecast period. The report on the induced pluripotent stem cells production market provides a holistic analysis, market size and forecast, trends, growth drivers, and challenges, as well as vendor analysis covering around 25 vendors.
The report offers an up-to-date analysis regarding the current market scenario, the latest trends and drivers, and the overall market environment. The market is driven by rising prevalence of several chronic disorders, increasing adoption of ipscs in drug discovery and toxicity screening applications, and growing demand for ipscs for personalized medicines.
Technavio's induced pluripotent stem cells production market is segmented as below:
| Market Scope | |
|---|---|
| Base Year | 2024 |
| End Year | 2028 |
| Series Year | 2024-2028 |
| Growth Momentum | Accelerate |
| YOY 2024 | 10.09% |
| CAGR | 11.66% |
| Incremental Value | $1841.79mn |
By End-user
- Hospitals
- Research institutes
- Biotechnology companies
- Others
By Product
- Consumable and kits
- Instrument
- Services and others
By Geographical Landscape
- North America
- Europe
- Asia
- Rest of World (ROW)
This study identifies the advancements in cell reprogramming techniques as one of the prime reasons driving the induced pluripotent stem cells production market growth during the next few years. Also, emergence of ipsc banks and repositories and growing applications of ipscs in regenerative medicine will lead to sizable demand in the market.
The report on the induced pluripotent stem cells production market covers the following areas:
- Induced pluripotent stem cells production market sizing
- Induced pluripotent stem cells production market forecast
- Induced pluripotent stem cells production market industry analysis
The robust vendor analysis is designed to help clients improve their market position, and in line with this, this report provides a detailed analysis of several leading induced pluripotent stem cells production market vendors that include Allele Biotechnology and Pharmaceuticals Inc., ALSTEM, Applied Biological Materials Inc., Applied StemCell, ATCC, Axol Biosciences Ltd., Becton Dickinson and Co., Bio Techne Corp., Board of Regents of the University of Wisconsin System, Creative Biolabs, Cyagen Biosciences, Cynata Therapeutics Ltd., Evotec SE, Fate Therapeutics Inc., FUJIFILM Corp., Hitachi Ltd., LIFE and BRAIN GmbH, Lonza Group Ltd., Ncardia Services B.V., REPROCELL Inc., Sartorius AG, STEMCELL Technologies Inc., Takara Bio Inc., and Thermo Fisher Scientific Inc.. Also, the induced pluripotent stem cells production market analysis report includes information on upcoming trends and challenges that will influence market growth. This is to help companies strategize and leverage all forthcoming growth opportunities.
The study was conducted using an objective combination of primary and secondary information including inputs from key participants in the industry. The report contains a comprehensive market and vendor landscape in addition to an analysis of the key vendors.
The publisher presents a detailed picture of the market by the way of study, synthesis, and summation of data from multiple sources by an analysis of key parameters such as profit, pricing, competition, and promotions. It presents various market facets by identifying the key industry influencers. The data presented is comprehensive, reliable, and a result of extensive research - both primary and secondary. The market research reports provide a complete competitive landscape and an in-depth vendor selection methodology and analysis using qualitative and quantitative research to forecast the accurate market growth.
Table of Contents
1 Executive Summary
- 1.1 Market overview
2 Market Landscape
- 2.1 Market ecosystem
3 Market Sizing
- 3.1 Market definition
- 3.2 Market segment analysis
- 3.3 Market size 2023
- 3.4 Market outlook: Forecast for 2023-2028
4 Historic Market Size
- 4.1 Global induced pluripotent stem cells production market 2018 - 2022
- 4.2 End-user Segment Analysis 2018 - 2022
- 4.3 Product Segment Analysis 2018 - 2022
- 4.4 Geography Segment Analysis 2018 - 2022
- 4.5 Country Segment Analysis 2018 - 2022
5 Five Forces Analysis
- 5.1 Five forces summary
- 5.2 Bargaining power of buyers
- 5.3 Bargaining power of suppliers
- 5.4 Threat of new entrants
- 5.5 Threat of substitutes
- 5.6 Threat of rivalry
- 5.7 Market condition
6 Market Segmentation by End-user
- 6.1 Market segments
- 6.2 Comparison by End-user
- 6.3 Hospitals - Market size and forecast 2023-2028
- 6.4 Research institutes - Market size and forecast 2023-2028
- 6.5 Biotechnology companies - Market size and forecast 2023-2028
- 6.6 Others - Market size and forecast 2023-2028
- 6.7 Market opportunity by End-user
7 Market Segmentation by Product
- 7.1 Market segments
- 7.2 Comparison by Product
- 7.3 Consumable and kits - Market size and forecast 2023-2028
- 7.4 Instrument - Market size and forecast 2023-2028
- 7.5 Services and others - Market size and forecast 2023-2028
- 7.6 Market opportunity by Product
8 Customer Landscape
- 8.1 Customer landscape overview
9 Geographic Landscape
- 9.1 Geographic segmentation
- 9.2 Geographic comparison
- 9.3 North America - Market size and forecast 2023-2028
- 9.4 Europe - Market size and forecast 2023-2028
- 9.5 Asia - Market size and forecast 2023-2028
- 9.6 Rest of World (ROW) - Market size and forecast 2023-2028
- 9.7 US - Market size and forecast 2023-2028
- 9.8 China - Market size and forecast 2023-2028
- 9.9 UK - Market size and forecast 2023-2028
- 9.10 Germany - Market size and forecast 2023-2028
- 9.11 Canada - Market size and forecast 2023-2028
- 9.12 Market opportunity By Geographical Landscape
10 Drivers, Challenges, and Trends
- 10.1 Market drivers
- 10.2 Market challenges
- 10.3 Impact of drivers and challenges
- 10.4 Market trends
11 Vendor Landscape
- 11.1 Overview
- 11.2 Vendor landscape
- 11.3 Landscape disruption
- 11.4 Industry risks
12 Vendor Analysis
- 12.1 Vendors covered
- 12.2 Market positioning of vendors
- 12.3 Allele Biotechnology and Pharmaceuticals Inc.
- 12.4 Applied Biological Materials Inc.
- 12.5 Applied StemCell
- 12.6 ATCC
- 12.7 Axol Biosciences Ltd.
- 12.8 Cynata Therapeutics Ltd.
- 12.9 Evotec SE
- 12.10 Fate Therapeutics Inc.
- 12.11 FUJIFILM Corp.
- 12.12 Hitachi Ltd.
- 12.13 LIFE and BRAIN GmbH
- 12.14 Lonza Group Ltd.
- 12.15 Ncardia Services B.V.
- 12.16 REPROCELL Inc.
- 12.17 Takara Bio Inc.
13 Appendix
- 13.1 Scope of the report
- 13.2 Inclusions and exclusions checklist
- 13.3 Currency conversion rates for US$
- 13.4 Research methodology
- 13.5 List of abbreviations
