|
|
市場調査レポート
商品コード
1459560
アスコルビン酸の世界市場 2024-2028Global Ascorbic Acid Market 2024-2028 |
||||||
|
|||||||
カスタマイズ可能
|
|||||||

| アスコルビン酸の世界市場 2024-2028 |
|
出版日: 2024年03月22日
発行: TechNavio
ページ情報: 英文 177 Pages
納期: 即納可能
|

全表示
- 概要
- 図表
- 目次
アスコルビン酸市場は2023-2028年に3億7,916万米ドル、予測期間中のCAGRは5.16%で成長すると予測されます。
当レポートでは、アスコルビン酸市場の全体的な分析、市場規模・予測、動向、成長促進要因、課題、約25のベンダーを網羅したベンダー分析などを掲載しています。
現在の市場シナリオ、最新動向と促進要因、市場環境全体に関する最新分析を提供しています。ビタミンC欠乏症の増加、アスコルビン酸摂取による健康効果、安定剤と抗酸化食品原料の需要増加が市場を牽引しています。
| 市場範囲 | |
|---|---|
| 基準年 | 2024 |
| 終了年 | 2028 |
| 予測期間 | 2024-2028 |
| 成長モメンタム | 加速 |
| 前年比2024年 | 4.92% |
| CAGR | 5.16% |
| 増分額 | 3億7,916万米ドル |
本調査では、今後数年間のアスコルビン酸市場成長を促進する主な要因の一つとして、植物由来およびビーガン製品への嗜好の高まりを挙げています。また、アスコルビン酸の持続可能な調達と生産へのシフト、アスコルビン酸の生産技術の進歩が市場の大きな需要につながります。
目次
第1章 エグゼクティブサマリー
- 市場概要
第2章 市場情勢
- 市場エコシステム
第3章 市場規模の評価
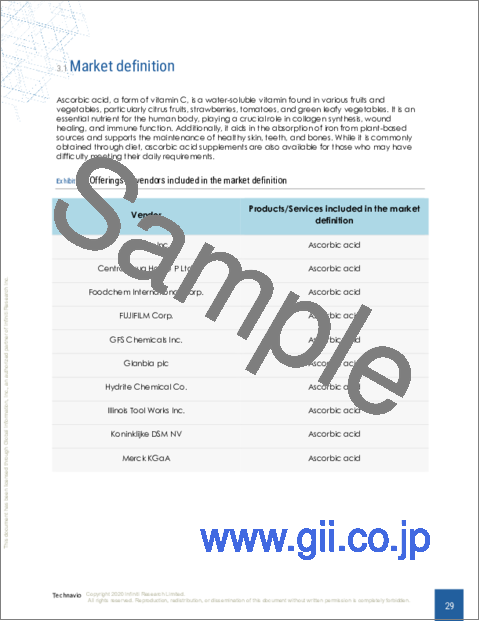
- 市場の定義
- 市場セグメント分析
- 市場規模 2023
- 市場の見通し 2023-2028
第4章 市場規模実績
- アスコルビン酸の世界市場 2018-2022
- バリアントセグメント分析 2018-2022
- エンドユーザーセグメント分析 2018-2022
- 地域別セグメント分析 2018-2022
- 国別セグメント分析 2018-2022
第5章 ファイブフォース分析
- ファイブフォースの要約
- 買い手の交渉力
- 供給企業の交渉力
- 新規参入業者の脅威
- 代替品の脅威
- 競争の脅威
- 市況
第6章 市場セグメンテーションバリアント別
- 市場セグメント
- 比較バリアント別
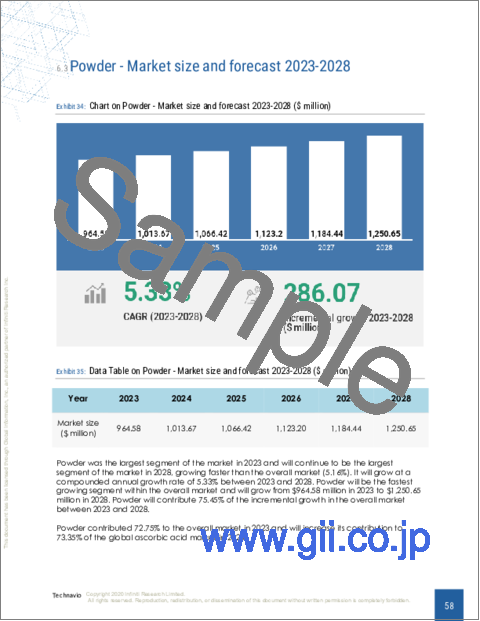
- 粉:市場規模と予測 2023-2028
- 液体:市場規模と予測 2023-2028
- 市場機会バリアント別
第7章 市場セグメンテーション:エンドユーザー別
- 市場セグメント
- 比較:エンドユーザー別
- 製薬:市場規模と予測 2023-2028
- 飲食品:市場規模と予測 2023-2028
- パーソナルケア:市場規模と予測 2023-2028
- その他:市場規模と予測 2023-2028
- 市場機会:エンドユーザー別
第8章 顧客情勢
- 顧客情勢の概要
第9章 地域別情勢
- 地域別セグメンテーション
- 地域別比較
- 欧州:市場規模と予測 2023-2028
- 北米:市場規模と予測 2023-2028
- アジア太平洋:市場規模と予測 2023-2028
- 南米:市場規模と予測 2023-2028
- 中東・アフリカ:市場規模と予測 2023-2028
- 米国:市場規模と予測 2023-2028
- 中国:市場規模と予測 2023-2028
- ドイツ:市場規模と予測 2023-2028
- 英国:市場規模と予測 2023-2028
- 日本:市場規模と予測 2023-2028
- 市場機会:地域別
第10章 促進要因、課題、および動向
- 市場促進要因
- 市場の課題
- 促進要因と課題の影響
- 市場動向
第11章 ベンダー情勢
- 概要
- ベンダー情勢
- 混乱の状況
- 業界のリスク
第12章 ベンダー分析
- 対象ベンダー
- ベンダーの市場ポジショニング
- Avantor Inc
- Central Drug House P Ltd.
- Foodchem International Corp.
- FUJIFILM Corp.
- GFS Chemicals Inc.
- Glanbia plc
- Hydrite Chemical Co.
- Illinois Tool Works Inc.
- Koninklijke DSM NV
- Merck KGaA
- Muby Chemicals
- Otto Chemie Pvt. Ltd.
- Spectrum Laboratory Products Inc.
- Thermo Fisher Scientific Inc.
- Univar Solutions Inc.
第13章 付録
Exhibits:
- Exhibits1: Executive Summary - Chart on Market Overview
- Exhibits2: Executive Summary - Data Table on Market Overview
- Exhibits3: Executive Summary - Chart on Global Market Characteristics
- Exhibits4: Executive Summary - Chart on Market by Geography
- Exhibits5: Executive Summary - Chart on Market Segmentation by Variant
- Exhibits6: Executive Summary - Chart on Market Segmentation by End-user
- Exhibits7: Executive Summary - Chart on Incremental Growth
- Exhibits8: Executive Summary - Data Table on Incremental Growth
- Exhibits9: Executive Summary - Chart on Vendor Market Positioning
- Exhibits10: Parent market
- Exhibits11: Market Characteristics
- Exhibits12: Offerings of vendors included in the market definition
- Exhibits13: Market segments
- Exhibits14: Chart on Global - Market size and forecast 2023-2028 ($ million)
- Exhibits15: Data Table on Global - Market size and forecast 2023-2028 ($ million)
- Exhibits16: Chart on Global Market: Year-over-year growth 2023-2028 (%)
- Exhibits17: Data Table on Global Market: Year-over-year growth 2023-2028 (%)
- Exhibits18: Historic Market Size - Data Table on global ascorbic acid market 2018 - 2022 ($ million)
- Exhibits19: Historic Market Size - Variant Segment 2018 - 2022 ($ million)
- Exhibits20: Historic Market Size - End-user Segment 2018 - 2022 ($ million)
- Exhibits21: Historic Market Size - Geography Segment 2018 - 2022 ($ million)
- Exhibits22: Historic Market Size - Country Segment 2018 - 2022 ($ million)
- Exhibits23: Five forces analysis - Comparison between 2023 and 2028
- Exhibits24: Chart on Bargaining power of buyers - Impact of key factors 2023 and 2028
- Exhibits25: Bargaining power of suppliers - Impact of key factors in 2023 and 2028
- Exhibits26: Threat of new entrants - Impact of key factors in 2023 and 2028
- Exhibits27: Threat of substitutes - Impact of key factors in 2023 and 2028
- Exhibits28: Threat of rivalry - Impact of key factors in 2023 and 2028
- Exhibits29: Chart on Market condition - Five forces 2023 and 2028
- Exhibits30: Chart on Variant - Market share 2023-2028 (%)
- Exhibits31: Data Table on Variant - Market share 2023-2028 (%)
- Exhibits32: Chart on Comparison by Variant
- Exhibits33: Data Table on Comparison by Variant
- Exhibits34: Chart on Powder - Market size and forecast 2023-2028 ($ million)
- Exhibits35: Data Table on Powder - Market size and forecast 2023-2028 ($ million)
- Exhibits36: Chart on Powder - Year-over-year growth 2023-2028 (%)
- Exhibits37: Data Table on Powder - Year-over-year growth 2023-2028 (%)
- Exhibits38: Chart on Liquid - Market size and forecast 2023-2028 ($ million)
- Exhibits39: Data Table on Liquid - Market size and forecast 2023-2028 ($ million)
- Exhibits40: Chart on Liquid - Year-over-year growth 2023-2028 (%)
- Exhibits41: Data Table on Liquid - Year-over-year growth 2023-2028 (%)
- Exhibits42: Market opportunity by Variant ($ million)
- Exhibits43: Data Table on Market opportunity by Variant ($ million)
- Exhibits44: Chart on End-user - Market share 2023-2028 (%)
- Exhibits45: Data Table on End-user - Market share 2023-2028 (%)
- Exhibits46: Chart on Comparison by End-user
- Exhibits47: Data Table on Comparison by End-user
- Exhibits48: Chart on Pharmaceutical - Market size and forecast 2023-2028 ($ million)
- Exhibits49: Data Table on Pharmaceutical - Market size and forecast 2023-2028 ($ million)
- Exhibits50: Chart on Pharmaceutical - Year-over-year growth 2023-2028 (%)
- Exhibits51: Data Table on Pharmaceutical - Year-over-year growth 2023-2028 (%)
- Exhibits52: Chart on Food and beverages - Market size and forecast 2023-2028 ($ million)
- Exhibits53: Data Table on Food and beverages - Market size and forecast 2023-2028 ($ million)
- Exhibits54: Chart on Food and beverages - Year-over-year growth 2023-2028 (%)
- Exhibits55: Data Table on Food and beverages - Year-over-year growth 2023-2028 (%)
- Exhibits56: Chart on Personal care - Market size and forecast 2023-2028 ($ million)
- Exhibits57: Data Table on Personal care - Market size and forecast 2023-2028 ($ million)
- Exhibits58: Chart on Personal care - Year-over-year growth 2023-2028 (%)
- Exhibits59: Data Table on Personal care - Year-over-year growth 2023-2028 (%)
- Exhibits60: Chart on Others - Market size and forecast 2023-2028 ($ million)
- Exhibits61: Data Table on Others - Market size and forecast 2023-2028 ($ million)
- Exhibits62: Chart on Others - Year-over-year growth 2023-2028 (%)
- Exhibits63: Data Table on Others - Year-over-year growth 2023-2028 (%)
- Exhibits64: Market opportunity by End-user ($ million)
- Exhibits65: Data Table on Market opportunity by End-user ($ million)
- Exhibits66: Analysis of price sensitivity, lifecycle, customer purchase basket, adoption rates, and purchase criteria
- Exhibits67: Chart on Market share by geography 2023-2028 (%)
- Exhibits68: Data Table on Market share by geography 2023-2028 (%)
- Exhibits69: Chart on Geographic comparison
- Exhibits70: Data Table on Geographic comparison
- Exhibits71: Chart on Europe - Market size and forecast 2023-2028 ($ million)
- Exhibits72: Data Table on Europe - Market size and forecast 2023-2028 ($ million)
- Exhibits73: Chart on Europe - Year-over-year growth 2023-2028 (%)
- Exhibits74: Data Table on Europe - Year-over-year growth 2023-2028 (%)
- Exhibits75: Chart on North America - Market size and forecast 2023-2028 ($ million)
- Exhibits76: Data Table on North America - Market size and forecast 2023-2028 ($ million)
- Exhibits77: Chart on North America - Year-over-year growth 2023-2028 (%)
- Exhibits78: Data Table on North America - Year-over-year growth 2023-2028 (%)
- Exhibits79: Chart on APAC - Market size and forecast 2023-2028 ($ million)
- Exhibits80: Data Table on APAC - Market size and forecast 2023-2028 ($ million)
- Exhibits81: Chart on APAC - Year-over-year growth 2023-2028 (%)
- Exhibits82: Data Table on APAC - Year-over-year growth 2023-2028 (%)
- Exhibits83: Chart on South America - Market size and forecast 2023-2028 ($ million)
- Exhibits84: Data Table on South America - Market size and forecast 2023-2028 ($ million)
- Exhibits85: Chart on South America - Year-over-year growth 2023-2028 (%)
- Exhibits86: Data Table on South America - Year-over-year growth 2023-2028 (%)
- Exhibits87: Chart on Middle East and Africa - Market size and forecast 2023-2028 ($ million)
- Exhibits88: Data Table on Middle East and Africa - Market size and forecast 2023-2028 ($ million)
- Exhibits89: Chart on Middle East and Africa - Year-over-year growth 2023-2028 (%)
- Exhibits90: Data Table on Middle East and Africa - Year-over-year growth 2023-2028 (%)
- Exhibits91: Chart on US - Market size and forecast 2023-2028 ($ million)
- Exhibits92: Data Table on US - Market size and forecast 2023-2028 ($ million)
- Exhibits93: Chart on US - Year-over-year growth 2023-2028 (%)
- Exhibits94: Data Table on US - Year-over-year growth 2023-2028 (%)
- Exhibits95: Chart on China - Market size and forecast 2023-2028 ($ million)
- Exhibits96: Data Table on China - Market size and forecast 2023-2028 ($ million)
- Exhibits97: Chart on China - Year-over-year growth 2023-2028 (%)
- Exhibits98: Data Table on China - Year-over-year growth 2023-2028 (%)
- Exhibits99: Chart on Germany - Market size and forecast 2023-2028 ($ million)
- Exhibits100: Data Table on Germany - Market size and forecast 2023-2028 ($ million)
- Exhibits101: Chart on Germany - Year-over-year growth 2023-2028 (%)
- Exhibits102: Data Table on Germany - Year-over-year growth 2023-2028 (%)
- Exhibits103: Chart on UK - Market size and forecast 2023-2028 ($ million)
- Exhibits104: Data Table on UK - Market size and forecast 2023-2028 ($ million)
- Exhibits105: Chart on UK - Year-over-year growth 2023-2028 (%)
- Exhibits106: Data Table on UK - Year-over-year growth 2023-2028 (%)
- Exhibits107: Chart on Japan - Market size and forecast 2023-2028 ($ million)
- Exhibits108: Data Table on Japan - Market size and forecast 2023-2028 ($ million)
- Exhibits109: Chart on Japan - Year-over-year growth 2023-2028 (%)
- Exhibits110: Data Table on Japan - Year-over-year growth 2023-2028 (%)
- Exhibits111: Market opportunity by geography ($ million)
- Exhibits112: Data Tables on Market opportunity by geography ($ million)
- Exhibits113: Impact of drivers and challenges in 2023 and 2028
- Exhibits114: Overview on Criticality of inputs and Factors of differentiation
- Exhibits115: Overview on factors of disruption
- Exhibits116: Impact of key risks on business
- Exhibits117: Vendors covered
- Exhibits118: Matrix on vendor position and classification
- Exhibits119: Avantor Inc - Overview
- Exhibits120: Avantor Inc - Business segments
- Exhibits121: Avantor Inc - Key news
- Exhibits122: Avantor Inc - Key offerings
- Exhibits123: Avantor Inc - Segment focus
- Exhibits124: Central Drug House P Ltd. - Overview
- Exhibits125: Central Drug House P Ltd. - Product / Service
- Exhibits126: Central Drug House P Ltd. - Key offerings
- Exhibits127: Foodchem International Corp. - Overview
- Exhibits128: Foodchem International Corp. - Product / Service
- Exhibits129: Foodchem International Corp. - Key offerings
- Exhibits130: FUJIFILM Corp. - Overview
- Exhibits131: FUJIFILM Corp. - Business segments
- Exhibits132: FUJIFILM Corp. - Key news
- Exhibits133: FUJIFILM Corp. - Key offerings
- Exhibits134: FUJIFILM Corp. - Segment focus
- Exhibits135: GFS Chemicals Inc. - Overview
- Exhibits136: GFS Chemicals Inc. - Product / Service
- Exhibits137: GFS Chemicals Inc. - Key offerings
- Exhibits138: Glanbia plc - Overview
- Exhibits139: Glanbia plc - Business segments
- Exhibits140: Glanbia plc - Key news
- Exhibits141: Glanbia plc - Key offerings
- Exhibits142: Glanbia plc - Segment focus
- Exhibits143: Hydrite Chemical Co. - Overview
- Exhibits144: Hydrite Chemical Co. - Product / Service
- Exhibits145: Hydrite Chemical Co. - Key offerings
- Exhibits146: Illinois Tool Works Inc. - Overview
- Exhibits147: Illinois Tool Works Inc. - Business segments
- Exhibits148: Illinois Tool Works Inc. - Key news
- Exhibits149: Illinois Tool Works Inc. - Key offerings
- Exhibits150: Illinois Tool Works Inc. - Segment focus
- Exhibits151: Koninklijke DSM NV - Overview
- Exhibits152: Koninklijke DSM NV - Business segments
- Exhibits153: Koninklijke DSM NV - Key news
- Exhibits154: Koninklijke DSM NV - Key offerings
- Exhibits155: Koninklijke DSM NV - Segment focus
- Exhibits156: Merck KGaA - Overview
- Exhibits157: Merck KGaA - Business segments
- Exhibits158: Merck KGaA - Key news
- Exhibits159: Merck KGaA - Key offerings
- Exhibits160: Merck KGaA - Segment focus
- Exhibits161: Muby Chemicals - Overview
- Exhibits162: Muby Chemicals - Product / Service
- Exhibits163: Muby Chemicals - Key offerings
- Exhibits164: Otto Chemie Pvt. Ltd. - Overview
- Exhibits165: Otto Chemie Pvt. Ltd. - Product / Service
- Exhibits166: Otto Chemie Pvt. Ltd. - Key offerings
- Exhibits167: Spectrum Laboratory Products Inc. - Overview
- Exhibits168: Spectrum Laboratory Products Inc. - Product / Service
- Exhibits169: Spectrum Laboratory Products Inc. - Key offerings
- Exhibits170: Thermo Fisher Scientific Inc. - Overview
- Exhibits171: Thermo Fisher Scientific Inc. - Business segments
- Exhibits172: Thermo Fisher Scientific Inc. - Key news
- Exhibits173: Thermo Fisher Scientific Inc. - Key offerings
- Exhibits174: Thermo Fisher Scientific Inc. - Segment focus
- Exhibits175: Univar Solutions Inc. - Overview
- Exhibits176: Univar Solutions Inc. - Business segments
- Exhibits177: Univar Solutions Inc. - Key offerings
- Exhibits178: Univar Solutions Inc. - Segment focus
- Exhibits179: Inclusions checklist
- Exhibits180: Exclusions checklist
- Exhibits181: Currency conversion rates for US$
- Exhibits182: Research methodology
- Exhibits183: Validation techniques employed for market sizing
- Exhibits184: Information sources
- Exhibits185: List of abbreviations
The ascorbic acid market is forecasted to grow by USD 379.16 mn during 2023-2028, accelerating at a CAGR of 5.16% during the forecast period. The report on the ascorbic acid market provides a holistic analysis, market size and forecast, trends, growth drivers, and challenges, as well as vendor analysis covering around 25 vendors.
The report offers an up-to-date analysis regarding the current market scenario, the latest trends and drivers, and the overall market environment. The market is driven by increasing prevalence of vitamin c deficiency, health benefits of consuming ascorbic acid, and rise in demand for stabilizers and antioxidant food ingredients.
Technavio's ascorbic acid market is segmented as below:
| Market Scope | |
|---|---|
| Base Year | 2024 |
| End Year | 2028 |
| Series Year | 2024-2028 |
| Growth Momentum | Accelerate |
| YOY 2024 | 4.92% |
| CAGR | 5.16% |
| Incremental Value | $379.16mn |
By Variant
- Powder
- Liquid
By End-user
- Pharmaceutical
- Food and beverages
- Personal care
- Others
By Geography
- Europe
- North America
- APAC
- South America
- Middle East and Africa
This study identifies the growing preference for plant-based and vegan products as one of the prime reasons driving the ascorbic acid market growth during the next few years. Also, shift towards sustainable sourcing and production of ascorbic acid and advancements in production technologies of ascorbic acid will lead to sizable demand in the market.
The report on the ascorbic acid market covers the following areas:
- Ascorbic acid market sizing
- Ascorbic acid market forecast
- Ascorbic acid market industry analysis
The robust vendor analysis is designed to help clients improve their market position, and in line with this, this report provides a detailed analysis of several leading ascorbic acid market vendors that include Anhui Elite Industrial Co. ltd., Ases Chemical Works, Avantor Inc, Blagden Specialty Chemicals Ltd., Central Drug House P Ltd., Foodchem International Corp., FUJIFILM Corp., GFS Chemicals Inc., Glanbia plc, Global Calcium Pvt. Ltd., Hydrite Chemical Co., Illinois Tool Works Inc., Koninklijke DSM NV, Luwei Pharmaceutical Group Co. Ltd., Medisca Inc., Merck KGaA, Muby Chemicals, Northeast Pharmaceutical Group Co. Ltd., Otto Chemie Pvt. Ltd., Reckon Organics Private Ltd., Spectrum Laboratory Products Inc., Thermo Fisher Scientific Inc., Univar Solutions Inc., and PHARMAVIT ApS. Also, the ascorbic acid market analysis report includes information on upcoming trends and challenges that will influence market growth. This is to help companies strategize and leverage all forthcoming growth opportunities.
The study was conducted using an objective combination of primary and secondary information including inputs from key participants in the industry. The report contains a comprehensive market and vendor landscape in addition to an analysis of the key vendors.
The publisher presents a detailed picture of the market by the way of study, synthesis, and summation of data from multiple sources by an analysis of key parameters such as profit, pricing, competition, and promotions. It presents various market facets by identifying the key industry influencers. The data presented is comprehensive, reliable, and a result of extensive research - both primary and secondary. The market research reports provide a complete competitive landscape and an in-depth vendor selection methodology and analysis using qualitative and quantitative research to forecast the accurate market growth.
Table of Contents
1 Executive Summary
- 1.1 Market overview
2 Market Landscape
- 2.1 Market ecosystem
3 Market Sizing
- 3.1 Market definition
- 3.2 Market segment analysis
- 3.3 Market size 2023
- 3.4 Market outlook: Forecast for 2023-2028
4 Historic Market Size
- 4.1 Global ascorbic acid market 2018 - 2022
- 4.2 Variant Segment Analysis 2018 - 2022
- 4.3 End-user Segment Analysis 2018 - 2022
- 4.4 Geography Segment Analysis 2018 - 2022
- 4.5 Country Segment Analysis 2018 - 2022
5 Five Forces Analysis
- 5.1 Five forces summary
- 5.2 Bargaining power of buyers
- 5.3 Bargaining power of suppliers
- 5.4 Threat of new entrants
- 5.5 Threat of substitutes
- 5.6 Threat of rivalry
- 5.7 Market condition
6 Market Segmentation by Variant
- 6.1 Market segments
- 6.2 Comparison by Variant
- 6.3 Powder - Market size and forecast 2023-2028
- 6.4 Liquid - Market size and forecast 2023-2028
- 6.5 Market opportunity by Variant
7 Market Segmentation by End-user
- 7.1 Market segments
- 7.2 Comparison by End-user
- 7.3 Pharmaceutical - Market size and forecast 2023-2028
- 7.4 Food and beverages - Market size and forecast 2023-2028
- 7.5 Personal care - Market size and forecast 2023-2028
- 7.6 Others - Market size and forecast 2023-2028
- 7.7 Market opportunity by End-user
8 Customer Landscape
- 8.1 Customer landscape overview
9 Geographic Landscape
- 9.1 Geographic segmentation
- 9.2 Geographic comparison
- 9.3 Europe - Market size and forecast 2023-2028
- 9.4 North America - Market size and forecast 2023-2028
- 9.5 APAC - Market size and forecast 2023-2028
- 9.6 South America - Market size and forecast 2023-2028
- 9.7 Middle East and Africa - Market size and forecast 2023-2028
- 9.8 US - Market size and forecast 2023-2028
- 9.9 China - Market size and forecast 2023-2028
- 9.10 Germany - Market size and forecast 2023-2028
- 9.11 UK - Market size and forecast 2023-2028
- 9.12 Japan - Market size and forecast 2023-2028
- 9.13 Market opportunity by geography
10 Drivers, Challenges, and Trends
- 10.1 Market drivers
- 10.2 Market challenges
- 10.3 Impact of drivers and challenges
- 10.4 Market trends
11 Vendor Landscape
- 11.1 Overview
- 11.2 Vendor landscape
- 11.3 Landscape disruption
- 11.4 Industry risks
12 Vendor Analysis
- 12.1 Vendors covered
- 12.2 Market positioning of vendors
- 12.3 Avantor Inc
- 12.4 Central Drug House P Ltd.
- 12.5 Foodchem International Corp.
- 12.6 FUJIFILM Corp.
- 12.7 GFS Chemicals Inc.
- 12.8 Glanbia plc
- 12.9 Hydrite Chemical Co.
- 12.10 Illinois Tool Works Inc.
- 12.11 Koninklijke DSM NV
- 12.12 Merck KGaA
- 12.13 Muby Chemicals
- 12.14 Otto Chemie Pvt. Ltd.
- 12.15 Spectrum Laboratory Products Inc.
- 12.16 Thermo Fisher Scientific Inc.
- 12.17 Univar Solutions Inc.
13 Appendix
- 13.1 Scope of the report
- 13.2 Inclusions and exclusions checklist
- 13.3 Currency conversion rates for US$
- 13.4 Research methodology
- 13.5 List of abbreviations

