|
|
市場調査レポート
商品コード
1459539
記録用チャート紙の世界市場 2024-2028Global Recording Chart Paper Market 2024-2028 |
||||||
|
|||||||
カスタマイズ可能
|
|||||||


| 記録用チャート紙の世界市場 2024-2028 |
|
出版日: 2024年03月21日
発行: TechNavio
ページ情報: 英文 154 Pages
納期: 即納可能
|

全表示
- 概要
- 図表
- 目次
記録用チャート紙市場は2023-2028年に7億5,371万米ドル、予測期間中のCAGRは6.01%で成長すると予測されます。
当レポートでは、記録用チャート紙市場の全体的な分析、市場規模・予測、動向、成長促進要因、課題、約25のベンダーを網羅したベンダー分析などを掲載しています。
現在の市場シナリオ、最新動向と促進要因、市場環境全体に関する最新分析を提供しています。市場は、様々な産業における自動化システムの導入の増加、ヘルスケア支出の増加、慢性疾患の有病率の上昇によって牽引されています。
| 市場範囲 | |
|---|---|
| 基準年 | 2024 |
| 終了年 | 2028 |
| 予測期間 | 2024-2028 |
| 成長モメンタム | 加速 |
| 前年比2024年 | 5.39% |
| CAGR | 6.01% |
| 増分額 | 7億5,371万米ドル |
本調査では、今後数年間の記録用チャート紙市場成長を牽引する主要因の1つとして、デジタルヘルスケアサービスの導入拡大を挙げています。また、記録用チャート紙と遠隔医療プラットフォームとの統合や、患者中心のケアモデルへの注目が高まっていることも、同市場の大きな需要につながると思われます。
目次
第1章 エグゼクティブサマリー
- 市場概要
第2章 市場情勢
- 市場エコシステム
第3章 市場規模の評価
- 市場の定義
- 市場セグメント分析
- 市場規模 2023
- 市場の見通し 2023-2028
第4章 市場規模実績
- 記録用チャート紙の世界市場 2018-2022
- 用途別セグメント分析 2018-2022
- タイプセグメント分析 2018-2022
- 地域別セグメント分析 2018-2022
- 国別セグメント分析 2018-2022
第5章 ファイブフォース分析
- ファイブフォースの要約
- 買い手の交渉力
- 供給企業の交渉力
- 新規参入業者の脅威
- 代替品の脅威
- 競争の脅威
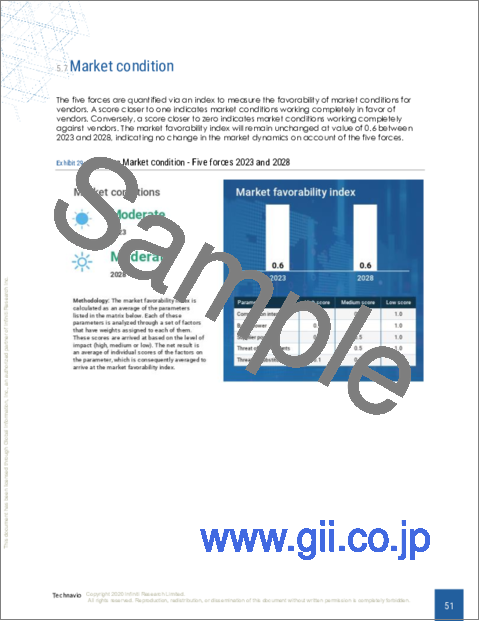
- 市況
第6章 市場セグメンテーション:用途別
- 市場セグメント
- 比較:用途別
- 病院:市場規模と予測 2023-2028
- 診断センター:市場規模と予測 2023-2028
- クリニック:市場規模と予測 2023-2028
- 市場機会:用途別
第7章 市場セグメンテーション:タイプ別
- 市場セグメント
- 比較:タイプ別
- 心臓病モニタリング記録:市場規模と予測 2023-2028
- 外来およびEMS記録:市場規模と予測 2023-2028
- 超音波検査と産婦人科記録:市場規模と予測 2023-2028
- 胎児モニタリング記録:市場規模と予測 2023-2028
- 市場機会:タイプ別
第8章 顧客情勢
- 顧客情勢の概要
第9章 地域別情勢
- 地域別セグメンテーション
- 地域別比較
- 北米:市場規模と予測 2023-2028
- 欧州:市場規模と予測 2023-2028
- アジア:市場規模と予測 2023-2028
- 世界のその他の地域:市場規模と予測 2023-2028
- 米国:市場規模と予測 2023-2028
- 英国:市場規模と予測 2023-2028
- 中国:市場規模と予測 2023-2028
- ドイツ:市場規模と予測 2023-2028
- カナダ:市場規模と予測 2023-2028
- 市場機会:地域別
第10章 促進要因、課題、および動向
- 市場促進要因
- 市場の課題
- 促進要因と課題の影響
- 市場動向
第11章 ベンダー情勢
- 概要
- ベンダー情勢
- 混乱の状況
- 業界のリスク
第12章 ベンダー分析
- 対象ベンダー
- ベンダーの市場ポジショニング
- Avantor Inc
- Cardinal Health Inc.
- CompareNetworks Inc.
- Dickson Inc.
- GeoCorp Inc.
- Honeywell International Inc.
- Merck KGaA
- Precision Charts Inc.
- Shandong Ultra Paper Co. Ltd.
- Thermo Fisher Scientific Inc.
- Yokogawa Electric Corp.
第13章 付録
Exhibits:
- Exhibits1: Executive Summary - Chart on Market Overview
- Exhibits2: Executive Summary - Data Table on Market Overview
- Exhibits3: Executive Summary - Chart on Global Market Characteristics
- Exhibits4: Executive Summary - Chart on Market by Geography
- Exhibits5: Executive Summary - Chart on Market Segmentation by Application
- Exhibits6: Executive Summary - Chart on Market Segmentation by Type
- Exhibits7: Executive Summary - Chart on Incremental Growth
- Exhibits8: Executive Summary - Data Table on Incremental Growth
- Exhibits9: Executive Summary - Chart on Vendor Market Positioning
- Exhibits10: Parent market
- Exhibits11: Market Characteristics
- Exhibits12: Offerings of vendors included in the market definition
- Exhibits13: Market segments
- Exhibits14: Chart on Global - Market size and forecast 2023-2028 ($ million)
- Exhibits15: Data Table on Global - Market size and forecast 2023-2028 ($ million)
- Exhibits16: Chart on Global Market: Year-over-year growth 2023-2028 (%)
- Exhibits17: Data Table on Global Market: Year-over-year growth 2023-2028 (%)
- Exhibits18: Historic Market Size - Data Table on global recording chart paper market 2018 - 2022 ($ million)
- Exhibits19: Historic Market Size - Application Segment 2018 - 2022 ($ million)
- Exhibits20: Historic Market Size - Type Segment 2018 - 2022 ($ million)
- Exhibits21: Historic Market Size - Geography Segment 2018 - 2022 ($ million)
- Exhibits22: Historic Market Size - Country Segment 2018 - 2022 ($ million)
- Exhibits23: Five forces analysis - Comparison between 2023 and 2028
- Exhibits24: Chart on Bargaining power of buyers - Impact of key factors 2023 and 2028
- Exhibits25: Bargaining power of suppliers - Impact of key factors in 2023 and 2028
- Exhibits26: Threat of new entrants - Impact of key factors in 2023 and 2028
- Exhibits27: Threat of substitutes - Impact of key factors in 2023 and 2028
- Exhibits28: Threat of rivalry - Impact of key factors in 2023 and 2028
- Exhibits29: Chart on Market condition - Five forces 2023 and 2028
- Exhibits30: Chart on Application - Market share 2023-2028 (%)
- Exhibits31: Data Table on Application - Market share 2023-2028 (%)
- Exhibits32: Chart on Comparison by Application
- Exhibits33: Data Table on Comparison by Application
- Exhibits34: Chart on Hospitals - Market size and forecast 2023-2028 ($ million)
- Exhibits35: Data Table on Hospitals - Market size and forecast 2023-2028 ($ million)
- Exhibits36: Chart on Hospitals - Year-over-year growth 2023-2028 (%)
- Exhibits37: Data Table on Hospitals - Year-over-year growth 2023-2028 (%)
- Exhibits38: Chart on Diagnostic centers - Market size and forecast 2023-2028 ($ million)
- Exhibits39: Data Table on Diagnostic centers - Market size and forecast 2023-2028 ($ million)
- Exhibits40: Chart on Diagnostic centers - Year-over-year growth 2023-2028 (%)
- Exhibits41: Data Table on Diagnostic centers - Year-over-year growth 2023-2028 (%)
- Exhibits42: Chart on Clinics - Market size and forecast 2023-2028 ($ million)
- Exhibits43: Data Table on Clinics - Market size and forecast 2023-2028 ($ million)
- Exhibits44: Chart on Clinics - Year-over-year growth 2023-2028 (%)
- Exhibits45: Data Table on Clinics - Year-over-year growth 2023-2028 (%)
- Exhibits46: Market opportunity by Application ($ million)
- Exhibits47: Data Table on Market opportunity by Application ($ million)
- Exhibits48: Chart on Type - Market share 2023-2028 (%)
- Exhibits49: Data Table on Type - Market share 2023-2028 (%)
- Exhibits50: Chart on Comparison by Type
- Exhibits51: Data Table on Comparison by Type
- Exhibits52: Chart on Cardiology monitoring recording - Market size and forecast 2023-2028 ($ million)
- Exhibits53: Data Table on Cardiology monitoring recording - Market size and forecast 2023-2028 ($ million)
- Exhibits54: Chart on Cardiology monitoring recording - Year-over-year growth 2023-2028 (%)
- Exhibits55: Data Table on Cardiology monitoring recording - Year-over-year growth 2023-2028 (%)
- Exhibits56: Chart on Ambulatory and EMS recording - Market size and forecast 2023-2028 ($ million)
- Exhibits57: Data Table on Ambulatory and EMS recording - Market size and forecast 2023-2028 ($ million)
- Exhibits58: Chart on Ambulatory and EMS recording - Year-over-year growth 2023-2028 (%)
- Exhibits59: Data Table on Ambulatory and EMS recording - Year-over-year growth 2023-2028 (%)
- Exhibits60: Chart on Ultrasound and OB-GYN recording - Market size and forecast 2023-2028 ($ million)
- Exhibits61: Data Table on Ultrasound and OB-GYN recording - Market size and forecast 2023-2028 ($ million)
- Exhibits62: Chart on Ultrasound and OB-GYN recording - Year-over-year growth 2023-2028 (%)
- Exhibits63: Data Table on Ultrasound and OB-GYN recording - Year-over-year growth 2023-2028 (%)
- Exhibits64: Chart on Fetal monitoring recording - Market size and forecast 2023-2028 ($ million)
- Exhibits65: Data Table on Fetal monitoring recording - Market size and forecast 2023-2028 ($ million)
- Exhibits66: Chart on Fetal monitoring recording - Year-over-year growth 2023-2028 (%)
- Exhibits67: Data Table on Fetal monitoring recording - Year-over-year growth 2023-2028 (%)
- Exhibits68: Market opportunity by Type ($ million)
- Exhibits69: Data Table on Market opportunity by Type ($ million)
- Exhibits70: Analysis of price sensitivity, lifecycle, customer purchase basket, adoption rates, and purchase criteria
- Exhibits71: Chart on Market share by geography 2023-2028 (%)
- Exhibits72: Data Table on Market share by geography 2023-2028 (%)
- Exhibits73: Chart on Geographic comparison
- Exhibits74: Data Table on Geographic comparison
- Exhibits75: Chart on North America - Market size and forecast 2023-2028 ($ million)
- Exhibits76: Data Table on North America - Market size and forecast 2023-2028 ($ million)
- Exhibits77: Chart on North America - Year-over-year growth 2023-2028 (%)
- Exhibits78: Data Table on North America - Year-over-year growth 2023-2028 (%)
- Exhibits79: Chart on Europe - Market size and forecast 2023-2028 ($ million)
- Exhibits80: Data Table on Europe - Market size and forecast 2023-2028 ($ million)
- Exhibits81: Chart on Europe - Year-over-year growth 2023-2028 (%)
- Exhibits82: Data Table on Europe - Year-over-year growth 2023-2028 (%)
- Exhibits83: Chart on Asia - Market size and forecast 2023-2028 ($ million)
- Exhibits84: Data Table on Asia - Market size and forecast 2023-2028 ($ million)
- Exhibits85: Chart on Asia - Year-over-year growth 2023-2028 (%)
- Exhibits86: Data Table on Asia - Year-over-year growth 2023-2028 (%)
- Exhibits87: Chart on Rest of World (ROW) - Market size and forecast 2023-2028 ($ million)
- Exhibits88: Data Table on Rest of World (ROW) - Market size and forecast 2023-2028 ($ million)
- Exhibits89: Chart on Rest of World (ROW) - Year-over-year growth 2023-2028 (%)
- Exhibits90: Data Table on Rest of World (ROW) - Year-over-year growth 2023-2028 (%)
- Exhibits91: Chart on US - Market size and forecast 2023-2028 ($ million)
- Exhibits92: Data Table on US - Market size and forecast 2023-2028 ($ million)
- Exhibits93: Chart on US - Year-over-year growth 2023-2028 (%)
- Exhibits94: Data Table on US - Year-over-year growth 2023-2028 (%)
- Exhibits95: Chart on UK - Market size and forecast 2023-2028 ($ million)
- Exhibits96: Data Table on UK - Market size and forecast 2023-2028 ($ million)
- Exhibits97: Chart on UK - Year-over-year growth 2023-2028 (%)
- Exhibits98: Data Table on UK - Year-over-year growth 2023-2028 (%)
- Exhibits99: Chart on China - Market size and forecast 2023-2028 ($ million)
- Exhibits100: Data Table on China - Market size and forecast 2023-2028 ($ million)
- Exhibits101: Chart on China - Year-over-year growth 2023-2028 (%)
- Exhibits102: Data Table on China - Year-over-year growth 2023-2028 (%)
- Exhibits103: Chart on Germany - Market size and forecast 2023-2028 ($ million)
- Exhibits104: Data Table on Germany - Market size and forecast 2023-2028 ($ million)
- Exhibits105: Chart on Germany - Year-over-year growth 2023-2028 (%)
- Exhibits106: Data Table on Germany - Year-over-year growth 2023-2028 (%)
- Exhibits107: Chart on Canada - Market size and forecast 2023-2028 ($ million)
- Exhibits108: Data Table on Canada - Market size and forecast 2023-2028 ($ million)
- Exhibits109: Chart on Canada - Year-over-year growth 2023-2028 (%)
- Exhibits110: Data Table on Canada - Year-over-year growth 2023-2028 (%)
- Exhibits111: Market opportunity by geography ($ million)
- Exhibits112: Data Tables on Market opportunity by geography ($ million)
- Exhibits113: Impact of drivers and challenges in 2023 and 2028
- Exhibits114: Overview on Criticality of inputs and Factors of differentiation
- Exhibits115: Overview on factors of disruption
- Exhibits116: Impact of key risks on business
- Exhibits117: Vendors covered
- Exhibits118: Matrix on vendor position and classification
- Exhibits119: Avantor Inc - Overview
- Exhibits120: Avantor Inc - Business segments
- Exhibits121: Avantor Inc - Key news
- Exhibits122: Avantor Inc - Key offerings
- Exhibits123: Avantor Inc - Segment focus
- Exhibits124: Cardinal Health Inc. - Overview
- Exhibits125: Cardinal Health Inc. - Business segments
- Exhibits126: Cardinal Health Inc. - Key offerings
- Exhibits127: Cardinal Health Inc. - Segment focus
- Exhibits128: CompareNetworks Inc. - Overview
- Exhibits129: CompareNetworks Inc. - Product / Service
- Exhibits130: CompareNetworks Inc. - Key offerings
- Exhibits131: Dickson Inc. - Overview
- Exhibits132: Dickson Inc. - Product / Service
- Exhibits133: Dickson Inc. - Key offerings
- Exhibits134: GeoCorp Inc. - Overview
- Exhibits135: GeoCorp Inc. - Product / Service
- Exhibits136: GeoCorp Inc. - Key offerings
- Exhibits137: Honeywell International Inc. - Overview
- Exhibits138: Honeywell International Inc. - Business segments
- Exhibits139: Honeywell International Inc. - Key news
- Exhibits140: Honeywell International Inc. - Key offerings
- Exhibits141: Honeywell International Inc. - Segment focus
- Exhibits142: Merck KGaA - Overview
- Exhibits143: Merck KGaA - Business segments
- Exhibits144: Merck KGaA - Key news
- Exhibits145: Merck KGaA - Key offerings
- Exhibits146: Merck KGaA - Segment focus
- Exhibits147: Precision Charts Inc. - Overview
- Exhibits148: Precision Charts Inc. - Product / Service
- Exhibits149: Precision Charts Inc. - Key offerings
- Exhibits150: Shandong Ultra Paper Co. Ltd. - Overview
- Exhibits151: Shandong Ultra Paper Co. Ltd. - Key offerings
- Exhibits152: Thermo Fisher Scientific Inc. - Overview
- Exhibits153: Thermo Fisher Scientific Inc. - Business segments
- Exhibits154: Thermo Fisher Scientific Inc. - Key news
- Exhibits155: Thermo Fisher Scientific Inc. - Key offerings
- Exhibits156: Thermo Fisher Scientific Inc. - Segment focus
- Exhibits157: Yokogawa Electric Corp. - Overview
- Exhibits158: Yokogawa Electric Corp. - Business segments
- Exhibits159: Yokogawa Electric Corp. - Key offerings
- Exhibits160: Yokogawa Electric Corp. - Segment focus
- Exhibits161: Inclusions checklist
- Exhibits162: Exclusions checklist
- Exhibits163: Currency conversion rates for US$
- Exhibits164: Research methodology
- Exhibits165: Validation techniques employed for market sizing
- Exhibits166: Information sources
- Exhibits167: List of abbreviations
The recording chart paper market is forecasted to grow by USD 753.71 mn during 2023-2028, accelerating at a CAGR of 6.01% during the forecast period. The report on the recording chart paper market provides a holistic analysis, market size and forecast, trends, growth drivers, and challenges, as well as vendor analysis covering around 25 vendors.
The report offers an up-to-date analysis regarding the current market scenario, the latest trends and drivers, and the overall market environment. The market is driven by the increasing adoption of automated systems across various industries, growing healthcare expenditure, and a rise in the prevalence of chronic diseases.
Technavio's recording chart paper market is segmented as below:
| Market Scope | |
|---|---|
| Base Year | 2024 |
| End Year | 2028 |
| Series Year | 2024-2028 |
| Growth Momentum | Accelerate |
| YOY 2024 | 5.39% |
| CAGR | 6.01% |
| Incremental Value | $753.71mn |
By Application
- Hospitals
- Diagnostic centers
- Clinics
By Type
- Cardiology monitoring recording
- Ambulatory and EMS recording
- Ultrasound and OB-GYN recording
- Fetal monitoring recording
By Geography
- North America
- Europe
- Asia
- Rest of World (ROW)
This study identifies the increasing adoption of digital healthcare services as one of the prime reasons driving the recording chart paper market growth during the next few years. Also, the integration of recording chart paper with telemedicine platforms and the growing focus on patient-centered care models will lead to sizable demand in the market.
The report on the recording chart paper market covers the following areas:
- Recording chart paper market sizing
- Recording chart paper market forecast
- Recording chart paper market industry analysis
The robust vendor analysis is designed to help clients improve their market position, and in line with this, this report provides a detailed analysis of several leading recording chart paper market vendors that include Avantor Inc., Cardinal Health Inc., CompareNetworks Inc., Dickson Inc., GeoCorp Inc., Honeywell International Inc., Merck KGaA, Precision Charts Inc., Shandong Ultra Paper Co. Ltd., Thermo Fisher Scientific Inc., and Yokogawa Electric Corp.. Also, the recording chart paper market analysis report includes information on upcoming trends and challenges that will influence market growth. This is to help companies strategize and leverage all forthcoming growth opportunities.
The study was conducted using an objective combination of primary and secondary information including inputs from key participants in the industry. The report contains a comprehensive market and vendor landscape in addition to an analysis of the key vendors.
The publisher presents a detailed picture of the market by way of study, synthesis, and summation of data from multiple sources through an analysis of key parameters such as profit, pricing, competition, and promotions. It presents various market facets by identifying the key industry influencers. The data presented is comprehensive, reliable, and a result of extensive research - both primary and secondary. The market research reports provide a complete competitive landscape and an in-depth vendor selection methodology and analysis using qualitative and quantitative research to forecast accurate market growth.
Table of Contents
1 Executive Summary
- 1.1 Market overview
2 Market Landscape
- 2.1 Market ecosystem
3 Market Sizing
- 3.1 Market definition
- 3.2 Market segment analysis
- 3.3 Market size 2023
- 3.4 Market outlook: Forecast for 2023-2028
4 Historic Market Size
- 4.1 Global recording chart paper market 2018 - 2022
- 4.2 Application Segment Analysis 2018 - 2022
- 4.3 Type Segment Analysis 2018 - 2022
- 4.4 Geography Segment Analysis 2018 - 2022
- 4.5 Country Segment Analysis 2018 - 2022
5 Five Forces Analysis
- 5.1 Five forces summary
- 5.2 Bargaining power of buyers
- 5.3 Bargaining power of suppliers
- 5.4 Threat of new entrants
- 5.5 Threat of substitutes
- 5.6 Threat of rivalry
- 5.7 Market condition
6 Market Segmentation by Application
- 6.1 Market segments
- 6.2 Comparison by Application
- 6.3 Hospitals - Market size and forecast 2023-2028
- 6.4 Diagnostic centers - Market size and forecast 2023-2028
- 6.5 Clinics - Market size and forecast 2023-2028
- 6.6 Market opportunity by Application
7 Market Segmentation by Type
- 7.1 Market segments
- 7.2 Comparison by Type
- 7.3 Cardiology monitoring recording - Market size and forecast 2023-2028
- 7.4 Ambulatory and EMS recording - Market size and forecast 2023-2028
- 7.5 Ultrasound and OB-GYN recording - Market size and forecast 2023-2028
- 7.6 Fetal monitoring recording - Market size and forecast 2023-2028
- 7.7 Market opportunity by Type
8 Customer Landscape
- 8.1 Customer landscape overview
9 Geographic Landscape
- 9.1 Geographic segmentation
- 9.2 Geographic comparison
- 9.3 North America - Market size and forecast 2023-2028
- 9.4 Europe - Market size and forecast 2023-2028
- 9.5 Asia - Market size and forecast 2023-2028
- 9.6 Rest of World (ROW) - Market size and forecast 2023-2028
- 9.7 US - Market size and forecast 2023-2028
- 9.8 UK - Market size and forecast 2023-2028
- 9.9 China - Market size and forecast 2023-2028
- 9.10 Germany - Market size and forecast 2023-2028
- 9.11 Canada - Market size and forecast 2023-2028
- 9.12 Market opportunity by geography
10 Drivers, Challenges, and Trends
- 10.1 Market drivers
- 10.2 Market challenges
- 10.3 Impact of drivers and challenges
- 10.4 Market trends
11 Vendor Landscape
- 11.1 Overview
- 11.2 Vendor landscape
- 11.3 Landscape disruption
- 11.4 Industry risks
12 Vendor Analysis
- 12.1 Vendors covered
- 12.2 Market positioning of vendors
- 12.3 Avantor Inc
- 12.4 Cardinal Health Inc.
- 12.5 CompareNetworks Inc.
- 12.6 Dickson Inc.
- 12.7 GeoCorp Inc.
- 12.8 Honeywell International Inc.
- 12.9 Merck KGaA
- 12.10 Precision Charts Inc.
- 12.11 Shandong Ultra Paper Co. Ltd.
- 12.12 Thermo Fisher Scientific Inc.
- 12.13 Yokogawa Electric Corp.
13 Appendix
- 13.1 Scope of the report
- 13.2 Inclusions and exclusions checklist
- 13.3 Currency conversion rates for US$
- 13.4 Research methodology
- 13.5 List of abbreviations

