|
|
市場調査レポート
商品コード
1459520
農耕機器の世界市場 2024-2028Global Farm Equipment Market 2024-2028 |
||||||

|
|||||||
カスタマイズ可能
|
|||||||


| 農耕機器の世界市場 2024-2028 |
|
出版日: 2024年03月25日
発行: TechNavio
ページ情報: 英文 174 Pages
納期: 即納可能
|

全表示
- 概要
- 図表
- 目次
農耕機器市場は2023-2028年に411億2,000万米ドル、予測期間中のCAGRは5.47%で成長すると予測されます。
当レポートでは、農耕機器市場の全体的な分析、市場規模・予測、動向、成長促進要因、課題、約25のベンダーを網羅したベンダー分析などを掲載しています。
現在の市場シナリオ、最新動向と促進要因、市場環境全体に関する最新分析を提供しています。市場は、精密農業技術の採用の増加、持続可能な農業慣行に対する意識の高まりと実施、世界人口の一貫した増加と食糧需要によって牽引されています。
| 市場範囲 | |
|---|---|
| 基準年 | 2024 |
| 終了年 | 2028 |
| 予測期間 | 2024-2028 |
| 成長モメンタム | 加速 |
| 前年比2024年 | 5.06% |
| CAGR | 5.47% |
| 増分額 | 411億2,000万米ドル |
本調査では、今後数年間の農耕機器市場成長を牽引する主な要因の1つとして、小規模農家や個人農家、ブドウ園、果樹園のオーナーによる小型トラクターの採用が増加していることを挙げています。また、共同農業モデルへの傾斜や、レンタルによる農耕機器の市場浸透の拡大は、市場の大きな需要につながります。
目次
第1章 エグゼクティブサマリー
- 市場概要
第2章 市場情勢
- 市場エコシステム
第3章 市場規模の評価
- 市場の定義
- 市場セグメント分析
- 市場規模 2023
- 市場の見通し 2023-2028
第4章 市場規模実績
- 農耕機器の世界市場 2018-2022
- タイプセグメント分析 2018-2022
- 製品セグメント分析 2018-2022
- 地域別セグメント分析 2018-2022
- 国別セグメント分析 2018-2022
第5章 ファイブフォース分析
- ファイブフォースの要約
- 買い手の交渉力
- 供給企業の交渉力
- 新規参入業者の脅威
- 代替品の脅威
- 競争の脅威
- 市況
第6章 市場セグメンテーション:タイプ別
- 市場セグメント
- 比較:タイプ別
- マニュアル:市場規模と予測 2023-2028
- 半自動:市場規模と予測 2023-2028
- 自動:市場規模と予測 2023-2028
- 市場機会:タイプ別
第7章 市場セグメンテーション:製品別
- 市場セグメント
- 比較:製品別
- 農耕機:市場規模と予測 2023-2028
- コンバイン:市場規模と予測 2023-2028
- スプレー:市場規模と予測 2023-2028
- ベーラー:市場規模と予測 2023-2028
- 市場機会:製品別
第8章 顧客情勢
- 顧客情勢の概要
第9章 地域別情勢
- 地域別セグメンテーション
- 地域別比較
- アジア太平洋:市場規模と予測 2023-2028
- 北米:市場規模と予測 2023-2028
- 欧州:市場規模と予測 2023-2028
- 南米:市場規模と予測 2023-2028
- 中東・アフリカ:市場規模と予測 2023-2028
- 米国:市場規模と予測 2023-2028
- 中国:市場規模と予測 2023-2028
- オーストラリア:市場規模と予測 2023-2028
- ブラジル:市場規模と予測 2023-2028
- フランス:市場規模と予測 2023-2028
- 市場機会:地域情勢別
第10章 促進要因、課題、および動向
- 市場促進要因
- 市場の課題
- 促進要因と課題の影響
- 市場動向
第11章 ベンダー情勢
- 概要
- ベンダー情勢
- 混乱の状況
- 業界のリスク
第12章 ベンダー分析
- 対象ベンダー
- ベンダーの市場ポジショニング
- AGCO Corp.
- Argo Tractors SpA
- Brohawk exports
- Bucher Industries AG
- CLAAS KGaA mBH
- CNH Industrial NV
- Deere and Co.
- ISEKI and Co. Ltd.
- J C Bamford Excavators Ltd.
- Kubota Corp.
- LEMKEN GmbH and Co. KG
- Mahindra and Mahindra Ltd.
- Maschio Gaspardo Spa
- Sonalika International Tractors Ltd.
- Yanmar Holdings Co. Ltd.
第13章 付録
Exhibits:
- Exhibits1: Executive Summary - Chart on Market Overview
- Exhibits2: Executive Summary - Data Table on Market Overview
- Exhibits3: Executive Summary - Chart on Global Market Characteristics
- Exhibits4: Executive Summary - Chart on Market By Geographical Landscape
- Exhibits5: Executive Summary - Chart on Market Segmentation by Type
- Exhibits6: Executive Summary - Chart on Market Segmentation by Product
- Exhibits7: Executive Summary - Chart on Incremental Growth
- Exhibits8: Executive Summary - Data Table on Incremental Growth
- Exhibits9: Executive Summary - Chart on Vendor Market Positioning
- Exhibits10: Parent market
- Exhibits11: Market Characteristics
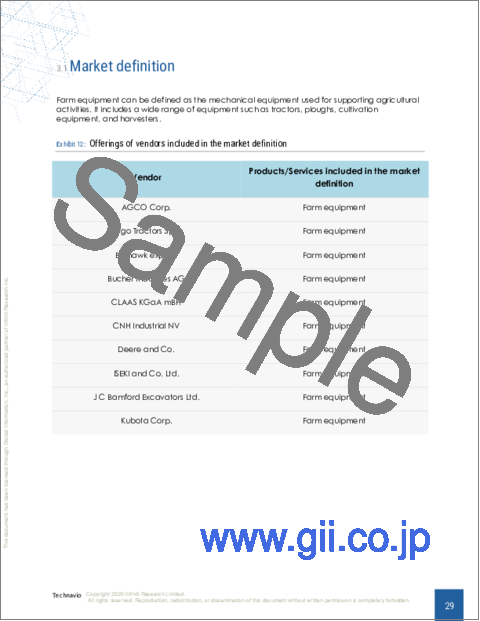
- Exhibits12: Offerings of vendors included in the market definition
- Exhibits13: Market segments
- Exhibits14: Chart on Global - Market size and forecast 2023-2028 ($ billion)
- Exhibits15: Data Table on Global - Market size and forecast 2023-2028 ($ billion)
- Exhibits16: Chart on Global Market: Year-over-year growth 2023-2028 (%)
- Exhibits17: Data Table on Global Market: Year-over-year growth 2023-2028 (%)
- Exhibits18: Five forces analysis - Comparison between 2023 and 2028
- Exhibits19: Chart on Bargaining power of buyers - Impact of key factors 2023 and 2028
- Exhibits20: Bargaining power of suppliers - Impact of key factors in 2023 and 2028
- Exhibits21: Threat of new entrants - Impact of key factors in 2023 and 2028
- Exhibits22: Threat of substitutes - Impact of key factors in 2023 and 2028
- Exhibits23: Threat of rivalry - Impact of key factors in 2023 and 2028
- Exhibits24: Chart on Market condition - Five forces 2023 and 2028
- Exhibits25: Chart on Type - Market share 2023-2028 (%)
- Exhibits26: Data Table on Type - Market share 2023-2028 (%)
- Exhibits27: Chart on Comparison by Type
- Exhibits28: Data Table on Comparison by Type
- Exhibits29: Chart on Manual - Market size and forecast 2023-2028 ($ billion)
- Exhibits30: Data Table on Manual - Market size and forecast 2023-2028 ($ billion)
- Exhibits31: Chart on Manual - Year-over-year growth 2023-2028 (%)
- Exhibits32: Data Table on Manual - Year-over-year growth 2023-2028 (%)
- Exhibits33: Chart on Semi automatic - Market size and forecast 2023-2028 ($ billion)
- Exhibits34: Data Table on Semi automatic - Market size and forecast 2023-2028 ($ billion)
- Exhibits35: Chart on Semi automatic - Year-over-year growth 2023-2028 (%)
- Exhibits36: Data Table on Semi automatic - Year-over-year growth 2023-2028 (%)
- Exhibits37: Chart on Automatic - Market size and forecast 2023-2028 ($ billion)
- Exhibits38: Data Table on Automatic - Market size and forecast 2023-2028 ($ billion)
- Exhibits39: Chart on Automatic - Year-over-year growth 2023-2028 (%)
- Exhibits40: Data Table on Automatic - Year-over-year growth 2023-2028 (%)
- Exhibits41: Market opportunity by Type ($ billion)
- Exhibits42: Data Table on Market opportunity by Type ($ billion)
- Exhibits43: Chart on Product - Market share 2023-2028 (%)
- Exhibits44: Data Table on Product - Market share 2023-2028 (%)
- Exhibits45: Chart on Comparison by Product
- Exhibits46: Data Table on Comparison by Product
- Exhibits47: Chart on Implement - Market size and forecast 2023-2028 ($ billion)
- Exhibits48: Data Table on Implement - Market size and forecast 2023-2028 ($ billion)
- Exhibits49: Chart on Implement - Year-over-year growth 2023-2028 (%)
- Exhibits50: Data Table on Implement - Year-over-year growth 2023-2028 (%)
- Exhibits51: Chart on Combines - Market size and forecast 2023-2028 ($ billion)
- Exhibits52: Data Table on Combines - Market size and forecast 2023-2028 ($ billion)
- Exhibits53: Chart on Combines - Year-over-year growth 2023-2028 (%)
- Exhibits54: Data Table on Combines - Year-over-year growth 2023-2028 (%)
- Exhibits55: Chart on Sprayer - Market size and forecast 2023-2028 ($ billion)
- Exhibits56: Data Table on Sprayer - Market size and forecast 2023-2028 ($ billion)
- Exhibits57: Chart on Sprayer - Year-over-year growth 2023-2028 (%)
- Exhibits58: Data Table on Sprayer - Year-over-year growth 2023-2028 (%)
- Exhibits59: Chart on Baler - Market size and forecast 2023-2028 ($ billion)
- Exhibits60: Data Table on Baler - Market size and forecast 2023-2028 ($ billion)
- Exhibits61: Chart on Baler - Year-over-year growth 2023-2028 (%)
- Exhibits62: Data Table on Baler - Year-over-year growth 2023-2028 (%)
- Exhibits63: Market opportunity by Product ($ billion)
- Exhibits64: Data Table on Market opportunity by Product ($ billion)
- Exhibits65: Analysis of price sensitivity, lifecycle, customer purchase basket, adoption rates, and purchase criteria
- Exhibits66: Chart on Market share By Geographical Landscape 2023-2028 (%)
- Exhibits67: Data Table on Market share By Geographical Landscape 2023-2028 (%)
- Exhibits68: Chart on Geographic comparison
- Exhibits69: Data Table on Geographic comparison
- Exhibits70: Chart on APAC - Market size and forecast 2023-2028 ($ billion)
- Exhibits71: Data Table on APAC - Market size and forecast 2023-2028 ($ billion)
- Exhibits72: Chart on APAC - Year-over-year growth 2023-2028 (%)
- Exhibits73: Data Table on APAC - Year-over-year growth 2023-2028 (%)
- Exhibits74: Chart on North America - Market size and forecast 2023-2028 ($ billion)
- Exhibits75: Data Table on North America - Market size and forecast 2023-2028 ($ billion)
- Exhibits76: Chart on North America - Year-over-year growth 2023-2028 (%)
- Exhibits77: Data Table on North America - Year-over-year growth 2023-2028 (%)
- Exhibits78: Chart on Europe - Market size and forecast 2023-2028 ($ billion)
- Exhibits79: Data Table on Europe - Market size and forecast 2023-2028 ($ billion)
- Exhibits80: Chart on Europe - Year-over-year growth 2023-2028 (%)
- Exhibits81: Data Table on Europe - Year-over-year growth 2023-2028 (%)
- Exhibits82: Chart on South America - Market size and forecast 2023-2028 ($ billion)
- Exhibits83: Data Table on South America - Market size and forecast 2023-2028 ($ billion)
- Exhibits84: Chart on South America - Year-over-year growth 2023-2028 (%)
- Exhibits85: Data Table on South America - Year-over-year growth 2023-2028 (%)
- Exhibits86: Chart on Middle East and Africa - Market size and forecast 2023-2028 ($ billion)
- Exhibits87: Data Table on Middle East and Africa - Market size and forecast 2023-2028 ($ billion)
- Exhibits88: Chart on Middle East and Africa - Year-over-year growth 2023-2028 (%)
- Exhibits89: Data Table on Middle East and Africa - Year-over-year growth 2023-2028 (%)
- Exhibits90: Chart on US - Market size and forecast 2023-2028 ($ billion)
- Exhibits91: Data Table on US - Market size and forecast 2023-2028 ($ billion)
- Exhibits92: Chart on US - Year-over-year growth 2023-2028 (%)
- Exhibits93: Data Table on US - Year-over-year growth 2023-2028 (%)
- Exhibits94: Chart on China - Market size and forecast 2023-2028 ($ billion)
- Exhibits95: Data Table on China - Market size and forecast 2023-2028 ($ billion)
- Exhibits96: Chart on China - Year-over-year growth 2023-2028 (%)
- Exhibits97: Data Table on China - Year-over-year growth 2023-2028 (%)
- Exhibits98: Chart on Australia - Market size and forecast 2023-2028 ($ billion)
- Exhibits99: Data Table on Australia - Market size and forecast 2023-2028 ($ billion)
- Exhibits100: Chart on Australia - Year-over-year growth 2023-2028 (%)
- Exhibits101: Data Table on Australia - Year-over-year growth 2023-2028 (%)
- Exhibits102: Chart on Brazil - Market size and forecast 2023-2028 ($ billion)
- Exhibits103: Data Table on Brazil - Market size and forecast 2023-2028 ($ billion)
- Exhibits104: Chart on Brazil - Year-over-year growth 2023-2028 (%)
- Exhibits105: Data Table on Brazil - Year-over-year growth 2023-2028 (%)
- Exhibits106: Chart on France - Market size and forecast 2023-2028 ($ billion)
- Exhibits107: Data Table on France - Market size and forecast 2023-2028 ($ billion)
- Exhibits108: Chart on France - Year-over-year growth 2023-2028 (%)
- Exhibits109: Data Table on France - Year-over-year growth 2023-2028 (%)
- Exhibits110: Market opportunity By Geographical Landscape ($ billion)
- Exhibits111: Data Tables on Market opportunity By Geographical Landscape ($ billion)
- Exhibits112: Impact of drivers and challenges in 2023 and 2028
- Exhibits113: Overview on Criticality of inputs and Factors of differentiation
- Exhibits114: Overview on factors of disruption
- Exhibits115: Impact of key risks on business
- Exhibits116: Vendors covered
- Exhibits117: Matrix on vendor position and classification
- Exhibits118: AGCO Corp. - Overview
- Exhibits119: AGCO Corp. - Business segments
- Exhibits120: AGCO Corp. - Key news
- Exhibits121: AGCO Corp. - Key offerings
- Exhibits122: AGCO Corp. - Segment focus
- Exhibits123: Argo Tractors SpA - Overview
- Exhibits124: Argo Tractors SpA - Product / Service
- Exhibits125: Argo Tractors SpA - Key offerings
- Exhibits126: Brohawk exports - Overview
- Exhibits127: Brohawk exports - Product / Service
- Exhibits128: Brohawk exports - Key offerings
- Exhibits129: Bucher Industries AG - Overview
- Exhibits130: Bucher Industries AG - Business segments
- Exhibits131: Bucher Industries AG - Key offerings
- Exhibits132: Bucher Industries AG - Segment focus
- Exhibits133: CLAAS KGaA mBH - Overview
- Exhibits134: CLAAS KGaA mBH - Product / Service
- Exhibits135: CLAAS KGaA mBH - Key offerings
- Exhibits136: CNH Industrial NV - Overview
- Exhibits137: CNH Industrial NV - Business segments
- Exhibits138: CNH Industrial NV - Key news
- Exhibits139: CNH Industrial NV - Key offerings
- Exhibits140: CNH Industrial NV - Segment focus
- Exhibits141: Deere and Co. - Overview
- Exhibits142: Deere and Co. - Business segments
- Exhibits143: Deere and Co. - Key offerings
- Exhibits144: Deere and Co. - Segment focus
- Exhibits145: ISEKI and Co. Ltd. - Overview
- Exhibits146: ISEKI and Co. Ltd. - Product / Service
- Exhibits147: ISEKI and Co. Ltd. - Key offerings
- Exhibits148: J C Bamford Excavators Ltd. - Overview
- Exhibits149: J C Bamford Excavators Ltd. - Product / Service
- Exhibits150: J C Bamford Excavators Ltd. - Key news
- Exhibits151: J C Bamford Excavators Ltd. - Key offerings
- Exhibits152: Kubota Corp. - Overview
- Exhibits153: Kubota Corp. - Business segments
- Exhibits154: Kubota Corp. - Key news
- Exhibits155: Kubota Corp. - Key offerings
- Exhibits156: Kubota Corp. - Segment focus
- Exhibits157: LEMKEN GmbH and Co. KG - Overview
- Exhibits158: LEMKEN GmbH and Co. KG - Product / Service
- Exhibits159: LEMKEN GmbH and Co. KG - Key offerings
- Exhibits160: Mahindra and Mahindra Ltd. - Overview
- Exhibits161: Mahindra and Mahindra Ltd. - Business segments
- Exhibits162: Mahindra and Mahindra Ltd. - Key news
- Exhibits163: Mahindra and Mahindra Ltd. - Key offerings
- Exhibits164: Mahindra and Mahindra Ltd. - Segment focus
- Exhibits165: Maschio Gaspardo Spa - Overview
- Exhibits166: Maschio Gaspardo Spa - Product / Service
- Exhibits167: Maschio Gaspardo Spa - Key offerings
- Exhibits168: Sonalika International Tractors Ltd. - Overview
- Exhibits169: Sonalika International Tractors Ltd. - Product / Service
- Exhibits170: Sonalika International Tractors Ltd. - Key offerings
- Exhibits171: Yanmar Holdings Co. Ltd. - Overview
- Exhibits172: Yanmar Holdings Co. Ltd. - Product / Service
- Exhibits173: Yanmar Holdings Co. Ltd. - Key news
- Exhibits174: Yanmar Holdings Co. Ltd. - Key offerings
- Exhibits175: Inclusions checklist
- Exhibits176: Exclusions checklist
- Exhibits177: Currency conversion rates for US$
- Exhibits178: Research methodology
- Exhibits179: Validation techniques employed for market sizing
- Exhibits180: Information sources
- Exhibits181: List of abbreviations
The farm equipment market is forecasted to grow by USD 41.12 bn during 2023-2028, accelerating at a CAGR of 5.47% during the forecast period. The report on the farm equipment market provides a holistic analysis, market size and forecast, trends, growth drivers, and challenges, as well as vendor analysis covering around 25 vendors.
The report offers an up-to-date analysis regarding the current market scenario, the latest trends and drivers, and the overall market environment. The market is driven by increasing adoption of precision farming technologies, growing awareness and implementation of sustainable agricultural practices, and consistently increasing global population and demand for food.
Technavio's farm equipment market is segmented as below:
| Market Scope | |
|---|---|
| Base Year | 2024 |
| End Year | 2028 |
| Series Year | 2024-2028 |
| Growth Momentum | Accelerate |
| YOY 2024 | 5.06% |
| CAGR | 5.47% |
| Incremental Value | $41.12bn |
By Type
- Manual
- Semi automatic
- Automatic
By Product
- Implement
- Combines
- Sprayer
- Baler
By Geographical Landscape
- APAC
- North America
- Europe
- South America
- Middle East and Africa
This study identifies the growing adoption of small tractors by small and private farms, vineyards, and orchards owners as one of the prime reasons driving the farm equipment market growth during the next few years. Also, inclination towards collaborative farming models and expanding market penetration of farm equipment through rentals will lead to sizable demand in the market.
The report on the farm equipment market covers the following areas:
- Farm equipment market sizing
- Farm equipment market forecast
- Farm equipment market industry analysis
The robust vendor analysis is designed to help clients improve their market position, and in line with this, this report provides a detailed analysis of several leading farm equipment market vendors that include AGCO Corp., Argo Tractors SpA, Brohawk exports, Bucher Industries AG, CLAAS KGaA mBH, CNH Industrial NV, Deere and Co., Duravant LLC, ISEKI and Co. Ltd., J C Bamford Excavators Ltd., Kubota Corp., LEMKEN GmbH and Co. KG, Mahindra and Mahindra Ltd., Maschio Gaspardo Spa, SDF SpA, Sitrex spa, Sonalika International Tractors Ltd., Vaderstad AB, Yanmar Holdings Co. Ltd., and VST Tillers Tractors Ltd.. Also, the farm equipment market analysis report includes information on upcoming trends and challenges that will influence market growth. This is to help companies strategize and leverage all forthcoming growth opportunities.
The study was conducted using an objective combination of primary and secondary information including inputs from key participants in the industry. The report contains a comprehensive market and vendor landscape in addition to an analysis of the key vendors.
The publisher presents a detailed picture of the market by the way of study, synthesis, and summation of data from multiple sources by an analysis of key parameters such as profit, pricing, competition, and promotions. It presents various market facets by identifying the key industry influencers. The data presented is comprehensive, reliable, and a result of extensive research - both primary and secondary. The market research reports provide a complete competitive landscape and an in-depth vendor selection methodology and analysis using qualitative and quantitative research to forecast the accurate market growth.
Table of Contents
1 Executive Summary
- 1.1 Market overview
2 Market Landscape
- 2.1 Market ecosystem
3 Market Sizing
- 3.1 Market definition
- 3.2 Market segment analysis
- 3.3 Market size 2023
- 3.4 Market outlook: Forecast for 2023-2028
4 Historic Market Size
- 4.1 Global farm equipment market 2018 - 2022
- 4.2 Type Segment Analysis 2018 - 2022
- 4.3 Product Segment Analysis 2018 - 2022
- 4.4 Geography Segment Analysis 2018 - 2022
- 4.5 Country Segment Analysis 2018 - 2022
5 Five Forces Analysis
- 5.1 Five forces summary
- 5.2 Bargaining power of buyers
- 5.3 Bargaining power of suppliers
- 5.4 Threat of new entrants
- 5.5 Threat of substitutes
- 5.6 Threat of rivalry
- 5.7 Market condition
6 Market Segmentation by Type
- 6.1 Market segments
- 6.2 Comparison by Type
- 6.3 Manual - Market size and forecast 2023-2028
- 6.4 Semi automatic - Market size and forecast 2023-2028
- 6.5 Automatic - Market size and forecast 2023-2028
- 6.6 Market opportunity by Type
7 Market Segmentation by Product
- 7.1 Market segments
- 7.2 Comparison by Product
- 7.3 Implement - Market size and forecast 2023-2028
- 7.4 Combines - Market size and forecast 2023-2028
- 7.5 Sprayer - Market size and forecast 2023-2028
- 7.6 Baler - Market size and forecast 2023-2028
- 7.7 Market opportunity by Product
8 Customer Landscape
- 8.1 Customer landscape overview
9 Geographic Landscape
- 9.1 Geographic segmentation
- 9.2 Geographic comparison
- 9.3 APAC - Market size and forecast 2023-2028
- 9.4 North America - Market size and forecast 2023-2028
- 9.5 Europe - Market size and forecast 2023-2028
- 9.6 South America - Market size and forecast 2023-2028
- 9.7 Middle East and Africa - Market size and forecast 2023-2028
- 9.8 US - Market size and forecast 2023-2028
- 9.9 China - Market size and forecast 2023-2028
- 9.10 Australia - Market size and forecast 2023-2028
- 9.11 Brazil - Market size and forecast 2023-2028
- 9.12 France - Market size and forecast 2023-2028
- 9.13 Market opportunity By Geographical Landscape
10 Drivers, Challenges, and Trends
- 10.1 Market drivers
- 10.2 Market challenges
- 10.3 Impact of drivers and challenges
- 10.4 Market trends
11 Vendor Landscape
- 11.1 Overview
- 11.2 Vendor landscape
- 11.3 Landscape disruption
- 11.4 Industry risks
12 Vendor Analysis
- 12.1 Vendors covered
- 12.2 Market positioning of vendors
- 12.3 AGCO Corp.
- 12.4 Argo Tractors SpA
- 12.5 Brohawk exports
- 12.6 Bucher Industries AG
- 12.7 CLAAS KGaA mBH
- 12.8 CNH Industrial NV
- 12.9 Deere and Co.
- 12.10 ISEKI and Co. Ltd.
- 12.11 J C Bamford Excavators Ltd.
- 12.12 Kubota Corp.
- 12.13 LEMKEN GmbH and Co. KG
- 12.14 Mahindra and Mahindra Ltd.
- 12.15 Maschio Gaspardo Spa
- 12.16 Sonalika International Tractors Ltd.
- 12.17 Yanmar Holdings Co. Ltd.
13 Appendix
- 13.1 Scope of the report
- 13.2 Inclusions and exclusions checklist
- 13.3 Currency conversion rates for US$
- 13.4 Research methodology
- 13.5 List of abbreviations

