|
|
市場調査レポート
商品コード
1459503
創薬アウトソーシングの世界市場 2024-2028Global Drug Discovery Outsourcing Market 2024-2028 |
||||||

|
|||||||
カスタマイズ可能
|
|||||||

| 創薬アウトソーシングの世界市場 2024-2028 |
|
出版日: 2024年03月22日
発行: TechNavio
ページ情報: 英文 166 Pages
納期: 即納可能
|

全表示
- 概要
- 図表
- 目次
創薬アウトソーシング市場は2023-2028年に17億9,000万米ドル、予測期間中のCAGRは7.44%で成長すると予測されます。
当レポートでは、創薬アウトソーシング市場の全体的な分析、市場規模・予測、動向、成長促進要因、課題、約25のベンダーを網羅したベンダー分析などを掲載しています。
現在の市場シナリオ、最新動向と促進要因、市場環境全体に関する最新分析を提供しています。バイオシミラーに対する旺盛な需要、コア・コンピタンスの優先順位付け、新興国市場におけるFDA承認製造施設の増加などが市場を牽引しています。
| 市場範囲 | |
|---|---|
| 基準年 | 2024 |
| 終了年 | 2028 |
| 予測期間 | 2024-2028 |
| 成長モメンタム | 加速 |
| 前年比2024年 | 7.3% |
| CAGR | 7.44% |
| 増分額 | 17億9,000万米ドル |
本調査では、創薬アウトソーシングを後押しする技術的進歩が、今後数年間の創薬アウトソーシング市場成長を牽引する主要因の1つであるとしています。また、再生医療需要の増加、創薬アウトソーシングのコスト削減・効率化需要も市場の大きな需要につながります。
目次
第1章 エグゼクティブサマリー
- 市場概要
第2章 市場情勢
- 市場エコシステム
第3章 市場規模の評価
- 市場の定義
- 市場セグメント分析
- 市場規模 2023
- 市場の見通し 2023-2028
第4章 市場規模実績
- 創薬アウトソーシングの世界市場 2018-2022
- 製品セグメント分析 2018-2022
- エンドユーザーセグメント分析 2018-2022
- 地域別セグメント分析 2018-2022
- 国別セグメント分析 2018-2022
第5章 ファイブフォース分析
- ファイブフォースの要約
- 買い手の交渉力
- 供給企業の交渉力
- 新規参入業者の脅威
- 代替品の脅威
- 競争の脅威
- 市況
第6章 市場セグメンテーション:製品別
- 市場セグメント
- 比較:製品別
- 低分子創薬:市場規模と予測 2023-2028
- バイオ医薬品:市場規模と予測 2023-2028
- 市場機会:製品別
第7章 市場セグメンテーション:エンドユーザー別
- 市場セグメント
- 比較:エンドユーザー別
- 大手製薬会社:市場規模と予測 2023-2028
- 中小製薬企業:市場規模と予測 2023-2028
- ジェネリック医薬品会社:市場規模と予測 2023-2028
- 市場機会:エンドユーザー別
第8章 顧客情勢
- 顧客情勢の概要
第9章 地域別情勢
- 地域別セグメンテーション
- 地域別比較
- 北米:市場規模と予測 2023-2028
- 欧州:市場規模と予測 2023-2028
- アジア:市場規模と予測 2023-2028
- 世界のその他の地域:市場規模と予測 2023-2028
- 米国:市場規模と予測 2023-2028
- 英国:市場規模と予測 2023-2028
- ドイツ:市場規模と予測 2023-2028
- カナダ:市場規模と予測 2023-2028
- 日本:市場規模と予測 2023-2028
- 市場機会:地域情勢別
第10章 促進要因、課題、および動向
- 市場促進要因
- 市場の課題
- 促進要因と課題の影響
- 市場動向
第11章 ベンダー情勢
- 概要
- ベンダー情勢
- 混乱の状況
- 業界のリスク
第12章 ベンダー分析
- 対象ベンダー
- ベンダーの市場ポジショニング
- Aragen Life Sciences Pvt. Ltd.
- Catalent Inc.
- Charles River Laboratories International Inc.
- Curia Global Inc.
- Domainex
- Eurofins Scientific SE
- Evotec SE
- GenScript Biotech Corp.
- LABORATORY CORPORATION OF AMERICA HOLDINGS
- Lonza Group Ltd.
- Lupin Ltd.
- Oncodesign Services
- PerkinElmer Inc
- QIAGEN NV
- Thermo Fisher Scientific Inc.
第13章 付録
Exhibits:
- Exhibits1: Executive Summary - Chart on Market Overview
- Exhibits2: Executive Summary - Data Table on Market Overview
- Exhibits3: Executive Summary - Chart on Global Market Characteristics
- Exhibits4: Executive Summary - Chart on Market By Geographical Landscape
- Exhibits5: Executive Summary - Chart on Market Segmentation by Product
- Exhibits6: Executive Summary - Chart on Market Segmentation by End-user
- Exhibits7: Executive Summary - Chart on Incremental Growth
- Exhibits8: Executive Summary - Data Table on Incremental Growth
- Exhibits9: Executive Summary - Chart on Vendor Market Positioning
- Exhibits10: Parent market
- Exhibits11: Market Characteristics
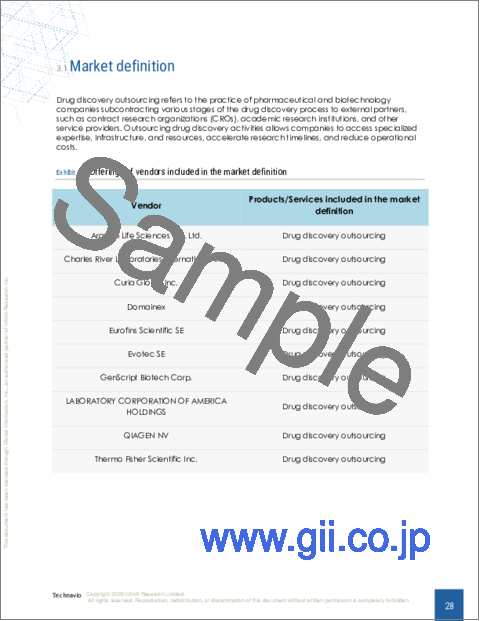
- Exhibits12: Offerings of vendors included in the market definition
- Exhibits13: Market segments
- Exhibits14: Chart on Global - Market size and forecast 2023-2028 ($ billion)
- Exhibits15: Data Table on Global - Market size and forecast 2023-2028 ($ billion)
- Exhibits16: Chart on Global Market: Year-over-year growth 2023-2028 (%)
- Exhibits17: Data Table on Global Market: Year-over-year growth 2023-2028 (%)
- Exhibits18: Historic Market Size - Data Table on global drug discovery outsourcing market 2018 - 2022 ($ billion)
- Exhibits19: Historic Market Size - Product Segment 2018 - 2022 ($ billion)
- Exhibits20: Historic Market Size - End-user Segment 2018 - 2022 ($ billion)
- Exhibits21: Historic Market Size - Geography Segment 2018 - 2022 ($ billion)
- Exhibits22: Historic Market Size - Country Segment 2018 - 2022 ($ billion)
- Exhibits23: Five forces analysis - Comparison between 2023 and 2028
- Exhibits24: Chart on Bargaining power of buyers - Impact of key factors 2023 and 2028
- Exhibits25: Bargaining power of suppliers - Impact of key factors in 2023 and 2028
- Exhibits26: Threat of new entrants - Impact of key factors in 2023 and 2028
- Exhibits27: Threat of substitutes - Impact of key factors in 2023 and 2028
- Exhibits28: Threat of rivalry - Impact of key factors in 2023 and 2028
- Exhibits29: Chart on Market condition - Five forces 2023 and 2028
- Exhibits30: Chart on Product - Market share 2023-2028 (%)
- Exhibits31: Data Table on Product - Market share 2023-2028 (%)
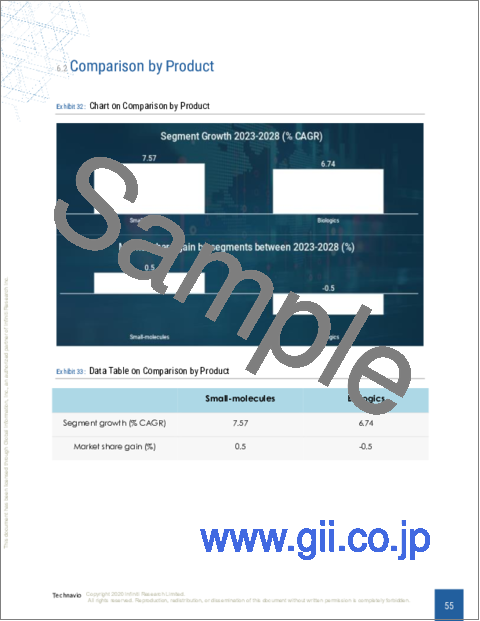
- Exhibits32: Chart on Comparison by Product
- Exhibits33: Data Table on Comparison by Product
- Exhibits34: Chart on Small-molecules - Market size and forecast 2023-2028 ($ billion)
- Exhibits35: Data Table on Small-molecules - Market size and forecast 2023-2028 ($ billion)
- Exhibits36: Chart on Small-molecules - Year-over-year growth 2023-2028 (%)
- Exhibits37: Data Table on Small-molecules - Year-over-year growth 2023-2028 (%)
- Exhibits38: Chart on Biologics - Market size and forecast 2023-2028 ($ billion)
- Exhibits39: Data Table on Biologics - Market size and forecast 2023-2028 ($ billion)
- Exhibits40: Chart on Biologics - Year-over-year growth 2023-2028 (%)
- Exhibits41: Data Table on Biologics - Year-over-year growth 2023-2028 (%)
- Exhibits42: Market opportunity by Product ($ billion)
- Exhibits43: Data Table on Market opportunity by Product ($ billion)
- Exhibits44: Chart on End-user - Market share 2023-2028 (%)
- Exhibits45: Data Table on End-user - Market share 2023-2028 (%)
- Exhibits46: Chart on Comparison by End-user
- Exhibits47: Data Table on Comparison by End-user
- Exhibits48: Chart on Big pharmaceutical companies - Market size and forecast 2023-2028 ($ billion)
- Exhibits49: Data Table on Big pharmaceutical companies - Market size and forecast 2023-2028 ($ billion)
- Exhibits50: Chart on Big pharmaceutical companies - Year-over-year growth 2023-2028 (%)
- Exhibits51: Data Table on Big pharmaceutical companies - Year-over-year growth 2023-2028 (%)
- Exhibits52: Chart on Small and medium-sized pharmaceutical companies - Market size and forecast 2023-2028 ($ billion)
- Exhibits53: Data Table on Small and medium-sized pharmaceutical companies - Market size and forecast 2023-2028 ($ billion)
- Exhibits54: Chart on Small and medium-sized pharmaceutical companies - Year-over-year growth 2023-2028 (%)
- Exhibits55: Data Table on Small and medium-sized pharmaceutical companies - Year-over-year growth 2023-2028 (%)
- Exhibits56: Chart on Generic pharmaceutical companies - Market size and forecast 2023-2028 ($ billion)
- Exhibits57: Data Table on Generic pharmaceutical companies - Market size and forecast 2023-2028 ($ billion)
- Exhibits58: Chart on Generic pharmaceutical companies - Year-over-year growth 2023-2028 (%)
- Exhibits59: Data Table on Generic pharmaceutical companies - Year-over-year growth 2023-2028 (%)
- Exhibits60: Market opportunity by End-user ($ billion)
- Exhibits61: Data Table on Market opportunity by End-user ($ billion)
- Exhibits62: Analysis of price sensitivity, lifecycle, customer purchase basket, adoption rates, and purchase criteria
- Exhibits63: Chart on Market share By Geographical Landscape 2023-2028 (%)
- Exhibits64: Data Table on Market share By Geographical Landscape 2023-2028 (%)
- Exhibits65: Chart on Geographic comparison
- Exhibits66: Data Table on Geographic comparison
- Exhibits67: Chart on North America - Market size and forecast 2023-2028 ($ billion)
- Exhibits68: Data Table on North America - Market size and forecast 2023-2028 ($ billion)
- Exhibits69: Chart on North America - Year-over-year growth 2023-2028 (%)
- Exhibits70: Data Table on North America - Year-over-year growth 2023-2028 (%)
- Exhibits71: Chart on Europe - Market size and forecast 2023-2028 ($ billion)
- Exhibits72: Data Table on Europe - Market size and forecast 2023-2028 ($ billion)
- Exhibits73: Chart on Europe - Year-over-year growth 2023-2028 (%)
- Exhibits74: Data Table on Europe - Year-over-year growth 2023-2028 (%)
- Exhibits75: Chart on Asia - Market size and forecast 2023-2028 ($ billion)
- Exhibits76: Data Table on Asia - Market size and forecast 2023-2028 ($ billion)
- Exhibits77: Chart on Asia - Year-over-year growth 2023-2028 (%)
- Exhibits78: Data Table on Asia - Year-over-year growth 2023-2028 (%)
- Exhibits79: Chart on Rest of World (ROW) - Market size and forecast 2023-2028 ($ billion)
- Exhibits80: Data Table on Rest of World (ROW) - Market size and forecast 2023-2028 ($ billion)
- Exhibits81: Chart on Rest of World (ROW) - Year-over-year growth 2023-2028 (%)
- Exhibits82: Data Table on Rest of World (ROW) - Year-over-year growth 2023-2028 (%)
- Exhibits83: Chart on US - Market size and forecast 2023-2028 ($ billion)
- Exhibits84: Data Table on US - Market size and forecast 2023-2028 ($ billion)
- Exhibits85: Chart on US - Year-over-year growth 2023-2028 (%)
- Exhibits86: Data Table on US - Year-over-year growth 2023-2028 (%)
- Exhibits87: Chart on UK - Market size and forecast 2023-2028 ($ billion)
- Exhibits88: Data Table on UK - Market size and forecast 2023-2028 ($ billion)
- Exhibits89: Chart on UK - Year-over-year growth 2023-2028 (%)
- Exhibits90: Data Table on UK - Year-over-year growth 2023-2028 (%)
- Exhibits91: Chart on Germany - Market size and forecast 2023-2028 ($ billion)
- Exhibits92: Data Table on Germany - Market size and forecast 2023-2028 ($ billion)
- Exhibits93: Chart on Germany - Year-over-year growth 2023-2028 (%)
- Exhibits94: Data Table on Germany - Year-over-year growth 2023-2028 (%)
- Exhibits95: Chart on Canada - Market size and forecast 2023-2028 ($ billion)
- Exhibits96: Data Table on Canada - Market size and forecast 2023-2028 ($ billion)
- Exhibits97: Chart on Canada - Year-over-year growth 2023-2028 (%)
- Exhibits98: Data Table on Canada - Year-over-year growth 2023-2028 (%)
- Exhibits99: Chart on Japan - Market size and forecast 2023-2028 ($ billion)
- Exhibits100: Data Table on Japan - Market size and forecast 2023-2028 ($ billion)
- Exhibits101: Chart on Japan - Year-over-year growth 2023-2028 (%)
- Exhibits102: Data Table on Japan - Year-over-year growth 2023-2028 (%)
- Exhibits103: Market opportunity By Geographical Landscape ($ billion)
- Exhibits104: Data Tables on Market opportunity By Geographical Landscape ($ billion)
- Exhibits105: Impact of drivers and challenges in 2023 and 2028
- Exhibits106: Overview on Criticality of inputs and Factors of differentiation
- Exhibits107: Overview on factors of disruption
- Exhibits108: Impact of key risks on business
- Exhibits109: Vendors covered
- Exhibits110: Matrix on vendor position and classification
- Exhibits111: Aragen Life Sciences Pvt. Ltd. - Overview
- Exhibits112: Aragen Life Sciences Pvt. Ltd. - Product / Service
- Exhibits113: Aragen Life Sciences Pvt. Ltd. - Key offerings
- Exhibits114: Catalent Inc. - Overview
- Exhibits115: Catalent Inc. - Business segments
- Exhibits116: Catalent Inc. - Key offerings
- Exhibits117: Catalent Inc. - Segment focus
- Exhibits118: Charles River Laboratories International Inc. - Overview
- Exhibits119: Charles River Laboratories International Inc. - Business segments
- Exhibits120: Charles River Laboratories International Inc. - Key news
- Exhibits121: Charles River Laboratories International Inc. - Key offerings
- Exhibits122: Charles River Laboratories International Inc. - Segment focus
- Exhibits123: Curia Global Inc. - Overview
- Exhibits124: Curia Global Inc. - Product / Service
- Exhibits125: Curia Global Inc. - Key offerings
- Exhibits126: Domainex - Overview
- Exhibits127: Domainex - Product / Service
- Exhibits128: Domainex - Key offerings
- Exhibits129: Eurofins Scientific SE - Overview
- Exhibits130: Eurofins Scientific SE - Business segments
- Exhibits131: Eurofins Scientific SE - Key news
- Exhibits132: Eurofins Scientific SE - Key offerings
- Exhibits133: Eurofins Scientific SE - Segment focus
- Exhibits134: Evotec SE - Overview
- Exhibits135: Evotec SE - Business segments
- Exhibits136: Evotec SE - Key offerings
- Exhibits137: Evotec SE - Segment focus
- Exhibits138: GenScript Biotech Corp. - Overview
- Exhibits139: GenScript Biotech Corp. - Business segments
- Exhibits140: GenScript Biotech Corp. - Key offerings
- Exhibits141: GenScript Biotech Corp. - Segment focus
- Exhibits142: LABORATORY CORPORATION OF AMERICA HOLDINGS - Overview
- Exhibits143: LABORATORY CORPORATION OF AMERICA HOLDINGS - Business segments
- Exhibits144: LABORATORY CORPORATION OF AMERICA HOLDINGS - Key news
- Exhibits145: LABORATORY CORPORATION OF AMERICA HOLDINGS - Key offerings
- Exhibits146: LABORATORY CORPORATION OF AMERICA HOLDINGS - Segment focus
- Exhibits147: Lonza Group Ltd. - Overview
- Exhibits148: Lonza Group Ltd. - Business segments
- Exhibits149: Lonza Group Ltd. - Key news
- Exhibits150: Lonza Group Ltd. - Key offerings
- Exhibits151: Lonza Group Ltd. - Segment focus
- Exhibits152: Lupin Ltd. - Overview
- Exhibits153: Lupin Ltd. - Product / Service
- Exhibits154: Lupin Ltd. - Key news
- Exhibits155: Lupin Ltd. - Key offerings
- Exhibits156: Oncodesign Services - Overview
- Exhibits157: Oncodesign Services - Product / Service
- Exhibits158: Oncodesign Services - Key offerings
- Exhibits159: PerkinElmer Inc - Overview
- Exhibits160: PerkinElmer Inc - Business segments
- Exhibits161: PerkinElmer Inc - Key news
- Exhibits162: PerkinElmer Inc - Key offerings
- Exhibits163: PerkinElmer Inc - Segment focus
- Exhibits164: QIAGEN NV - Overview
- Exhibits165: QIAGEN NV - Product / Service
- Exhibits166: QIAGEN NV - Key offerings
- Exhibits167: Thermo Fisher Scientific Inc. - Overview
- Exhibits168: Thermo Fisher Scientific Inc. - Business segments
- Exhibits169: Thermo Fisher Scientific Inc. - Key news
- Exhibits170: Thermo Fisher Scientific Inc. - Key offerings
- Exhibits171: Thermo Fisher Scientific Inc. - Segment focus
- Exhibits172: Inclusions checklist
- Exhibits173: Exclusions checklist
- Exhibits174: Currency conversion rates for US$
- Exhibits175: Research methodology
- Exhibits176: Validation techniques employed for market sizing
- Exhibits177: Information sources
- Exhibits178: List of abbreviations
The drug discovery outsourcing market is forecasted to grow by USD 1.79 bn during 2023-2028, accelerating at a CAGR of 7.44% during the forecast period. The report on the drug discovery outsourcing market provides a holistic analysis, market size and forecast, trends, growth drivers, and challenges, as well as vendor analysis covering around 25 vendors.
The report offers an up-to-date analysis regarding the current market scenario, the latest trends and drivers, and the overall market environment. The market is driven by robust demand for biosimilars, prioritization of core competencies, and an increased number of FDA-approved manufacturing facilities in developing nations.
Technavio's drug discovery outsourcing market is segmented as below:
| Market Scope | |
|---|---|
| Base Year | 2024 |
| End Year | 2028 |
| Series Year | 2024-2028 |
| Growth Momentum | Accelerate |
| YOY 2024 | 7.3% |
| CAGR | 7.44% |
| Incremental Value | $1.79bn |
By Product
- Small-molecules
- Biologics
By End-user
- Big pharmaceutical companies
- Small and medium-sized pharmaceutical companies
- Generic pharmaceutical companies
By Geographical Landscape
- North America
- Europe
- Asia
- Rest of World (ROW)
This study identifies the technological advancements boosting drug discovery outsourcing as one of the prime reasons driving the drug discovery outsourcing market growth during the next few years. Also, increased demand for regenerative medicine and cost reduction and efficiency-boosting demand for drug discovery outsourcing will lead to sizable demand in the market.
The report on the drug discovery outsourcing market covers the following areas:
- Drug discovery outsourcing market sizing
- Drug discovery outsourcing market forecast
- Drug discovery outsourcing market industry analysis
The robust vendor analysis is designed to help clients improve their market position, and in line with this, this report provides a detailed analysis of several leading drug discovery outsourcing market vendors that include Aragen Life Sciences Pvt. Ltd., Aurigene Discovery Technologies, Catalent Inc., Charles River Laboratories International Inc., Curia Global Inc., Domainex, Eurofins Scientific SE, Evotec SE, GenScript Biotech Corp., LABORATORY CORPORATION OF AMERICA HOLDINGS, Lonza Group Ltd., Lupin Ltd., Novotech Health Holdings, Oncodesign Services, PerkinElmer Inc, QIAGEN NV, Shanghai Medicilon Inc., Syngene International Ltd., Thermo Fisher Scientific Inc., and WuXi AppTec Co. Ltd. Also, the drug discovery outsourcing market analysis report includes information on upcoming trends and challenges that will influence market growth. This is to help companies strategize and leverage all forthcoming growth opportunities.
The study was conducted using an objective combination of primary and secondary information including inputs from key participants in the industry. The report contains a comprehensive market and vendor landscape in addition to an analysis of the key vendors.
The publisher presents a detailed picture of the market by way of study, synthesis, and summation of data from multiple sources through an analysis of key parameters such as profit, pricing, competition, and promotions. It presents various market facets by identifying the key industry influencers. The data presented is comprehensive, reliable, and a result of extensive research - both primary and secondary. The market research reports provide a complete competitive landscape and an in-depth vendor selection methodology and analysis using qualitative and quantitative research to forecast accurate market growth.
Table of Contents
1 Executive Summary
- 1.1 Market overview
2 Market Landscape
- 2.1 Market ecosystem
3 Market Sizing
- 3.1 Market definition
- 3.2 Market segment analysis
- 3.3 Market size 2023
- 3.4 Market outlook: Forecast for 2023-2028
4 Historic Market Size
- 4.1 Global drug discovery outsourcing market 2018 - 2022
- 4.2 Product Segment Analysis 2018 - 2022
- 4.3 End-user Segment Analysis 2018 - 2022
- 4.4 Geography Segment Analysis 2018 - 2022
- 4.5 Country Segment Analysis 2018 - 2022
5 Five Forces Analysis
- 5.1 Five forces summary
- 5.2 Bargaining power of buyers
- 5.3 Bargaining power of suppliers
- 5.4 Threat of new entrants
- 5.5 Threat of substitutes
- 5.6 Threat of rivalry
- 5.7 Market condition
6 Market Segmentation by Product
- 6.1 Market segments
- 6.2 Comparison by Product
- 6.3 Small-molecules - Market size and forecast 2023-2028
- 6.4 Biologics - Market size and forecast 2023-2028
- 6.5 Market opportunity by Product
7 Market Segmentation by End-user
- 7.1 Market segments
- 7.2 Comparison by End-user
- 7.3 Big pharmaceutical companies - Market size and forecast 2023-2028
- 7.4 Small and medium-sized pharmaceutical companies - Market size and forecast 2023-2028
- 7.5 Generic pharmaceutical companies - Market size and forecast 2023-2028
- 7.6 Market opportunity by End-user
8 Customer Landscape
- 8.1 Customer landscape overview
9 Geographic Landscape
- 9.1 Geographic segmentation
- 9.2 Geographic comparison
- 9.3 North America - Market size and forecast 2023-2028
- 9.4 Europe - Market size and forecast 2023-2028
- 9.5 Asia - Market size and forecast 2023-2028
- 9.6 Rest of World (ROW) - Market size and forecast 2023-2028
- 9.7 US - Market size and forecast 2023-2028
- 9.8 UK - Market size and forecast 2023-2028
- 9.9 Germany - Market size and forecast 2023-2028
- 9.10 Canada - Market size and forecast 2023-2028
- 9.11 Japan - Market size and forecast 2023-2028
- 9.12 Market opportunity By Geographical Landscape
10 Drivers, Challenges, and Trends
- 10.1 Market drivers
- 10.2 Market challenges
- 10.3 Impact of drivers and challenges
- 10.4 Market trends
11 Vendor Landscape
- 11.1 Overview
- 11.2 Vendor landscape
- 11.3 Landscape disruption
- 11.4 Industry risks
12 Vendor Analysis
- 12.1 Vendors covered
- 12.2 Market positioning of vendors
- 12.3 Aragen Life Sciences Pvt. Ltd.
- 12.4 Catalent Inc.
- 12.5 Charles River Laboratories International Inc.
- 12.6 Curia Global Inc.
- 12.7 Domainex
- 12.8 Eurofins Scientific SE
- 12.9 Evotec SE
- 12.10 GenScript Biotech Corp.
- 12.11 LABORATORY CORPORATION OF AMERICA HOLDINGS
- 12.12 Lonza Group Ltd.
- 12.13 Lupin Ltd.
- 12.14 Oncodesign Services
- 12.15 PerkinElmer Inc
- 12.16 QIAGEN NV
- 12.17 Thermo Fisher Scientific Inc.
13 Appendix
- 13.1 Scope of the report
- 13.2 Inclusions and exclusions checklist
- 13.3 Currency conversion rates for US$
- 13.4 Research methodology
- 13.5 List of abbreviations

