|
|
市場調査レポート
商品コード
1456849
蒸気圧縮式蒸留器の世界市場 2024-2028Global Vapor Compression Distiller Market 2024-2028 |
||||||
|
|||||||
カスタマイズ可能
|
|||||||

| 蒸気圧縮式蒸留器の世界市場 2024-2028 |
|
出版日: 2024年03月14日
発行: TechNavio
ページ情報: 英文 168 Pages
納期: 即納可能
|

全表示
- 概要
- 図表
- 目次
蒸気圧縮式蒸留器市場は2023-2028年に5億4,367万米ドル、予測期間中のCAGRは6.2%で成長すると予測されます。
当レポートでは、蒸気圧縮式蒸留器市場の全体的な分析、市場規模・予測、動向、成長促進要因、課題、約25のベンダーを網羅したベンダー分析などを掲載しています。
現在の市場シナリオ、最新動向と促進要因、市場環境全体に関する最新分析を提供しています。市場は、人口増加と飲料水需要の増加、水質の向上と水源汚染の防止に対するニーズの高まり、海水淡水化プラントへの投資拡大の必要性につながる世界の気候変動によって牽引されています。
| 市場範囲 | |
|---|---|
| 基準年 | 2024 |
| 終了年 | 2028 |
| 予測期間 | 2024-2028 |
| 成長モメンタム | 加速 |
| 前年比2024年 | 5.36% |
| CAGR | 6.2% |
| 増分額 | 5億4,367万米ドル |
本調査では、今後数年間の蒸気圧縮式蒸留器市場成長を牽引する主要因の1つとして、廃水処理プラントへの投資増加を挙げています。また、浄水器の用途拡大やゼロレベルディスチャージ(ZLD)政策を採用する産業界の増加も、市場の大きな需要につながります。
目次
第1章 エグゼクティブサマリー
- 市場概要
第2章 市場情勢
- 市場エコシステム
第3章 市場規模
- 市場の定義
- 市場セグメント分析
- 市場規模 2023
- 市場の見通し 2023-2028
第4章 市場規模実績
- 蒸気圧縮式蒸留器の世界市場 2018-2022
- 技術別セグメント分析 2018-2022
- 用途別セグメント分析 2018-2022
- 地域別セグメント分析 2018-2022
- 国別セグメント分析 2018-2022
第5章 ファイブフォース分析
- ファイブフォースの要約
- 買い手の交渉力
- 供給企業の交渉力
- 新規参入業者の脅威
- 代替品の脅威
- 競争の脅威
- 市況
第6章 市場セグメンテーション:技術別
- 市場セグメント
- 比較:技術別
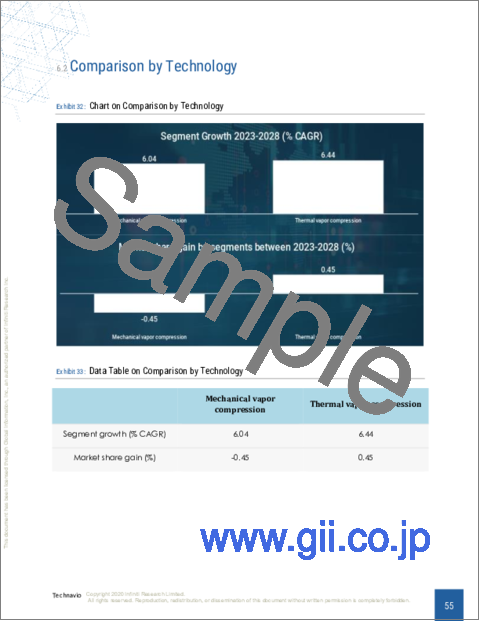
- 機械式蒸気圧縮:市場規模と予測 2023-2028
- 熱蒸気圧縮:市場規模と予測 2023-2028
- 市場機会:技術別
第7章 市場セグメンテーション:用途別
- 市場セグメント
- 比較:用途別
- 製薬業界:市場規模と予測 2023-2028
- 食品業界:市場規模と予測 2023-2028
- 化学工業:市場規模と予測 2023-2028
- その他:市場規模と予測 2023-2028
- 市場機会:用途別
第8章 顧客情勢
- 顧客情勢の概要
第9章 地域別情勢
- 地域別セグメンテーション
- 地域別比較
- アジア太平洋:市場規模と予測 2023-2028
- 欧州:市場規模と予測 2023-2028
- 北米:市場規模と予測 2023-2028
- 中東・アフリカ:市場規模と予測 2023-2028
- 南米:市場規模と予測 2023-2028
- 中国:市場規模と予測 2023-2028
- 米国:市場規模と予測 2023-2028
- インド:市場規模と予測 2023-2028
- ドイツ:市場規模と予測 2023-2028
- 英国:市場規模と予測 2023-2028
- 市場機会:地域情勢別
第10章 促進要因、課題、および動向
- 市場促進要因
- 市場の課題
- 促進要因と課題の影響
- 市場動向
第11章 ベンダー情勢
- 概要
- ベンダー情勢
- 混乱の状況
- 業界のリスク
第12章 ベンダー分析
- 対象ベンダー
- ベンダーの市場ポジショニング
- Alfa Laval AB
- Aqua Chem Inc.
- BRAM COR S.p.A.
- Chart Industries Inc.
- Chutian Technology Co. Ltd.
- GEA Group AG
- Genist Technocracy Pvt Ltd
- Grundfos Holding AS
- Kalina Engineering Pvt Ltd.
- LPR Global Inc.
- Paul Mueller Co. Inc.
- Puretech
- RAG Stiftung
- wemacequipment.com
- Zibo Huazhou Pharmaceutical Equipment Co. Ltd.
第13章 付録
Exhibits:
- Exhibits1: Executive Summary - Chart on Market Overview
- Exhibits2: Executive Summary - Data Table on Market Overview
- Exhibits3: Executive Summary - Chart on Global Market Characteristics
- Exhibits4: Executive Summary - Chart on Market By Geographical Landscape
- Exhibits5: Executive Summary - Chart on Market Segmentation by Technology
- Exhibits6: Executive Summary - Chart on Market Segmentation by Application
- Exhibits7: Executive Summary - Chart on Incremental Growth
- Exhibits8: Executive Summary - Data Table on Incremental Growth
- Exhibits9: Executive Summary - Chart on Vendor Market Positioning
- Exhibits10: Parent market
- Exhibits11: Market Characteristics
- Exhibits12: Offerings of vendors included in the market definition
- Exhibits13: Market segments
- Exhibits14: Chart on Global - Market size and forecast 2023-2028 ($ million)
- Exhibits15: Data Table on Global - Market size and forecast 2023-2028 ($ million)
- Exhibits16: Chart on Global Market: Year-over-year growth 2023-2028 (%)
- Exhibits17: Data Table on Global Market: Year-over-year growth 2023-2028 (%)
- Exhibits18: Historic Market Size - Data Table on global vapor compression distiller market 2018 - 2022 ($ million)
- Exhibits19: Historic Market Size - Technology Segment 2018 - 2022 ($ million)
- Exhibits20: Historic Market Size - Application Segment 2018 - 2022 ($ million)
- Exhibits21: Historic Market Size - Geography Segment 2018 - 2022 ($ million)
- Exhibits22: Historic Market Size - Country Segment 2018 - 2022 ($ million)
- Exhibits23: Five forces analysis - Comparison between 2023 and 2028
- Exhibits24: Chart on Bargaining power of buyers - Impact of key factors 2023 and 2028
- Exhibits25: Bargaining power of suppliers - Impact of key factors in 2023 and 2028
- Exhibits26: Threat of new entrants - Impact of key factors in 2023 and 2028
- Exhibits27: Threat of substitutes - Impact of key factors in 2023 and 2028
- Exhibits28: Threat of rivalry - Impact of key factors in 2023 and 2028
- Exhibits29: Chart on Market condition - Five forces 2023 and 2028
- Exhibits30: Chart on Technology - Market share 2023-2028 (%)
- Exhibits31: Data Table on Technology - Market share 2023-2028 (%)
- Exhibits32: Chart on Comparison by Technology
- Exhibits33: Data Table on Comparison by Technology
- Exhibits34: Chart on Mechanical vapor compression - Market size and forecast 2023-2028 ($ million)
- Exhibits35: Data Table on Mechanical vapor compression - Market size and forecast 2023-2028 ($ million)
- Exhibits36: Chart on Mechanical vapor compression - Year-over-year growth 2023-2028 (%)
- Exhibits37: Data Table on Mechanical vapor compression - Year-over-year growth 2023-2028 (%)
- Exhibits38: Chart on Thermal vapor compression - Market size and forecast 2023-2028 ($ million)
- Exhibits39: Data Table on Thermal vapor compression - Market size and forecast 2023-2028 ($ million)
- Exhibits40: Chart on Thermal vapor compression - Year-over-year growth 2023-2028 (%)
- Exhibits41: Data Table on Thermal vapor compression - Year-over-year growth 2023-2028 (%)
- Exhibits42: Market opportunity by Technology ($ million)
- Exhibits43: Data Table on Market opportunity by Technology ($ million)
- Exhibits44: Chart on Application - Market share 2023-2028 (%)
- Exhibits45: Data Table on Application - Market share 2023-2028 (%)
- Exhibits46: Chart on Comparison by Application
- Exhibits47: Data Table on Comparison by Application
- Exhibits48: Chart on Pharmaceutical - Market size and forecast 2023-2028 ($ million)
- Exhibits49: Data Table on Pharmaceutical - Market size and forecast 2023-2028 ($ million)
- Exhibits50: Chart on Pharmaceutical - Year-over-year growth 2023-2028 (%)
- Exhibits51: Data Table on Pharmaceutical - Year-over-year growth 2023-2028 (%)
- Exhibits52: Chart on Food industry - Market size and forecast 2023-2028 ($ million)
- Exhibits53: Data Table on Food industry - Market size and forecast 2023-2028 ($ million)
- Exhibits54: Chart on Food industry - Year-over-year growth 2023-2028 (%)
- Exhibits55: Data Table on Food industry - Year-over-year growth 2023-2028 (%)
- Exhibits56: Chart on Chemical industry - Market size and forecast 2023-2028 ($ million)
- Exhibits57: Data Table on Chemical industry - Market size and forecast 2023-2028 ($ million)
- Exhibits58: Chart on Chemical industry - Year-over-year growth 2023-2028 (%)
- Exhibits59: Data Table on Chemical industry - Year-over-year growth 2023-2028 (%)
- Exhibits60: Chart on Others - Market size and forecast 2023-2028 ($ million)
- Exhibits61: Data Table on Others - Market size and forecast 2023-2028 ($ million)
- Exhibits62: Chart on Others - Year-over-year growth 2023-2028 (%)
- Exhibits63: Data Table on Others - Year-over-year growth 2023-2028 (%)
- Exhibits64: Market opportunity by Application ($ million)
- Exhibits65: Data Table on Market opportunity by Application ($ million)
- Exhibits66: Analysis of price sensitivity, lifecycle, customer purchase basket, adoption rates, and purchase criteria
- Exhibits67: Chart on Market share By Geographical Landscape 2023-2028 (%)
- Exhibits68: Data Table on Market share By Geographical Landscape 2023-2028 (%)
- Exhibits69: Chart on Geographic comparison
- Exhibits70: Data Table on Geographic comparison
- Exhibits71: Chart on APAC - Market size and forecast 2023-2028 ($ million)
- Exhibits72: Data Table on APAC - Market size and forecast 2023-2028 ($ million)
- Exhibits73: Chart on APAC - Year-over-year growth 2023-2028 (%)
- Exhibits74: Data Table on APAC - Year-over-year growth 2023-2028 (%)
- Exhibits75: Chart on Europe - Market size and forecast 2023-2028 ($ million)
- Exhibits76: Data Table on Europe - Market size and forecast 2023-2028 ($ million)
- Exhibits77: Chart on Europe - Year-over-year growth 2023-2028 (%)
- Exhibits78: Data Table on Europe - Year-over-year growth 2023-2028 (%)
- Exhibits79: Chart on North America - Market size and forecast 2023-2028 ($ million)
- Exhibits80: Data Table on North America - Market size and forecast 2023-2028 ($ million)
- Exhibits81: Chart on North America - Year-over-year growth 2023-2028 (%)
- Exhibits82: Data Table on North America - Year-over-year growth 2023-2028 (%)
- Exhibits83: Chart on Middle East and Africa - Market size and forecast 2023-2028 ($ million)
- Exhibits84: Data Table on Middle East and Africa - Market size and forecast 2023-2028 ($ million)
- Exhibits85: Chart on Middle East and Africa - Year-over-year growth 2023-2028 (%)
- Exhibits86: Data Table on Middle East and Africa - Year-over-year growth 2023-2028 (%)
- Exhibits87: Chart on South America - Market size and forecast 2023-2028 ($ million)
- Exhibits88: Data Table on South America - Market size and forecast 2023-2028 ($ million)
- Exhibits89: Chart on South America - Year-over-year growth 2023-2028 (%)
- Exhibits90: Data Table on South America - Year-over-year growth 2023-2028 (%)
- Exhibits91: Chart on China - Market size and forecast 2023-2028 ($ million)
- Exhibits92: Data Table on China - Market size and forecast 2023-2028 ($ million)
- Exhibits93: Chart on China - Year-over-year growth 2023-2028 (%)
- Exhibits94: Data Table on China - Year-over-year growth 2023-2028 (%)
- Exhibits95: Chart on US - Market size and forecast 2023-2028 ($ million)
- Exhibits96: Data Table on US - Market size and forecast 2023-2028 ($ million)
- Exhibits97: Chart on US - Year-over-year growth 2023-2028 (%)
- Exhibits98: Data Table on US - Year-over-year growth 2023-2028 (%)
- Exhibits99: Chart on India - Market size and forecast 2023-2028 ($ million)
- Exhibits100: Data Table on India - Market size and forecast 2023-2028 ($ million)
- Exhibits101: Chart on India - Year-over-year growth 2023-2028 (%)
- Exhibits102: Data Table on India - Year-over-year growth 2023-2028 (%)
- Exhibits103: Chart on Germany - Market size and forecast 2023-2028 ($ million)
- Exhibits104: Data Table on Germany - Market size and forecast 2023-2028 ($ million)
- Exhibits105: Chart on Germany - Year-over-year growth 2023-2028 (%)
- Exhibits106: Data Table on Germany - Year-over-year growth 2023-2028 (%)
- Exhibits107: Chart on UK - Market size and forecast 2023-2028 ($ million)
- Exhibits108: Data Table on UK - Market size and forecast 2023-2028 ($ million)
- Exhibits109: Chart on UK - Year-over-year growth 2023-2028 (%)
- Exhibits110: Data Table on UK - Year-over-year growth 2023-2028 (%)
- Exhibits111: Market opportunity By Geographical Landscape ($ million)
- Exhibits112: Data Tables on Market opportunity By Geographical Landscape ($ million)
- Exhibits113: Impact of drivers and challenges in 2023 and 2028
- Exhibits114: Overview on Criticality of inputs and Factors of differentiation
- Exhibits115: Overview on factors of disruption
- Exhibits116: Impact of key risks on business
- Exhibits117: Vendors covered
- Exhibits118: Matrix on vendor position and classification
- Exhibits119: Alfa Laval AB - Overview
- Exhibits120: Alfa Laval AB - Business segments
- Exhibits121: Alfa Laval AB - Key news
- Exhibits122: Alfa Laval AB - Key offerings
- Exhibits123: Alfa Laval AB - Segment focus
- Exhibits124: Aqua Chem Inc. - Overview
- Exhibits125: Aqua Chem Inc. - Product / Service
- Exhibits126: Aqua Chem Inc. - Key offerings
- Exhibits127: BRAM COR S.p.A. - Overview
- Exhibits128: BRAM COR S.p.A. - Product / Service
- Exhibits129: BRAM COR S.p.A. - Key offerings
- Exhibits130: Chart Industries Inc. - Overview
- Exhibits131: Chart Industries Inc. - Business segments
- Exhibits132: Chart Industries Inc. - Key offerings
- Exhibits133: Chart Industries Inc. - Segment focus
- Exhibits134: Chutian Technology Co. Ltd. - Overview
- Exhibits135: Chutian Technology Co. Ltd. - Product / Service
- Exhibits136: Chutian Technology Co. Ltd. - Key offerings
- Exhibits137: GEA Group AG - Overview
- Exhibits138: GEA Group AG - Business segments
- Exhibits139: GEA Group AG - Key offerings
- Exhibits140: GEA Group AG - Segment focus
- Exhibits141: Genist Technocracy Pvt Ltd - Overview
- Exhibits142: Genist Technocracy Pvt Ltd - Product / Service
- Exhibits143: Genist Technocracy Pvt Ltd - Key offerings
- Exhibits144: Grundfos Holding AS - Overview
- Exhibits145: Grundfos Holding AS - Product / Service
- Exhibits146: Grundfos Holding AS - Key news
- Exhibits147: Grundfos Holding AS - Key offerings
- Exhibits148: Kalina Engineering Pvt Ltd. - Overview
- Exhibits149: Kalina Engineering Pvt Ltd. - Product / Service
- Exhibits150: Kalina Engineering Pvt Ltd. - Key offerings
- Exhibits151: LPR Global Inc. - Overview
- Exhibits152: LPR Global Inc. - Product / Service
- Exhibits153: LPR Global Inc. - Key offerings
- Exhibits154: Paul Mueller Co. Inc. - Overview
- Exhibits155: Paul Mueller Co. Inc. - Business segments
- Exhibits156: Paul Mueller Co. Inc. - Key offerings
- Exhibits157: Paul Mueller Co. Inc. - Segment focus
- Exhibits158: Puretech - Overview
- Exhibits159: Puretech - Product / Service
- Exhibits160: Puretech - Key offerings
- Exhibits161: RAG Stiftung - Overview
- Exhibits162: RAG Stiftung - Product / Service
- Exhibits163: RAG Stiftung - Key offerings
- Exhibits164: wemacequipment.com - Overview
- Exhibits165: wemacequipment.com - Product / Service
- Exhibits166: wemacequipment.com - Key offerings
- Exhibits167: Zibo Huazhou Pharmaceutical Equipment Co. Ltd. - Overview
- Exhibits168: Zibo Huazhou Pharmaceutical Equipment Co. Ltd. - Product / Service
- Exhibits169: Zibo Huazhou Pharmaceutical Equipment Co. Ltd. - Key offerings
- Exhibits170: Inclusions checklist
- Exhibits171: Exclusions checklist
- Exhibits172: Currency conversion rates for US$
- Exhibits173: Research methodology
- Exhibits174: Validation techniques employed for market sizing
- Exhibits175: Information sources
- Exhibits176: List of abbreviations
The vapor compression distiller market is forecasted to grow by USD 543.67 mn during 2023-2028, accelerating at a CAGR of 6.2% during the forecast period. The report on the vapor compression distiller market provides a holistic analysis, market size and forecast, trends, growth drivers, and challenges, as well as vendor analysis covering around 25 vendors.
The report offers an up-to-date analysis regarding the current market scenario, the latest trends and drivers, and the overall market environment. The market is driven by an increase in population and rise in demand for potable water, an increasing need for enhanced quality and prevention of pollution of water sources, and global climate change leading to need for increased investments in desalination plants.
Technavio's vapor compression distiller market is segmented as below:
| Market Scope | |
|---|---|
| Base Year | 2024 |
| End Year | 2028 |
| Series Year | 2024-2028 |
| Growth Momentum | Accelerate |
| YOY 2024 | 5.36% |
| CAGR | 6.2% |
| Incremental Value | $543.67mn |
By Technology
- Mechanical vapor compression
- Thermal vapor compression
By Application
- Pharmaceutical
- Food industry
- Chemical industry
- Others
By Geographical Landscape
- APAC
- Europe
- North America
- Middle East and Africa
- South America
This study identifies the increasing investments in wastewater treatment plants as one of the prime reasons driving the vapor compression distiller market growth during the next few years. Also, growing applications of water purifiers and rising industrial adoption of zero-level discharge (ZLD) policies will lead to sizable demand in the market.
The report on the vapor compression distiller market covers the following areas:
- Vapor compression distiller market sizing
- Vapor compression distiller market forecast
- Vapor compression distiller market industry analysis
The robust vendor analysis is designed to help clients improve their market position, and in line with this, this report provides a detailed analysis of several leading vapor compression distiller market vendors that include Alfa Laval AB, Aqua Chem Inc., BRAM COR S.p.A., Chart Industries Inc., Chutian Technology Co. Ltd., GEA Group AG, Genist Technocracy Pvt Ltd, Grundfos Holding AS, Kalina Engineering Pvt Ltd., LPR Global Inc., Paul Mueller Co. Inc., Puretech, RAG Stiftung, wemacequipment.com, and Zibo Huazhou Pharmaceutical Equipment Co. Ltd.. Also, the vapor compression distiller market analysis report includes information on upcoming trends and challenges that will influence market growth. This is to help companies strategize and leverage all forthcoming growth opportunities.
The study was conducted using an objective combination of primary and secondary information including inputs from key participants in the industry. The report contains a comprehensive market and vendor landscape in addition to an analysis of the key vendors.
The publisher presents a detailed picture of the market by the way of study, synthesis, and summation of data from multiple sources by an analysis of key parameters such as profit, pricing, competition, and promotions. It presents various market facets by identifying the key industry influencers. The data presented is comprehensive, reliable, and a result of extensive research - both primary and secondary. The market research reports provide a complete competitive landscape and an in-depth vendor selection methodology and analysis using qualitative and quantitative research to forecast the accurate market growth.
Table of Contents
1 Executive Summary
- 1.1 Market overview
2 Market Landscape
- 2.1 Market ecosystem
3 Market Sizing
- 3.1 Market definition
- 3.2 Market segment analysis
- 3.3 Market size 2023
- 3.4 Market outlook: Forecast for 2023-2028
4 Historic Market Size
- 4.1 Global vapor compression distiller market 2018 - 2022
- 4.2 Technology Segment Analysis 2018 - 2022
- 4.3 Application Segment Analysis 2018 - 2022
- 4.4 Geography Segment Analysis 2018 - 2022
- 4.5 Country Segment Analysis 2018 - 2022
5 Five Forces Analysis
- 5.1 Five forces summary
- 5.2 Bargaining power of buyers
- 5.3 Bargaining power of suppliers
- 5.4 Threat of new entrants
- 5.5 Threat of substitutes
- 5.6 Threat of rivalry
- 5.7 Market condition
6 Market Segmentation by Technology
- 6.1 Market segments
- 6.2 Comparison by Technology
- 6.3 Mechanical vapor compression - Market size and forecast 2023-2028
- 6.4 Thermal vapor compression - Market size and forecast 2023-2028
- 6.5 Market opportunity by Technology
7 Market Segmentation by Application
- 7.1 Market segments
- 7.2 Comparison by Application
- 7.3 Pharmaceutical - Market size and forecast 2023-2028
- 7.4 Food industry - Market size and forecast 2023-2028
- 7.5 Chemical industry - Market size and forecast 2023-2028
- 7.6 Others - Market size and forecast 2023-2028
- 7.7 Market opportunity by Application
8 Customer Landscape
- 8.1 Customer landscape overview
9 Geographic Landscape
- 9.1 Geographic segmentation
- 9.2 Geographic comparison
- 9.3 APAC - Market size and forecast 2023-2028
- 9.4 Europe - Market size and forecast 2023-2028
- 9.5 North America - Market size and forecast 2023-2028
- 9.6 Middle East and Africa - Market size and forecast 2023-2028
- 9.7 South America - Market size and forecast 2023-2028
- 9.8 China - Market size and forecast 2023-2028
- 9.9 US - Market size and forecast 2023-2028
- 9.10 India - Market size and forecast 2023-2028
- 9.11 Germany - Market size and forecast 2023-2028
- 9.12 UK - Market size and forecast 2023-2028
- 9.13 Market opportunity By Geographical Landscape
10 Drivers, Challenges, and Trends
- 10.1 Market drivers
- 10.2 Market challenges
- 10.3 Impact of drivers and challenges
- 10.4 Market trends
11 Vendor Landscape
- 11.1 Overview
- 11.2 Vendor landscape
- 11.3 Landscape disruption
- 11.4 Industry risks
12 Vendor Analysis
- 12.1 Vendors covered
- 12.2 Market positioning of vendors
- 12.3 Alfa Laval AB
- 12.4 Aqua Chem Inc.
- 12.5 BRAM COR S.p.A.
- 12.6 Chart Industries Inc.
- 12.7 Chutian Technology Co. Ltd.
- 12.8 GEA Group AG
- 12.9 Genist Technocracy Pvt Ltd
- 12.10 Grundfos Holding AS
- 12.11 Kalina Engineering Pvt Ltd.
- 12.12 LPR Global Inc.
- 12.13 Paul Mueller Co. Inc.
- 12.14 Puretech
- 12.15 RAG Stiftung
- 12.16 wemacequipment.com
- 12.17 Zibo Huazhou Pharmaceutical Equipment Co. Ltd.
13 Appendix
- 13.1 Scope of the report
- 13.2 Inclusions and exclusions checklist
- 13.3 Currency conversion rates for US$
- 13.4 Research methodology
- 13.5 List of abbreviations

